


saveyourassetsfirst3 |
- Silver Nowhere Near Backwardation
- Fed Holds Serve- No Rate Hike, Hints at Delay
- Gold Stocks Hit Lows Not Seen Since 2002
- 2:00PM Water Cooler 7/29/15
- Gold Market Quiet, Back to Slow Motion Ahead of US Fed Decision on Rates
- Comex Leverage Widens To Record
- A Critical Pivot Point For Gold And Everything Else
- Here’s What Happens When Hackers Shut Down a Jeep’s Engine Going 70mph on a Highway
- Copper, China And World Trade Are All Screaming That The Next Economic Crisis Is Here
- This Study Shows How -Value Investors- Turned $10,000 into $22,004,691
- Gold Below $1000: Plausible?
- Bail-Ins at “Bad Bank” Unconstitutional Says Austrian Court
- Buy and “Own Krugerrands” Says Legendary Jim Grant
- Stephen Corley: Why I’m bearish on Dubai property again
- Where Gold Goes From Here
- Gold market liquidity and manipulation
- Silver Institute sees uptick in Silver demand in H1 2015
- Gold market liquidity and manipulation
- Silver Forecast July 29, 2015, Technical Analysis
- Gold Treading Water As S&P 500 Tries To Launch Recovery
- Gold Continues To Consolidate Around $1095
- Perth Mint reports boom in gold demand from China, India and Thailand
- Gold favors rebound into Mid August
- Chinese stock market crash the end of gold’s bear phase?
- An Expert That Correctly Called The Last Two Stock Market Crashes Is Now Predicting Another One
- Rob Kirby: We’re Coming Into End Of Times!
- This is how the Fed has fueled the commodities crash
- GBP And Gold Trend Line Analysis – July 28th, 2015
- Watch This New Chart Pattern Forming in Gold After Its Flash Crash
| Silver Nowhere Near Backwardation Posted: 29 Jul 2015 12:00 PM PDT The silver price dropped about 20 cents last week (i.e. the price of the dollar, measured in silver rose to about 2.12g silver). However, the cobasis actually fell. The December cobasis is nowhere near backwardation. The bottom line is that the fundamental price of silver fell even more. It is now dead even with the […] The post Silver Nowhere Near Backwardation appeared first on Silver Doctors. |
| Fed Holds Serve- No Rate Hike, Hints at Delay Posted: 29 Jul 2015 11:06 AM PDT Committee reaffirms that ZIRP remains appropriate, hints at delay to rate hikes Gold and silver initially jumping on the releaseFull FOMC Statement is below: Silver reacts: Gold jumps towards $1100: From the FOMC: For immediate release Information received since the Federal Open Market Committee met in June indicates that economic activity has been […] The post Fed Holds Serve- No Rate Hike, Hints at Delay appeared first on Silver Doctors. |
| Gold Stocks Hit Lows Not Seen Since 2002 Posted: 29 Jul 2015 11:00 AM PDT The selling in gold (and silver) stocks has been nothing short of brutal in the past several sessions, save for a modest bounce Tuesday. Submitted by Tim Staermose, Sovereign Man: The Philadelphia Gold & Silver Index of precious metals mining companies is now back to levels last seen in 2002. Gold then was less than 1/3rd the […] The post Gold Stocks Hit Lows Not Seen Since 2002 appeared first on Silver Doctors. |
| Posted: 29 Jul 2015 11:00 AM PDT Today's Water Cooler: TPP in Maui (watch Malaysia), home sales iffy, bnd worries, Cincinnati shooting video, imperial collapse watch, fear |
| Gold Market Quiet, Back to Slow Motion Ahead of US Fed Decision on Rates Posted: 29 Jul 2015 10:31 AM PDT Bullion Vault |
| Comex Leverage Widens To Record Posted: 29 Jul 2015 10:30 AM PDT With a move yesterday by JPM to reclassify 104,000 ounces of gold from registered to eligible, the total Comex registered vault has fallen to the lowest level in recent memory. Submitted by Craig Hemke, TFMetalsReport: Now, I can show you any number of CME Gold Stocks reports from the last few years that purport to […] The post Comex Leverage Widens To Record appeared first on Silver Doctors. |
| A Critical Pivot Point For Gold And Everything Else Posted: 29 Jul 2015 10:30 AM PDT seekingalpha |
| Here’s What Happens When Hackers Shut Down a Jeep’s Engine Going 70mph on a Highway Posted: 29 Jul 2015 10:00 AM PDT If two guys working out of a basement estimate they can hack 471,000 vehicles made by Chrysler from their couch, just imagine what a more sophisticated and well funded team can do… Submitted by Michael Krieger, Liberty Blitzkrieg: Some of you have probably already read Wired's shocking article published yesterday titled: Hackers Remotely Kill a […] The post Here's What Happens When Hackers Shut Down a Jeep's Engine Going 70mph on a Highway appeared first on Silver Doctors. |
| Copper, China And World Trade Are All Screaming That The Next Economic Crisis Is Here Posted: 29 Jul 2015 09:05 AM PDT If you are looking for a "canary in a coal mine" type of warning for the entire global economy, you have a whole bunch to pick from right now. "Dr. Copper" just hit a six year low, Morgan Stanley is warning that this could be the worst oil price crash in 45 years, the Chinese […] The post Copper, China And World Trade Are All Screaming That The Next Economic Crisis Is Here appeared first on Silver Doctors. |
| This Study Shows How -Value Investors- Turned $10,000 into $22,004,691 Posted: 29 Jul 2015 09:00 AM PDT The O'Shaughnessy study strongly suggests that over time, 'value' completely trumps growth. Submitted by Tim Price, Sovereign Man: History and convention tell us that bonds are the 'safest' investments in the world. Yet it is the crowning irony of the current financial situation that policy makers have made these traditionally safe assets the most […] The post This Study Shows How -Value Investors- Turned $10,000 into $22,004,691 appeared first on Silver Doctors. |
| Posted: 29 Jul 2015 09:00 AM PDT investing |
| Bail-Ins at “Bad Bank” Unconstitutional Says Austrian Court Posted: 29 Jul 2015 08:31 AM PDT gold.ie |
| Buy and “Own Krugerrands” Says Legendary Jim Grant Posted: 29 Jul 2015 07:49 AM PDT Jim Grant, publisher of Grant's Interest Rate Observer says that gold is "an investment in financial and monetary disorder." He believes that today we are experiencing "uncertainty, turbulence and disorder". When asked how he liked to own gold he said he owned physical, generic, non-numismatic coins – specifically mentioning South African Gold Krugerrands. Submitted […] The post Buy and "Own Krugerrands" Says Legendary Jim Grant appeared first on Silver Doctors. |
| Stephen Corley: Why I’m bearish on Dubai property again Posted: 29 Jul 2015 07:05 AM PDT Is it possible? I've found something just as tedious, more prone to media hypothesis and equal measures of uninformed opinion, bias and blather than China, Greece and gold: Dubai property! Overbuilding again The city continues in the meantime to resemble a gigantic quarry site with clouds of stifling superheated dust only temporarily obscuring the gigantic real estate developments that continue to push the city towards another potential tipping point. The local property market peaked in April 2014 and clearly since then prices have fallen circa 20-25 per cent, although judging only by the month's headlines it would be impossible to reach any objective conclusion. Recent weeks saw various pieces, notably from that citadel of objectivity, Arabian Business, stating in turn: ‘Dubai residential rents post first quarterly drop since 2011′ followed by ‘Dubai house prices forecast to rebound in late 2016, early 2017′ and then ‘Dubai rents show robust growth in Q2′. Al Habtoor A vitriolic opinion piece from resident construction billionaire Mr. Khalaf Al Habtoor singled out Standard and Poor's for having the temerity to suggest property would fall a further 10-20 per cent. Both CBRE and JLL, locally the leading players in the real estate market, confirm that the legitimate housing market is in correction mode. JLL had predicted that the oil price crash and the lack of affordability metrics in the UAE would mean at least a 10 per cent additional correction in Dubai home prices and rents. Both these points are critical in any objective assessment of Dubai's property outlook. Costly city The presumed hordes of new residents in the city are not those likely to spend at least $81,000 per annum on a run of the mill town dwelling and then shell out a further $1,000 a month on utilities. Nor will they be the type of individuals capable of spending $1.5 million for a breeze block affair in an out of town gated community affair which, had they existed fifty years ago would surely have been the inspiration for the famous 1962 Pete Seeger hit ‘If I Had a Hammer’. Finance Directors are questioning the current unsustainable costs of setting up business and more importantly, the wisdom of relocating senior executives here. It is no shock that the most common social events in my diary recently have been leaving parties. Couple that with a downturn in all oil related business, overcapacity, and reduced revenues in container and shipping business plus the loss of significant tourism and investment from Russia and China and the outlook does not seem that rosy. Gold's misfortunes too have a profound impact on the city's finances. Supporters point to the frequent ‘sell out’ property launches as evidence of real estate strength. That has more to do with the highly unusual metrics of the local property market and the acknowledged super liquidity of the regional speculators than genuine demand. Cheap tactics such as providing free luxury cars in certain high end developments are not necessary in more mature markets. Oil prices Recent suggestions that residents will benefit from lower energy prices also seems to have been squashed with the announcement of a 24 per cent hike in Dubai gasoline prices on Saturday. Prices are set to fall further. * Stephen Corley first worked for the Rothschild family in his long City career and now runs a company doctor consultancy Oryx Projects from Dubai. He writes exclusively for ArabianMoney. |
| Posted: 29 Jul 2015 07:00 AM PDT If you're interested in gold, there's really only one thing you need to consider: By Joshua Krause, The Daily Sheople: On Monday, the price of gold briefly fell to $1080 per ounce, which is the lowest price it has seen in 5 years. As of today, it still hasn't returned to its previous level. […] The post Where Gold Goes From Here appeared first on Silver Doctors. |
| Gold market liquidity and manipulation Posted: 29 Jul 2015 06:05 AM PDT Yesterday Chris Powell of GATA criticised an article by Clif Droke on market manipulation. One point caught my eye, where Chris identified "an 'ipse dixit', an assertion made without authority" that Clif made, namely that "the market for gold is immensely huge and virtually impossible for any one entity to control its price swings … Even a coterie of interests devoted to pushing gold prices lower would meet with certain failure due to the enormous size and complexity of the market." It is one thing for Clif to claim that one entity could not control the gold market, but it strikes me as quite bold to claim a "devoted coterie" could not do it. To assess Clif's claim we need factual examples of gold market liquidity so that we can "assert with authority" and solve this ipse dixit problem. Being the gold nerd that I am, over the past few years I have accumulated a number of statements about actual gold market liquidity (primarily because I've been annoyed with trite statements about how gold is "highly liquid" without any quantification) and thankfully now I have a use for them. [read more] |
| Silver Institute sees uptick in Silver demand in H1 2015 Posted: 29 Jul 2015 04:57 AM PDT The U.S. is the largest importer of silver jewellery, as measured in dollar terms, and this demand impacts silver trade across Asia. |
| Gold market liquidity and manipulation Posted: 29 Jul 2015 03:15 AM PDT Perth Mint |
| Silver Forecast July 29, 2015, Technical Analysis Posted: 29 Jul 2015 01:05 AM PDT fxempire |
| Gold Treading Water As S&P 500 Tries To Launch Recovery Posted: 29 Jul 2015 12:55 AM PDT investing |
| Gold Continues To Consolidate Around $1095 Posted: 29 Jul 2015 12:55 AM PDT investing |
| Perth Mint reports boom in gold demand from China, India and Thailand Posted: 28 Jul 2015 11:32 PM PDT Today’s survey showing a fall in gold demand may already be history as Perth Mint reports a boom in demand from China, India and Thailand in the wake of recent price falls. Perth Mint Treasurer Nigel Moffatt discusses how demand for gold has surged on slumping prices and the Chinese stock market crash. He speaks to Bloomberg's Yvonne Man on ‘First Up’… |
| Gold favors rebound into Mid August Posted: 28 Jul 2015 10:17 PM PDT Commodity Trader |
| Chinese stock market crash the end of gold’s bear phase? Posted: 28 Jul 2015 09:42 PM PDT Could a six-year cyclical low for gold demand prove to be a major cyclical low for the precious metal? Certainly it looks the exact inverse of the six-year global stock market recovery, and that has now decisively broken down in China. World gold demand hit a six-year low in the second quarter of 2015 on weak demand from China. Stock market growth was the story of the first five months in China and retail investors switched from buying gold to stocks. Chinese equity crash But the Chinese market crash in June and July did not instantly boost gold purchasing either, as this scared would-be buyers away from any investment activity and bankrupted others. At 35 tonnes, Chinese retail bar and coin purchases fell 26 per cent year-on-year, its weakest second quarter since 2009. Jewellery purchases in China also fell to 102 tonnes during the second quarter, a 23 per cent year-on-year decline. Continued poor sentiment toward gold and better returns from equity markets led many to shun the yellow metal before the stock market tanked. There are also signs that as a safe haven asset, some investors have moved toward the dollar, at least temporarily. In June, the People's Bank of China reported increased gold holdings for first time in six years, an extra 604 tonnes, though this proved a disappointment too as it came it at the lower end of estimates even if it continues to misrepresent the true position with Chinese national gold reserves. The latest Thomson Reuters GFMS gold survey showed that the world gold demand dropped a total of 14 per cent during the second quarter to 858 tonnes compared with 1,000 tonnes in the same quarter last year and was down 15 per cent from the previous quarter. Incredible India Jewellery consumption in India rose 2.5 per cent year-on-year to 158 tonnes, while retail investment was steady at 50 tonnes. Gross Indian imports dropped to the lowest in five quarters, falling to 184 tonnes against 205 tonnes for the same period last year. Seasonal strength has seen India reclaim the No1 position in total gold consumption from China. However, the first half was finely balanced with China narrowly edging out India at 394 tonnes versus 392 tonnes. With this weak demand, however, world gold supply surplus shot up to 196 tonnes. ‘Physical gold demand in the second quarter of 2015 was at its weakest since 2009, as few markets reported increases and Chinese buyers stayed away from gold,’ said the survey. ‘Almost all major physical gold markets suffered in the second quarter as retail investment fell another 12 per cent year-on-year and is now 63 per cent below its peak in the second quarter of 2013… in spite of a 7.5 per cent fall in average US dollar gold prices.’ Looking forward the survey forecasts the gold price to average at $1,135 an ounce in the third quarter and $1,175 in the fourth. In the second quarter it fell to $1,192, the lowest in two years. Price bottom Gold prices seem to have bottomed out on the weakest physical demand in six years. When a cycle bottoms out the only question is how strong the recovery proves to be. That will most likely depend on on how other asset classes perform in the near future. Pending stock and bond crashes in many markets around the world could still result in a much higher gold price far more quickly than any official forecaster is prepared to acknowledge. The Chinese equity crash is the start of these dominos falling, and much higher gold prices will follow. |
| An Expert That Correctly Called The Last Two Stock Market Crashes Is Now Predicting Another One Posted: 28 Jul 2015 06:41 PM PDT
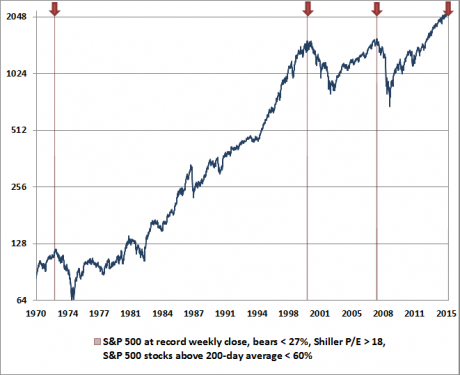
It was an excellent article by Jim Quinn of the Burning Platform that first alerted me to Hussman’s latest warning. If you don’t follow Quinn’s work already, you should, because it is excellent. When someone is repeatedly correct about the financial markets, we should all start paying attention. Back in late 2007, Hussman warned us about what was coming in 2008, but most people did not listen. Now he is sounding the alarm again. According to Hussman, when there is a confluence of four key market indicators, that tells us that the market has peaked and is in danger of crashing. The following comes from Newsmax…
It is quite rare for the market to set a new record high on a weekly closing basis and have more than 40 percent of stocks below their 200-day moving averages at the same time. That is why a confluence of all these factors is fairly uncommon. Hussman elaborated on this in his recent report…
The following is the chart that immediately followed the paragraph in his report that you just read…
When I first took a look at that chart I could hardly believe it. It appears that Hussman’s signals are able to indicate major stock market crashes with stunning precision. And considering the fact that we just hit a new “ding” for the first time since the last financial crisis, what Hussman is saying is more than just a little bit ominous. According to Hussman this is not just a recent phenomenon either. Even though advisory sentiment figures were not available back in 1929, he believes that his indicators would have given a signal that a market crash was imminent in August of that year as well…
Of course the past is the past, and what has happened in the past will not necessarily happen in the future. So is Hussman wrong this time? With all of the other things that are happening in the financial world right now, I certainly would not bet against him. Other financial professionals are concerned that a market crash could be imminent as well. The following comes from a piece authored by Andrew Adams…
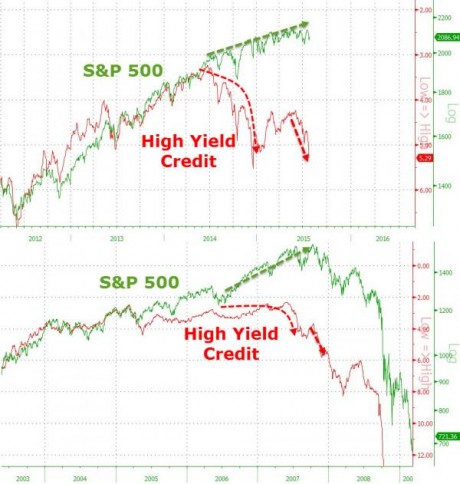
Sometimes, a picture is worth more than a thousand words. I could share many more quotes from the “experts” about why they are concerned about a potential stock market collapse, but instead I want to share with you a “bonus chart” that Zero Hedge posted on Tuesday…
Do you understand what that is saying? In 2007 and 2008, junk bonds started crashing well before stocks did. Now, we are witnessing a similar divergence. If a similar pattern holds up this time, stocks have a long, long way to fall. Like Hussman and so many others, I believe that a stock market crash and a new financial crisis are imminent. The month of August is usually a slow month in the financial world, so hopefully we can get through it without too much chaos. But once we roll into the months of September and October we will officially be in “the danger zone”. Keep an eye on China, keep an eye on Europe, and keep listening for serious trouble at “too big to fail” banks all over the planet. The next several months are going to be extremely significant, and we all need to be getting ready while we still can. |
| Rob Kirby: We’re Coming Into End Of Times! Posted: 28 Jul 2015 05:00 PM PDT There will be a mad scramble in the west by the elitists to grab what physical gold is left before the Comex completely defaults. It is quite possible, if not highly probable, that this final looting of GLD is part of that process. The gold smash going on right now reeks of desperation…the manipulation has […] The post Rob Kirby: We’re Coming Into End Of Times! appeared first on Silver Doctors. |
| This is how the Fed has fueled the commodities crash Posted: 28 Jul 2015 10:59 AM PDT From Bill Bonner, Chairman, Bonner & Partners: When we left you at the end of last week the world was falling apart. As you know, the economy functions on electronic credit… not cold, hard cash. Without the banks pumping more credit into the system – by way of loans – it sags. The Dow fell 163 points – or about 1% –on Friday. More significant is the action in the gold market. At this morning’s price of $1,103 an ounce, gold is now trading $100 below what we thought was the “floor” under the price. Why? It could be that gold is signaling a global recession/depression. People tend to buy gold when they fear inflation. All they see today is a global deflationary slump. The People’s Daily newspaper – the official organ of the Communist Party – tells us that Chinese electricity consumption is accelerating at the slowest rate in 30 years. We all know China’s GDP figures are untrustworthy, but electrons don’t lie. They flow with the economy. And they’re now only increasing at a sluggish 1.3% a year – suggesting a big slowdown in the Chinese economy. According to economists’ estimates compiled by Bloomberg – as opposed to the official spin from Beijing – China’s economy is growing at the slowest pace in 25 years. A Pileup in CommoditiesMeanwhile, on the commodities highway, there’s a huge pileup. The crash in the oil market – which has taken the price per barrel of U.S. crude down 53% over the last 12 months – has left a massive slick. A barrel of U.S. crude oil sold for just $48.14 at Friday’s close – just 42 cents above its 52-week low. Overall, commodities are at a 13-year low. And the coal miners have slid on the cheap oil and gas. In the March issue of our monthly publication, The Bill Bonner Letter, we explained why energy was so cheap. The Fed dropped the price of capital so low that it cost almost nothing to borrow. When the cheap money came to an end, so would the cheap oil, we guessed. But it hasn’t happened – yet… So far, the Fed’s cheap credit has exaggerated and prolonged the bear market in oil. Producers who should have shut down months ago are still pumping – kept in business by ultra-cheap financing. Coal, cheap when we wrote about it back in March, is now even cheaper. Today, the price of coal is down 70% from four years ago. This is pushing coal producers to the edge of solvency… For example, Alpha Natural Resources, a big producer of metallurgical coal – or “met” coal, which is used for steelmaking –was delisted from the New York Stock Exchange because its share price was “abnormally low.” Bankruptcy is now in the cards. And this from OilPrice.com on the fate of another big met coal producer, Walter Energy: Walter Energy, an Alabama coal miner, announced on July 15 that it is filing for bankruptcy. Senior lenders will see their debt turned into equity, and if the company cannot turn the ship around, it will more or less sell off all of its assets. “In the face of ongoing depressed conditions in the market for met coal, we must do what is necessary to adapt to the new reality in our industry,” Walter Energy’s CEO Walt Scheller said in a press release. Dr. Copper’s DiagnosisDr. Copper, too, says it’s going to be a rough second half of the year for the global economy. Copper has earned the “Dr.” title; the old-timers say it is “the only metal with a PhD in economics.” Copper goes into everything – houses, offices, electronics, autos, you name it. Although it’s not a perfect correlation by any means, when the price of copper falls, it indicates that the world economy is going down too. From Bloomberg: Goldman said prices will probably drop another 16% by the end of next year and expects Chinese demand to grow at the slowest pace in almost two decades. Goldman on Wednesday lowered its copper price outlook by as much as 44% through 2018. Why the big slowdown? Why is the world falling apart? Because you can’t fake an economic recovery… Instead of “stimulating” a recovery, the feds have “simulated” one. They dropped the price of capital to near zero. Commodity producers took the bait. They borrowed money and increased production. But global demand couldn’t keep up. You can’t get real demand from empty credit. Real demand comes from Main Street, not Wall Street. And for that, you need a real recovery, not a phony one. Regards, Bill Crux note: A global economic slump may be the least of your worries… As Bill has been warning, right now in America, the highest levels of government and the banking system are locked in a desperate last stand against a disturbing monetary shock… When it hits, you could suddenly be locked out of your bank account… unable to withdraw cash or use your credit card… your stocks will swing wildly out of control… your Social Security checks will pile up unopened on your kitchen table… no one will cash them… Go here now for the full story from Bill. |
| GBP And Gold Trend Line Analysis – July 28th, 2015 Posted: 28 Jul 2015 12:55 AM PDT investing |
| Watch This New Chart Pattern Forming in Gold After Its Flash Crash Posted: 28 Jul 2015 12:55 AM PDT forbes |

| You are subscribed to email updates from Gold World News Flash 2 To stop receiving these emails, you may unsubscribe now. | Email delivery powered by Google |
| Google Inc., 1600 Amphitheatre Parkway, Mountain View, CA 94043, United States | |
No comments:
Post a Comment