


saveyourassetsfirst3 |
- Gold jumps $40/oz
- Vladimir Putin is quietly taking control of this essential resource market
- Gold drops as inflation concern fades
- Rick Rule: “I Believe That Arithmetically, We’re Locked In A War That We Can’t Help But Win”
- Struggling miners see silver lining in FX, cheaper oil
- Porter Stansberry: This is the most important trend in the world today
- Silver to S&P Ratio Screaming Bottom!
- U S Dollar Stuck Just Below 88.50
- Gold bear market nears end
- Ex-NYC Mayor Mike Bloomberg on Dodd-Frank: “The Government Should Have Let the Industry Craft the Bill”
- Looming economic cloud darkens gold
- Another Gold "Reverse Flash Crash" Ahead of the Weekend
- Metals market update for November 14
- No more inflation worries: gold, platinum fall
- Gold smuggler faces $6 million tax
- Silver’s Long Lost Monetary Role – Let’s Make Some Real Money!
- Curiouser and Curiouser
- The Clarion Call
- BO POLNY: With Gold’s $1180 Triple Bottom Broken, Is the Gold Bull Market Over?
- Three charts on the economy you might not believe
- The Economy Of The Largest Superpower On The Planet Is Collapsing Right Now
- Euro Rally Pulls up Gold
- Golds Support at $1000/oz
- ‘Gold Wars’ – Swiss Gold Shenanigans Intensify Prior To November 30 Vote
- Gold’s Support at $1000/oz.
- Gold market and prices 1800-2008
- Central Banks “Managing”—That Is, Rigging—Gold “More Actively,” LBMA is Told
- Japanese Gold reserves, end of last month
- How plausible is the end of the petrodollar as proposed in ‘The Colder War’ by author Marin Katusa?
- GLD Drawdown Continues, Confirming the WGC Findings
- A Warning from the Watchman
- Harvey Organ: Evidence of Paper Settling on the COMEX?
- Marshall Swing: PMs Will Not Be Allowed to Crash Until September 2015
- Gold is never simple
- “Paper gold”: What every investor should know
| Posted: 14 Nov 2014 12:26 PM PST Weakening dollar, anticipation of Swiss vote on gold, appear to be pushing the price of gold higher. | ||||||||||||||
| Vladimir Putin is quietly taking control of this essential resource market Posted: 14 Nov 2014 12:23 PM PST By Marin Katusa, Chief Energy Investment Strategist, Casey Research: In the wake of one singular event—the disaster at Fukushima in March 2011, the effects of which are still being felt today across the planet—nuclear power has seemingly fallen into utter disrepute, at least in the popular mind. But this is largely an illusion. It's true that Japan took all 52 of its nuclear plants offline after Fukushima and sold much of its uranium inventory. South Korea followed with shutdowns of its own. Germany permanently mothballed eight of its 17 reactors and pledged to close the rest by the end of 2022. Austria and Spain have enacted laws to cease construction on new nuclear power stations. Switzerland is phasing them out. A majority of the other European nations is also opposed. All of this has resulted in a large decrease in demand for uranium, a glut of the fuel on the market, and a per-pound price that fell as low as $28.50 in mid-2014, down nearly 80% from its peak of $135 in 2007. Currently, it's languishing around $39 per pound, still below the cost of production for many miners—about 80% need prices above $40 to make any return on investment, and even at that level, no new mines will be built. It's easy to hear a death knell for nuclear energy on the breeze. And that may well be the case for Europe (except for France). But Europe is hardly the world. South Korean plants are back online. Japan is planning to restart its reactor fleet (despite a great deal of citizen protest) beginning in 2015. Russia is heavily invested, with nine plants under construction and 14 others planned. China, faced with unhealthy levels of air pollution in many of its cities due to coal power generation, is going all in on nuclear. 26 reactors are under construction, and the government has declared a goal of quadrupling present capacity—either in operation or being built—by 2020. India has 20 plants and is adding seven more. And in the rest of the developing nations, nuclear power is exploding. Worldwide, no fewer than 71 new plants are under construction in more than a dozen countries, with another 163 planned and 329 proposed. Many countries without nuclear power soon will build their first reactors, including Turkey, Kazakhstan, Indonesia, Vietnam, Egypt, Saudi Arabia, and several of the Gulf emirates. For years, China, with its stunning GDP growth rate, has been seen as the leading destination for natural resources. "Produce what China needs" has been every supplier's ongoing mantra. Yet, as many Americans fail to realize, it's their own home that is the biggest uranium consumer. Despite having not opened a new plant since 1977 (though six additional units are scheduled to open by 2020), the US is the world's #1 producer of nuclear energy, accounting for more than 30% of the global total. France is a distant second at 12%; China, playing catchup, sits at only 6% right now. The 65 American nuclear plants, housing just over 100 reactors, generate 20% of total US electricity. Yet uranium is the one fuel for which there is very little domestic supply.
As you can see, the U.S. has to import over 90% of what it uses. That's a huge shortfall—and it's persisted for many years. How has the country made it up? In a word: Russia. America's former Cold War archenemy—and antagonist in the unfolding sequel, the Colder War—has in fact been keeping the US nuclear fires burning, through conduits like the Megatons to Megawatts Program. When the USSR collapsed, Russia inherited over two million pounds of HEU—highly enriched uranium (the 90% U-235 needed to fashion a bomb)—and vast, underused facilities for handling and fabricating the material. Starting in 1993, it cut a deal with the US dubbed the Megatons to Megawatts Program. Over the 20 years that followed, 1.1 million pounds of Russian weapon-grade uranium, equivalent to about 20,000 nuclear warheads, was downblended to U3O8 and sold to the United States as fuel. That source was very important in helping to fill the U.S. supply gap for those two decades. It represented, on average, over 20 million pounds of annual uranium supply, or half of what the country consumed. I'm sure it would have come as a shock to most Americans if they'd realized that one in ten of their homes was being powered by former Soviet missiles. Megatons to Megawatts expired in November 2013, but U.S. dependence on Russia did not. Russia is easily able to maintain its sizeable export presence, due largely to present economics. Because of all the uranium swamping the market since Fukushima, separative work units (SWUs) are trading at very low prices. SWUs measure the amount of separation work necessary to enrich uranium—in other words, how much work must be done to raise the product's concentration of U-235 to the 3-5% that most reactors require for fission? The tails that are left behind when U-235 is separated out to make warheads still contain some amount of the isotope, usually around 0.2% to 0.3%. When the price of SWUs gets low enough, it's a condition known as "underfeeding," meaning it's worth the effort to go back and extract leftover U-235 from the tails. That's done through the process of re-enrichment, the reverse of the procedure that creates HEU. It's kind of like getting fresh gold from old ore that had already yielded the easy stuff. After the Soviet Union broke up, Russia had a lot of enrichment capacity it no longer needed for its military program. And major uranium companies like Areva and Urenco had sent trainloads of enrichment tails to Russia in the 1990s and early 2000s. Great stockpiles were built up, and they'll be put to use until the pendulum swings the other way and we get "overfeeding," where the price of SWUs makes re-enrichment too costly to continue. We will go from under- to overfeeding in the near future. Rising demand from the Japanese restart and new plants coming online ensures that it will happen, and probably within the next 24 months. The market is already anticipating it, with the per-pound price of uranium up more than 35% in the past few months. It's going to double to $75… at the least. Meanwhile, though, the ability to profitably produce fuel-grade uranium from tails confers on Russia a number of significant advantages. Among them:
This is one part of Vladimir Putin's plan to dominate the world energy markets. In my book, The Colder War, I call it the "Putinization" of uranium. And he has nicely positioned his country to pull it off. In January 2014, Sergei Kiriyenko, head of Russian energy giant Rosatom, was bursting with enthusiasm when he predicted that Russia's recent annual production rate of 6.5 million pounds of uranium would triple in 2015. Rosatom puts Russia's uranium reserves in the ground at 1.2 billion pounds of yellowcake, which would be the second largest in the world; the company is quite capable of mining 40 million pounds per year by 2020. Add in Russia's foreign projects in Kazakhstan, Ukraine, Uzbekistan, and Mongolia, and annual production in 2020 jumps to more than 63 million pounds. Include all of Russia's sphere of influence, and annual production easily could amount to more than 140 million pounds six years from now. No other country has a uranium mining plan nearly this ambitious. By 2020, Russia itself could be producing a third of all yellowcake. With just its close ally Kazakhstan chipping in another 25%, Russia would have effective control of more than half of world supply. That's clout. But it doesn't end there. Globally, there are a fair number of facilities for fabricating fuel rods. Not so with conversion plants (uranium oxide to uranium hexafluoride) or enrichment plants (isolating the U-235). And the world leader in conversion and enrichment is… yes, Russia. All told, Russia has one-third of all uranium conversion capacity. The United States is in second place with 18%. And Russia's share is projected to rise, assuming Rosatom proceeds with a new conversion plant planned for 2015. Similarly, Russia owns 40% of the world's enrichment capacity. Planned expansion of the existing facilities will push that share close to 50%. That's Putin's goal—to corner the conversion and enrichment markets—because it wraps Russian hands around the chokepoints in the whole yellowcake-to-electricity progression. It's a smart strategy, too—control those, and you control the availability and pricing of a product for which demand will be rising for decades. And that control will tighten, because the barrier to entry for either function is very high. Building new conversion or enrichment facilities is too costly for most countries, and it is especially difficult in the West due to the influence of environmentalists. It's worth reiterating. Russia is on track to control 58% of global yellowcake production; currently responsible for a third of yellowcake-to-uranium-hexafluoride conversion; and soon to hold half of all global enrichment capacity. There's a word for this: stranglehold. That is what Putin and Russia will have on the supply chain for nuclear fuel in a world where new atomic power plants are being constructed at warp speed, which will force the price of uranium ever higher. It will give Russia enormous global influence and great leverage in all future dealings with the U.S. America can mine some uranium domestically and buy some more from its Canadian ally. But even taken together, those sources put only a small patch on the supply gap. The U.S. government would do well to make peace with Putin, if it can, because the domestic nuclear power industry—and by extension the economic health of the country—is at the mercy of Russia, indefinitely. To get the full story, click here to order your copy of my new book, The Colder War. Inside, you'll discover more on how Putin has cornered the market on uranium, and how he's making a big play to control the world’s oil and natural gas markets. You'll also glimpse his endgame and how it will personally affect millions of investors and the lives of nearly every American. | ||||||||||||||
| Gold drops as inflation concern fades Posted: 14 Nov 2014 12:20 PM PST Gold investors are holding the least bullion through exchange- traded products since 2009. | ||||||||||||||
| Rick Rule: “I Believe That Arithmetically, We’re Locked In A War That We Can’t Help But Win” Posted: 14 Nov 2014 12:15 PM PST During a time in which sentiment towards natural resources is bordering on doom, Rick Rule, Chairman of Sprott U.S. Holdings was kind enough to share a few comments. Speaking first toward the phenomenon of market capitulation Rick noted that, "Capitulation is a very dramatic event. It's when most participants in the market give up completely and simultaneously. They […] The post Rick Rule: “I Believe That Arithmetically, We're Locked In A War That We Can't Help But Win” appeared first on Silver Doctors. | ||||||||||||||
| Struggling miners see silver lining in FX, cheaper oil Posted: 14 Nov 2014 12:15 PM PST Likely to help trim their costs. | ||||||||||||||
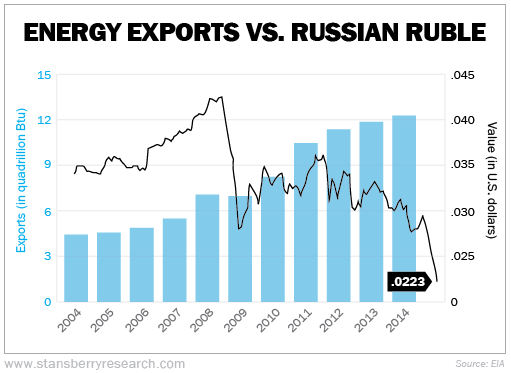
| Porter Stansberry: This is the most important trend in the world today Posted: 14 Nov 2014 11:06 AM PST From Porter Stansberry in The S&A Digest: In today’s Friday Digest… an update on the most powerful economic trend in the world. Everything else revolves around this… and yet it’s being almost completely ignored by most investors and financial media. I need to begin by giving you bit of history. Stay with me… without this historical perspective, you can’t understand the magnitude of what’s happening right now in our economy… In 1919, U.S. oilfields produced more than 1 million barrels per day of crude oil. It had taken 10 years for U.S. production to double from 500,000 barrels per day in 1909. It took seven more years for production to double again. In 1926, U.S. production was more than 2 million barrels per day. It took another 14 years for U.S. oil production to double again. By 1940, U.S. oilfields finally produced more than 4 million barrels per day on average. The next double in production took 26 years. By 1966, U.S. oilfields broke through the 8-million-barrels-per-day barrier. Nearly every oil expert in the world believed U.S. oil production had peaked in 1970 when U.S. oilfields produced 9.6 million barrels per day. Today, U.S. crude oil production is around 9 million barrels per day. At some point in early 2015, U.S. production will surpass the previous high rate of production. Here’s an even more important data point: In 2008, the U.S. hit a modern low production rate of less than 4 million barrels per day. For the year, average production was 5 million barrels. In 2015, it’s very likely that production will reach 10 million barrels per day. That’s a double in U.S. production in only seven years. The last time large-scale U.S. oil production grew this fast was back in the 1920s… And as technology continues to improve – and knowledge of these new shale oilfields grows – I have no doubt production will double again, from 10 million barrels per day in 2015 to 20 million barrels per day. I expect this next double will take seven to 10 years. The oil industry’s ability to double its production since 2008 – and then to double it again by 2022 (or so) – will have a monumental effect on the world’s economy… on our standards of living… and of course, on domestic energy prices. High-quality operators in good shale fields report a cost of production between $15 and $20 per barrel. Keep in mind… this is only the operating cost. It doesn’t include the capital costs (such as buying the land). But it gives you an idea of how much room there is for prices to fall. I would be shocked if U.S. oil prices aren’t below $60 per barrel by next year. They could fall to as low as $40. Historically, a good rule of thumb was that oil prices would trade at around 10 times natural gas prices. With natural gas between $4 and $6 per thousand cubic feet (MCF), I expect to see oil trading for around $40-$60 per barrel. (It’s important to note that at those prices, none of the Canadian oil-sands production will be profitable… a point I’ve stressed repeatedly in my criticism of Devon Energy’s large and continuous oil-sand investments.) My forecast for U.S. crude oil below $60 a barrel is way out of consensus. But even today, few people really understand the magnitude of what has been discovered… and the scope of the energy assets now being exploited in U.S. shale fields. The more shale drilling the industry does, the larger the estimates of total reserves become. In the Permian Basin in West Texas, for example, early estimates based on a few hundred drilled wells were around 20 billion to 30 billion barrels of recoverable oil. Today, shale oil producer Pioneer Natural Resource’s estimate is 75 billion barrels. That makes the Permian Basin the second-largest oilfield in the world, behind Saudi Arabia’s Ghawar Field. And less than 10 years ago, there was virtually no oil being produced at this field. No one even believed the shale oil could be produced economically. You might recall that back in 2012, I began to warn folks that crude oil prices couldn’t remain high for long. (At the time, oil was trading around $100 per barrel.) I said that $60 crude was coming. I also predicted that natural gas prices – going for less than $2 per MCF – couldn’t stay that low for long. I said natural gas prices would hit $4-$6 per MCF. So far, I’ve been right about gas… but wrong about oil. Or maybe I was just a bit early. U.S. oil prices trade for less than $80 per barrel today. It will fall to less than $60 soon. In 2004, the U.S. exported roughly 3 quadrillion British thermal units (Btu) of “high value” energy – that’s natural gas, crude oil, and petroleum products (mostly gasoline). That number doubled over the next six years, thanks almost entirely to increases in liquid natural gas production in shale fields. By 2010, the U.S. was exporting 6 quadrillion Btu of “high value” energy – mostly propane. Today, we’re exporting roughly 9 quadrillion Btu of “high value” energy every year. This trend of U.S. energy exports is going to explode over the next decade. Massive investments are being made right now to expand energy export capacity in the U.S. Perceptions about the benefits to U.S. crude oil exports are finally changing, too. Currently approved natural gas export facilities (LNG) could export up to 30% of North American natural gas production within 10 years. Propane exports have already soared – from less than 100,000 barrels per day in 2010 to more than 400,000 barrels per day today – because this dense energy liquid is not covered under the crude oil export ban. Likewise, three U.S. oil companies operating in Texas’ Eagle Ford Shale (Pioneer, Enterprise Products, and BHP Billiton) have gotten permission to export light crude oil directly from the U.S. The Brookings Institution think tank estimates that completely lifting the crude oil ban will generate more than $1.8 trillion in economic benefit to the U.S. over a 20-year period. In July, the U.S. exported 400,000 barrels of oil per day… the highest level of exports in 57 years. The United States’ emergence as both the world’s largest producer of liquid hydrocarbons and the world’s largest exporter of energy is only beginning to affect the world’s markets. Look at the massive strength of the U.S. dollar this year and compare it with the collapse of Russia’s ruble. It’s a sign of things to come. Countries whose economies depend on high prices for energy (and other raw materials) are going to struggle for at least the next decade.
Meanwhile, for the U.S., the incredible efficiency of our energy sector gives us a huge advantage in trade. As more and more of our trading partners abandon cheap energy (like nuclear and coal), our economy’s comparative advantage grows. For example, Germany – which forms the backbone of the European currency union – already gets 25% of its electricity from renewable sources. German Chancellor Angela Merkel is determined to increase this percentage to 45% by shutting down all nuclear plants by 2022 and making it nearly impossible to mine or consume coal in Germany. The cost of electricity to consumers in Germany is already twice the average price in Japan and three times the cost in America. Europe will bankrupt itself chasing the fantasy of solar power while America becomes the world’s new Saudi Arabia. EOG Resources (EOG) is widely considered the highest-quality producer of shale oil in the U.S. Its shares are up 464% over the last 10 years. The Dow Jones Industrial Average is up just 62% over the same period. Lower crude oil prices will hurt the profit margins of companies like EOG. From time to time, I expect to see big selloffs in shares of these shale-focused production companies. Investors will panic as crude oil prices fall. But I would buy on those dips… because we are still in the early stages of the most important economic trend of our lives. The U.S. oil and gas industry has decades of growth ahead of it. We are only in the first innings of this trend, which will see America emerge as both the world’s largest producer and the world’s largest exporter. Thus, temporary declines in crude oil prices will be offset by surging production and massive global demand for U.S. energy (in the long run). Make sure you’re invested in this trend. Recommended Links
| ||||||||||||||
| Silver to S&P Ratio Screaming Bottom! Posted: 14 Nov 2014 11:00 AM PST Based on Friday's upticks, last week may have been the turning point for silver prices and the silver to S&P ratio. Or perhaps the S&P will continue reaching for the sky even though QE is supposedly diminishing, while silver prices drop further below the cost of production. Both seem unlikely but we shall see. What […] The post Silver to S&P Ratio Screaming Bottom! appeared first on Silver Doctors. | ||||||||||||||
| U S Dollar Stuck Just Below 88.50 Posted: 14 Nov 2014 10:52 AM PST The US Dollar has been on an amazing bullish tear higher with the currency being the beneficiary of a roaring stock market and the sentiment that if any industrialized nation in the globe is going to raise interest rates, the US will be the first to do so. The currency has rallied more than 10% since early May of this year, a pretty impressive feat no matter how some keep trying to dismiss it. As it has rallied, gold has moved lower, creating a very good inverse relationships that the market has been comfortable with.  The Dollar however is running into some selling resistance noted at the uppermost resistance level noted on the chart just shy of the 88.50 level. Can you see the stair-stepping pattern that has been forming on the chart? During the initial phase of the current bull market in the Dollar, the currency displayed some resiliency near 79.50 - 79.00 that sparked some buying among technicians who noted the bottoming action. When it broke out above resistance near 81.50, instead of setting back somewhat as many markets are prone to do as they digest their gains, the Dollar merely tracked sideways for a very brief period before it rocketed higher supported by overwhelmingly strong fundamentals. It then stalled out near 84.50 where it consolidated a bit further before embarking on yet another leg higher. That rally took it all the way to just short of 87. The greenback set back and retreated all the way to the former resistance zone which served as downside support. From there it encountered another wave of buying which took it all the way back up to 87, which it obliterated, soaring to its recent high near the 88.50 level, where it is currently consolidating some more. As chart technicians, we are now watching to see whether this is just another pause in the relentless move higher in the greenback or the beginning of a deeper move lower. Thus far, the available evidence points to this as merely another pause. However we need to stay vigilant as always. The fundamentals that have driven the Dollar higher against the majors are still in place. the current "Long Dollar" trade has gotten a bit crowded with specs heavily net long. Perhaps some of what we are seeing today in the Forex markets is some correcting of that imbalance. For now, as long as the Dollar remains above 87.00 on a closing basis, it looks like the pause that refreshes. Time will tell...let's see what we get next week.... | ||||||||||||||
| Posted: 14 Nov 2014 10:24 AM PST Gold and gold miners have rebounded but remain in a technically weak position. Both markets have failed to move beyond the highs made last Friday. | ||||||||||||||
| Posted: 14 Nov 2014 10:00 AM PST The Dodd-Frank regulations put in place after the financial crisis are "stupid laws" that the banking industry will just ignore anyway… The world adjusts to stupid laws, they just don't pay attention to it and you get burned later on. That really is what happens, like a 25-mile-an-hour speed limit. Instead, the government should […] The post Ex-NYC Mayor Mike Bloomberg on Dodd-Frank: "The Government Should Have Let the Industry Craft the Bill" appeared first on Silver Doctors. | ||||||||||||||
| Looming economic cloud darkens gold Posted: 14 Nov 2014 09:56 AM PST The U.S. Comex gold futures traded in a narrow band of $1,155 to $1,170 in the past two days and were down 0.71% week-to-Thursday. | ||||||||||||||
| Another Gold "Reverse Flash Crash" Ahead of the Weekend Posted: 14 Nov 2014 09:41 AM PST Don't expect to hear a peep out of the Gold Is Always Manipulated All the Time" crowd about today's massive short squeeze. Here is what a huge short squeeze looks like on a chart. Pretty impressive isn't it?  Don't expect to hear such pithy and insightful "analysis" such as: "Who would buy in such large size regardless of the impact on the market if they were really trying to obtain the best possible buying price? Surely this is 'proof' that our claim of market manipulation by sinister forces is true". "These insiders and powerful forces are determined to drive the price of gold ever higher and are not even trying to hide their blatant attempts at upward price manipulation". No, you will get none of that because in their world, this is just the "right and just and fair" thing for gold to be doing. When gold sells off sharply, it is "evil bullion banks acting as agents of the Fed" behind the move. When gold moves higher as computer programs go beserk to the upside, all is good and true and right on the world once more. it is Hallelujah time in the gold cult church! Breakout those hymn books and get those priests and prophets back up there in the pulpit once more to encourage the faithful to remain true and steadfast! Putting all that foolishness behind us, we can once again see how much fear and panic buying can be created when a powerful short squeeze once again kicks off in a market. Just look at huge spike in volume. It has even dwarfed the massive volume that we saw in this same market exactly a week ago last Friday when that jobs report came in a bit lower than what the market was expecting and the Dollar encountered a sharp selloff. Once more we are getting a sharp move in the Forex markets, this time being the Euro, which is getting its own version of a short squeeze as many traders are caught short the Euro and are getting out on the heels of a bit better than anticipated Eurozone GDP number. So far the gold market is not backing down back under the $1180 level, which is the key for the bulls to have a legitimate shot at running this back up to try to put a "12" handle in front of the metal once more. If they can close this market over that level, they have a very good shot at doing that next week although the 20 day moving average, which comes in near $1194 would be the first upside target to be bested before a test of $1200 would be in order. Stay tuned on this one. I am going to be most interested in seeing what kind of numbers we are going to get out of that GLD once more after this squeeze. Will the ETF attract some new buying or will those looking for other pastures for their monies take advantage of the rally to liquidate. We will see soon enough. I can tell you that some of the other markets I am trading today are seeing some very strange and bizarre swings occurring in them, notably the meal spreads. The Yen is volatile as well having hit a fresh seven year low early in the session but apparently the rally in the Euro against the Dollar is sparking some short covering in the Yen as well. I will get some more up later on today after the dust settles. Suffice it to say for now, the gold bulls are seizing the day but they need to flex their muscles a bit more in the mining shares. The HUI is confirming the move higher thus far but has yet to really strongly exceed the peak made on last Friday's big up day. Let's see what we get on the close - never a dull or boring moment in our modern markets is there? Hey who knows, maybe some are now reading the lower energy prices, as stimulative in nature, much more so than any monetary stimulus measures that the Western Central Banks might be undertaking and are looking at that as a reason to put some money into commodities once more. Up until now they have all been part of a deflationary wave building in the commodity sector but sentiment is fickle, like the mob in the movie "Gladiator" and can change in a heartbeat. | ||||||||||||||
| Metals market update for November 14 Posted: 14 Nov 2014 09:38 AM PST Gold climbed $1.70 or 0.15% to $1,161.80/oz yesterday. Silver fell $0.06 or 0.38% to $15.61/oz. | ||||||||||||||
| No more inflation worries: gold, platinum fall Posted: 14 Nov 2014 09:26 AM PST Gold and silver futures fell, while platinum reached a five-year low, as slumping oil prices cut demand for an inflation hedge and the dollar strengthened. | ||||||||||||||
| Gold smuggler faces $6 million tax Posted: 14 Nov 2014 09:12 AM PST A gold smuggler serving nine years imprisonment has been ordered by court judge to repay nearly 6 million dollars (4.3 million pounds) in tax to avoid additional jail sentence of 10 years. | ||||||||||||||
| Silver’s Long Lost Monetary Role – Let’s Make Some Real Money! Posted: 14 Nov 2014 09:00 AM PST Imagine, a currency of coins with functionality just like the coins and bills in your wallet today, but accepted globally, and not subject to fiat inflation, on the contrary: even inherently deflationary. A truly "hard" global currency. "It isn’t hard to do". Silver…the forgotten real money of yesteryear. Submitted by XC Skater All over the euro […] The post Silver’s Long Lost Monetary Role – Let’s Make Some Real Money! appeared first on Silver Doctors. | ||||||||||||||
| Posted: 14 Nov 2014 08:43 AM PST As gold refuses to buckle under the stress of a sharply falling yen, signs are increasingly pointing to stress within the physical delivery system...stress that might ultimately break the physical---paper link. | ||||||||||||||
| Posted: 14 Nov 2014 08:40 AM PST The first trumpet blast of the “Clarion Call” to the truth in the PM markets has sounded… Submitted by The Wealth Watchman: A New Weapon in the Watchman's Arsenal This is the Watchman, proudly announcing the release of the first trumpet blast of the "Clarion Call" to the Truth HQ! The Clarion Call will be […] The post The Clarion Call appeared first on Silver Doctors. | ||||||||||||||
| BO POLNY: With Gold’s $1180 Triple Bottom Broken, Is the Gold Bull Market Over? Posted: 14 Nov 2014 08:30 AM PST Gold's triple bottom support at $1180, that was not expected to break, broke on October 31, 2014 and Gold has since been trading UNDER the $1180 support level. Now what? Has the 14-Year Gold Bull Market come to an end? The Perfect Holiday Gift for 2014: Royal Canadian Mint Holiday Snowman Submitted by […] The post BO POLNY: With Gold's $1180 Triple Bottom Broken, Is the Gold Bull Market Over? appeared first on Silver Doctors. | ||||||||||||||
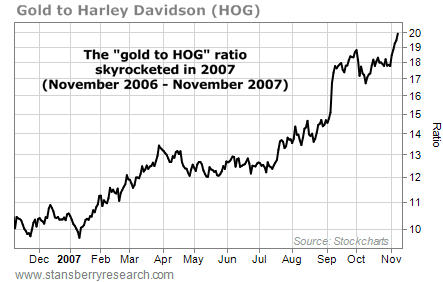
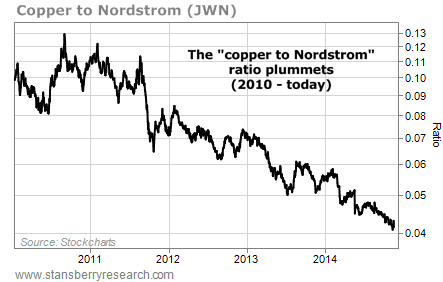
| Three charts on the economy you might not believe Posted: 14 Nov 2014 08:09 AM PST From Amber Lee Mason, editor, DailyWealth Trader: Which would you rather own? A pile of gold… or a business that sells boats? If you’re a newsletter reader… and I know that you are… chances are you answered “gold.” Boats are expensive consumer items. They cost a lot of money to buy… They cost a lot of money to maintain… And they depreciate in value. You can only sell boats to folks who don’t mind wasting money. Gold, on the other hand, has served as “real wealth” for millennia. It’s portable, durable, divisible, and it has intrinsic value. It’s a way to store wealth, rather than destroy it. In the investment-research business, there’s a popular belief that the consumer is “tapped out” and can’t afford things like boats, pools, motorcycles, and other big-ticket items. There’s a popular belief that you should buy gold and avoid businesses tied to consumer spending, because another economic collapse is around the corner. Here’s the thing: The market disagrees. It’s voting for boats and bikes over gold. And no matter how foolish you think the trend is, it’s vital you recognize it. If you don’t, you’re likely to lose a lot of money… Let me back up a bit and show you what I mean… Years ago, in late 2007 and early 2008, my colleague Brian Hunt ran a series of charts in his “Market Notes” column. He was tracking the prices of “real assets” – like iron ore, coal, oil, and gold – versus the share prices of companies that make “landfill stuffing” – like Harley Davidson (motorcycles), Nordstrom (expensive clothes), Winnebago (mobile homes), and Brunswick (boats). Take a look at this chart below. From late 2006 to late 2007, the “gold to HOG” ratio doubled. In other words, you were much better off holding an ounce of gold than a share of Harley Davidson stock.
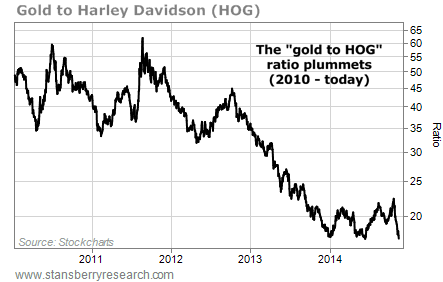
This chart illustrated one of the biggest trends in the world at the time: the rise in value of hard assets against the equity of businesses that live and die by the American consumer’s capacity to spend $100 on a shirt… $20,000 on a motorcycle… or $100,000 on a mobile home. The “real assets versus landfill stuffing” contest was tipping toward real assets because folks didn’t like the look of the American economy… and they didn’t feel good about the value of the American dollar. And if you placed your bets against the trend – and in the “landfill stuffing” corner – you got badly hurt. After Brian first introduced the “gold to HOG” ratio, it soared from under 20 to over 100. Gold’s value increased more than five-fold relative to shares of Harley Davidson. But today, that trend has reversed… dramatically. And it has surprised a lot of people. Back in 2010 and 2011, most folks you talked to would have told you that a sagging economy and the government’s “EZ-Credit” policies would crush the American consumer… and inflate the price of commodities. Many folks are still expecting that to happen. What we’re seeing is the opposite. Here’s the “gold to HOG” ratio since 2010. An ounce of gold has fallen 63% versus the share price of Harley Davidson.
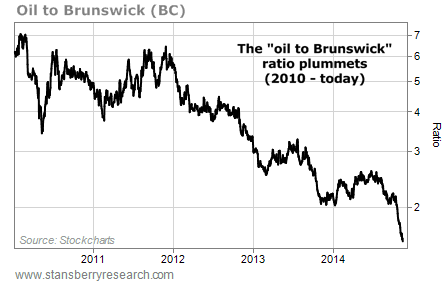
Here’s the “oil to Brunswick” ratio. The price of a barrel of oil has dropped 75% versus a share of the boatmaker.
Here’s the “copper to Nordstrom” ratio. The price of a ton of copper has fallen 58% versus a share of the department store.
In short, “real assets” are getting clobbered by “spending stocks.” I recently spoke with Brian about the reversal. Here’s what he told me: In early 2011, I warned Stansberry Research readers that the uptrend in commodities had broken down… and that commodity trades were dangerous. It was sound advice. The benchmark commodity index fell 28% from its 2011 high. Mining stocks have been obliterated. During that time, businesses that are sensitive to the health of the American consumer, like Home Depot, have done well. The Market Vectors Retail Fund, which is a great gauge of retail stocks, has nearly doubled since early 2011. What should we do now? If you hold winning positions in consumer spending stocks, stay long with trailing stop losses. The American consumer is doing a heck of a lot better than the pessimists would have you believe. The uptrend is likely to run further… but trailing stops will get you out with a profit in case it does not. That’s exactly why we’ve recommended long positions on the American consumer – like in “Big Cheap Tech.” These companies will grow alongside the consumer’s ability to buy more phones and businesses’ ability to buy more software. Of course, the trend toward “landfill stuffing” and away from “real assets” won’t last forever. That’s why we’ve recommended making trades in commodities like uranium and grains. But remember, the market is the judge, jury, and executioner of any trading idea. Today, the verdict is against “real assets”… and for “landfill stuffing.” The consumer is doing better than the pessimists would have you believe. | ||||||||||||||
| The Economy Of The Largest Superpower On The Planet Is Collapsing Right Now Posted: 14 Nov 2014 08:00 AM PST How do you fix a superpower with exploding levels of debt, that has a rapidly aging population, that consumes far more wealth than it produces, and that has scores of zombie banks that could collapse at any moment? Big economic news is about to start coming out of Europe, and it won’t be good. In […] The post The Economy Of The Largest Superpower On The Planet Is Collapsing Right Now appeared first on Silver Doctors. | ||||||||||||||
| Posted: 14 Nov 2014 07:54 AM PST I am still trying to get some information as to the driving force behind the unexpectedly sharp rally that is taking place in the Euro from off its worst early session levels. The common currency rallied almost a full 100 pips off its low in the span of a couple of hours but especially within the last hour. As it moved up, gold shot up as well as silver and even copper. As soon as I can find out something I will throw it up here at the site, assuming I have some time to do so. It is a busy morning with extreme volatility being seen across a large number of individual commodity futures markets.  Take a look at the combo chart showing gold on the bottom and the Euro on the top. Note that the relationship is almost perfect! As mentioned before here, gold is going to take its cues from the currency markets.  | ||||||||||||||
| Posted: 14 Nov 2014 06:12 AM PST The Daily Gold | ||||||||||||||
| ‘Gold Wars’ – Swiss Gold Shenanigans Intensify Prior To November 30 Vote Posted: 14 Nov 2014 05:49 AM PST 'Gold Wars' – Swiss Gold Shenanigans Intensify Prior To November 30 Vote – By Ronan Manly 'Gold wars' are intensifying with just 16 days left to polling day in the Swiss Gold Initiative.
The Swiss National Bank (SNB) and establishment parties went "all in" during the week and intensified their campaign. They suggested that passing the Gold Initiative would be a 'fatal' for Switzerland and would be positive only for speculators. The 'yes' side countered by saying the SNB's assertions were alarmist and over the top. They say that it is not an invitation to speculators as there would be a five year transition to gold being 20% of Swiss reserves. They warned that there is a real risk of another debt crisis and a global currency crisis and that gold reserves would protect the Swiss franc and the Swiss economy. If the Swiss vote to revert to having 20% of currency reserves in gold, the Swiss National Bank will be forced to make huge purchases of gold bullion. Switzerland and its 'Gold Initiative' would contribute to driving the price of gold higher – likely in the short term and contributing to higher prices in the long term. Understanding the important recent past and what has led to the forthcoming Swiss Gold Initiative is important and why we look at it today. This context is all important and is essential reading for all who wish to understand the key issues in the debate, for all who invest in and own gold internationally and for all Swiss people. | ||||||||||||||
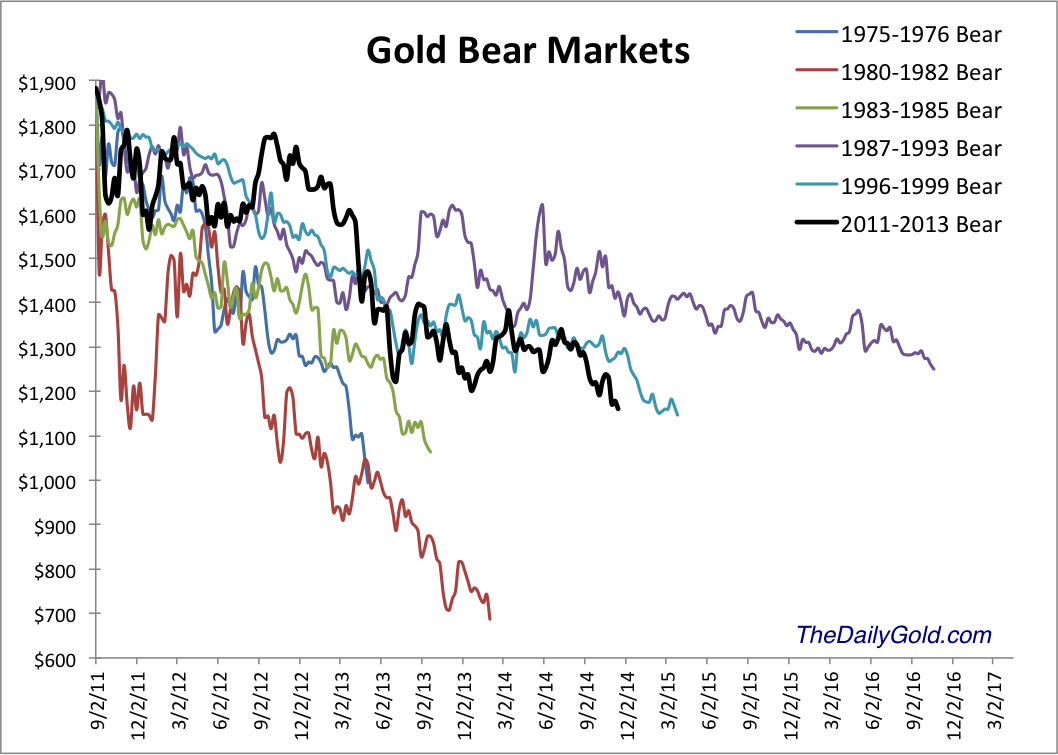
| Posted: 13 Nov 2014 11:37 PM PST Gold and gold miners have rebounded but remain in a technically weak position. Both markets have failed to move beyond the highs made last Friday. The same happened to the gold stocks in early October. They exploded higher one day but failed to muster anything after that. At that time Gold continued its rally for a few weeks. This time Gold has struggled to sustain Friday's gains. While we are coming to the end of the bear market and one should not be too bearish, the downside target of $1000/oz Gold remains well in play. The chart below shows the weekly Gold close since 1980 and the net non-commercial (speculative) position as a percentage of open interest. From this chart we can deduce the two most important levels: $720/oz and $1000/oz. Give or take $5/oz, $720/oz was the secondary peak in 1980, the peak in 2006, small resistance in 2007 and major support in 2008. Gold's bottom in 2008 wasn't random. It bottomed at an important pivot point around $700/oz. Today, Gold is in a downtrend without any major support until the $1000/oz level. That level marked important support and resistance from 2008 to 2010 and is the next major support.
As a percentage of open interest, the net speculative position is 13%. It's low of 5% in 2013 marked an 11-year low. If Gold declines near $1000/oz, I'd bet the net speculative position would fall below 5% and reach a 13-year low. That qualifies as extreme bearish sentiment. The physically backed ETFs CEF and GTU are already showing sentiment at major multi-year extremes.
The $1000/oz target expressed above also fits very well with history as we've shown numerous times in this bear analog chart.
While the downside for Gold and Silver may be limited (in percentage terms), the downside for miners could be quite a bit more. With Gold trading at $1160/oz, it would have to fall about 13% to reach $1000/oz. That is not so bad if you hold Gold. However, a 13% fall in Gold could cause a 20% fall in the miners or more. If a gold producer has a $200 profit margin at $1200/oz then he does not have much profit at $1050 Gold. If a junior has a deposit that can earn good money at $1300/oz then that isn't worth much if Gold drops to $1050. Thus, a fair amount of downside potential remains in play. On the other hand, it works in your favor if you buy very low and Gold recovers. In any event the bear market is very close to its end. The weeks and months ahead figure to be enticing and exciting for precious metals traders and investors. Expect quite a bit of day to day volatility as we see forced liquidation and occasional short covering. Opportunities are fast approaching so pay attention. Be patient but be disciplined. As winter beckons we could be looking at a lifetime buying opportunity. I am working hard to prepare subscribers. Consider learning more about our premium service including a report on our top 5 stocks to buy at the coming bottom. Good Luck! Jordan Roy-Byrne, CMT Jordan@TheDailyGold.com The post Gold's Support at $1000/oz. appeared first on The Daily Gold. | ||||||||||||||
| Gold market and prices 1800-2008 Posted: 13 Nov 2014 10:30 PM PST Finfacts | ||||||||||||||
| Posted: 13 Nov 2014 10:24 PM PST "We're so far down this rabbit hole that I'm no longer sure what to expect" ¤ Yesterday In Gold & SilverThere wasn't any price activity in gold worthy of the name on Thursday, with the low price tick coming at the London open---and the high at precisely 12 o'clock noon in New York. Nothing much to see here. The gold price traded within a twelve dollar range yesterday, so I shan't waste the energy to look up the low and high prices. Gold closed in New York on Thursday at $1,161.90 spot, up 20 whole cents. Gross volume was pretty decent, but once the roll-overs out of the December contract were subtracted, it netted out to 141,000 contracts, with more than 50 percent of the total amount traded before the morning gold fix in London, which is a highly unusual state of affairs. After the usual 6 p.m. EST sell-off on Wednesday evening, the silver price flopped and chopped around unchanged for the entire Thursday session. Like gold, the low tick was at the London open---and the high came ten minutes after COMEX trading began in New York. After that, the price wasn't allowed to do much. With the silver price trading well within a two bit range, the low and high ticks aren't worth looking up, either. Silver was closed up a half a cent at the end of electronic trading on Thursday afternoon in New York. Net volume was only 24,000 contracts, but the roll-over activity out of the December delivery month was pretty decent---and will get heavier as the month progresses. Both platinum and palladium reached their highs during the Zurich lunch hour yesterday---and were under choppy selling pressure after that. Both were closed down on the day; platinum by 7 dollars and palladium by 6 dollars. Here are the charts. The dollar index closed late on Wednesday afternoon in New York at 87.85. It sagged a bit starting around 3 p.m. Hong Kong time, with the 87.65 'low' coming around 9 a.m. GMT in London. It didn't do much after that, closing the Thursday session at 87.77---down 8 basis points. Nothing much to see here, either. The gold stocks opened in positive territory---and then sagged into negative territory going into the London p.m. gold fix. From there the rallied back into positive territory, hitting their zenith at exactly 12 noon EST when the gold price topped out. From that point the gold prices sagged back into negative territory---and closed there, as the HUI finished down 1.87%. The silver equities follow an almost identical price pattern, except Nick Laird's Intraday Silver Sentiment Index closed down 2.01%. The CME Daily Delivery Report showed that a whopping 920 gold and zero silver contracts were posted for delivery within the COMEX-approved depositories on Monday. Remember that I said that, barring a surprise out of left field, November was normally a very quiet delivery month for both precious metals. Well, that surprise out of left field just put in an appearance, as there was no hint of this in Wednesday's Preliminary Report, which is normally when you would see it first. The only short/issuer was JPMorgan out of its client account---and the biggest long/stopper was Canada's Scotiabank with 833 of those contracts---and ABN Amro was a very distant second with 79 contracts. The link to yesterday's Issuers and Stoppers Report is here. The CME Preliminary Report for the Thursday trading session showed the surprise delivery, as the contracts open in the November delivery month blew out by 909 contracts to 942 contracts outstanding. Silver's November o.i. fell by 21 contracts down to 89 contracts. Minus the 920 contracts posted for delivery tomorrow, the November open interest now nets out to 22 contracts remaining. Will we get another surprise 'out of left field' in what remains of the November delivery month? Absolute nothing will surprise me going forward. Another day---and another withdrawal from GLD. This time it was 65,954 troy ounces. There was also a report from SLV and, not surprisingly, an authorized participant added a whopping 2,012,354 troy ounces, which is one full day of world silver production. One has to wonder how many Air Miles those 2,000 good delivery bars racked up in the process of getting to London. Since yesterday was Thursday, Joshua Gibbons, the "Guru of the SLV Bar List," updated his website with the in/out data from the iShares.com website---and this is what he had to report: "Analysis of the 12 November 2014 bar list---and comparison to the previous week's list -- 1,911,745.4 troy ounces were removed, 1,432,087.6 troy ounces were added (all to/from Brinks London). Five bars had a serial number change." "The bars added were from Solar Applied Materials (1.3M oz), and 4 others (all less than 52,000 oz). All appear to be freshly minted bars (new to SLV)." "The bars removed were from Russian State Refineries (1.5M oz), Prioksky (0.2M oz), and 6 others. All were bars that had been in SLV many years." "As of the time that the bar list was produced, it was overallocated 98.6 oz. All daily changes are reflected on the bar list." The link to Joshua's website is here. And, for the third day in a row, there were no reported sales from the U.S. Mint. However, the mint did mention the fact that they will be selling 2014 silver eagles on an allocated basis starting on Monday---and I have a story about that in it the Critical Reads section, but if you can't wait, it's linked here. There was decent activity in both gold and silver at the Comex-approved depositories on Wednesday. In gold, 10,049.181 troy ounces were shipped out of HSBC USA---and precisely the same amount, to the nearest 1/1,000 of an ounce, was deposited, in Scotiabank's account. The link to that activity is here. In silver, nothing was reported received, but 1,386,077 troy ounces were shipped out the door. And with the exception of JPMorgan, all the depositories had metal withdrawn. The link to that action is here. Here are the 6-year charts for both GLD and SLV. The dichotomy between the two could not be more stark---and except for Ted Butler and myself, virtually nobody is talking about this, not even the 'lunatic fringe'. You would think that any of these self-anointed silver experts would have stolen Ted's work by now [without attribution, of course] and attempted to lead the parade on this, but not a word so far. Since today is Friday, the Shanghai Gold Exchange updated their website with their gold withdrawals for the week ending Friday, November 6. They reported that 54.190 tonnes were taken out, which ain't too shabby---and here's Nick Laird's most excellent chart showing the change. The next chart from Nick shows the Shanghai Gold Exchange's "Monthly Physical Gold Withdrawals"---and it will be interesting to see if they really put the 'pedal to the metal' [pun intended] for the remainder of the 2014 calendar year like they did in 2013. I don't have a lot of stories for you today---and I'll happily leave the final edit up to you. ¤ Critical ReadsGlobal Stocks Rise, U.S. Futures at Fresh Record on Latest Reduction of Growth ForecastsThe relentless regurgitation of the only two rumors that have moved markets this week, namely the Japanese sales tax delay and the "surprise" cabinet snap elections, was once again all over the newswires last night in yet another iteration, and as a result the headline scanning algos took the Nikkei another 1.1% higher to nearly 17,400 which means at this rate the Nikkei will surpass the Dow Jones by the end of the week helped by further reports that Japan will reveal more stimulus measures on November 19, although with U.S. equity futures rising another 7 points overnight and now just shy of 2,050 which happens to be Goldman's revised year-end target, the U.S. will hardly complain. And speaking of stimulus, the reason European equities are drifting higher following the latest ECB professional forecast release which saw the panel slash their GDP and inflation forecasts for the entire period from 2014 to 2016. In other words bad news most certainly continues to be good news for stocks, which in the US are about to hit another record high, with the bulk of the upside action once again concentrated between 11:00 and 11:30am. This longish commentary was posted on the Zero Hedge website at 6:48 a.m. EST Thursday morning---and today's first story is courtesy of reader M.A. David Stockman: Take Cover Now—-They Don't Ring a Bell at the TopThis is getting downright stupid. After the minor 8% correction in October, the dip buyers came roaring back and the shorts got sent to the showers still another time. Earlier this morning the S&P 500 was pushing 2050——or up 12% in less than a month. So the great con game remains in tact. The casinos run by the Fed and other central banks can’t go down for more than a few of days—until one or another central banker hints that more free money is on the way. A few weeks ago it was James Bullard hinting at a QE extension. Next was Mario Draghi pronouncing that the whole ECB is unified behind a plan to expand its already swollen balance sheet by another $1.2 trillion. And then Haruhiko Kuroda, the certifiable madman running the BOJ, not only announced his 80 trillion yen buying scheme, but soon averred that falling oil prices—–a godsend to Japan—–were actually a threat to his mindless 2% inflation goal that might necessitate even more money printing. That is, after buying up 100% of the massive Japanese government bond market, the BOJ would not hesitate to monetize ETF’s, stocks, securitized real estate debt and, apparently, sea shells, if necessary. Accordingly, bounteous wealth is seemingly to be had by the three second exercise of clicking “buy” on the SPU (basket of S&P 500 stocks). Indeed, for the past 68 months running, the stock market has blown through every mini-correction, and has been traversing a near parabolic rise. This commentary appeared on David's website yesterday sometime---and I thank Roy Stephens for his first offering in today's column. Marc Faber Double HeaderThe first interview is a 12:29 minute CNBC video clip from yesterday---and the second video interview runs for 16:58 minutes---and it was posted on the goldseek.com Internet site on Thursday as well. It's linked here. Both are courtesy of reader Ken Hurt. U.S. and Brussels target at least 12 banks over forexSix banks agreed a $4.3 billion settlement with U.K., U.S., and Swiss regulators on Wednesday for allegedly attempting to manipulate the foreign exchange market. But for them and at least half a dozen other banks and their legal and public relations, the exposure is far from over as U.S. and European investigators continue to pursue cases. The U.S. Department of Justice is investigating numerous banks, former traders, and salesmen for allegedly manipulating the $5.3 trillion forex market and overcharging customers, while evidence obtained by Europe's top competition authority, people close to the probe said, is of "startling quality." The investigations, which are expected to play out over the next year or longer, will probably result in large fines and criminal findings from the DoJ, these people say. The above three paragraphs are out of an article from the Financial Times of London on Thursday---and you need a subscription to read the rest. I found it embedded in a GATA release. Mike Maloney: Bank Bail In or Bail Out...What's The Difference?"Just the term 'bail in' is a lie. This is something that is a marketing tool to basically...cover up a theft." - Mike Maloney This tiny 1:19 minute video clip was posted on the hiddensecretsofmoney.com Internet site on Wednesday---and it's definitely worth a minute of your time. Carney Sees Europe Stagnation Impact as Growth Outlook LookMark Carney unveiled lower U.K. growth and inflation forecasts as officials adjusted to account for “moribund” global expansion and stagnation in Europe. “Developments in the world economy mean some of the downside risks to growth in earlier projections have crystallized,” the Bank of England governor told reporters in London today. “A specter is now haunting Europe –- the specter of economic stagnation.” Carney spoke while presenting the BOE’s Inflation Report, where officials said annual increases in consumer prices could slow below 1 percent within months, and will return to the 2 percent target in three years. That effectively validates investors’ expectations that rate increases may not start for another year. Policy makers also cut growth forecast for the next two years. This Bloomberg article, filed from London, showed up on their website at 5:11 a.m. Denver time on Wednesday morning---and it's something I 'borrowed' from yesterday's edition of the King Report. Moscow gives France until end of November to deliver warshipRussia on Friday warned France of "serious" consequences unless Paris delivers by the end of this month a Mistral-class assault warship whose handover has been delayed by concerns over Moscow's role in the Ukraine crisis, a report said. "We are preparing for different scenarios. We are waiting until the end of the month, then we will lodge serious claims," the state news agency RIA Novosti quoted an anonymous high-ranking Moscow source as saying. The first of two mammoth Mistral helicopter carriers was supposed to be delivered on Friday according to the original deal signed in 2011 and worth 1.2 billion euros ($1.5 billion) for both vessels. This AFP story, filed from Moscow, showed up on the france24.com Internet site at 10:15 a.m. Europe time this morning---and I thank South African reader B.V. for sliding it into my in-box shortly before I sent today's column out the door. Spreading deflation across East Asia threatens fresh debt crisisDeflation is becoming lodged in all the economic strongholds of East Asia. It is happening faster and going deeper than almost anybody expected just months ago, and is likely to find its way to Europe through currency warfare in short order. Factory gate prices are falling in China, Korea, Thailand, the Philippines, Taiwan and Singapore. Some 82pc of the items in the producer price basket are deflating in China. The figures is 90pc in Thailand, and 97pc in Singapore. These include machinery, telecommunications, and electrical equipment, as well as commodities. Chetan Ahya from Morgan Stanley says deflationary forces are “getting entrenched” across much of Asia. This risks a “rapid worsening of the debt dynamic” for a string of countries that allowed their debt ratios to reach record highs during the era of Fed largesse. Debt levels for the region as a whole (ex-Japan) have jumped from 147pc to 207pc of GDP in six years. These countries face a Sisyphean Task. They are trying to deleverage, but the slowdown in nominal GDP caused by falling inflation is always one step ahead of them. “Debt to GDP has risen despite these efforts,” he said. If this sounds familiar, it should be. It is exactly what is happening in Italy, France, the Netherlands, and much of the eurozone. This must read commentary by Ambrose Evans-Pritchard appeared on the telegraph.co.uk Internet site at 8:02 p.m. GMT on Wednesday evening---and it's the second contribution of the day from Roy Stephens. | ||||||||||||||
| How plausible is the end of the petrodollar as proposed in ‘The Colder War’ by author Marin Katusa? Posted: 13 Nov 2014 07:06 PM PST This autumn’s must-read book for professional gloom and doom merchants is ‘The Colder War’ by Marin Katusa, an analyst at Casey Research. It’s central thesis is that Vladimir Putin is using Russia’s position in the energy sector to undermine the US dollar as a reserve currency, and that this will bring about the fall of US political and economic hegemony just as the pound sterling’s decline came with the end of the British Empire. As it emerges Dr. Putin wrote his PhD thesis on ‘Mineral and Raw Material Resources and the Development Strategy for the Russian Economy’. How many doctorate students not only get their economic theory published but get to implement it? He wants to restore the glory of Russia and the Soviet Union. Dr. Putin You need to read Mr. Katusa’s account yourself to get the full picture. But basically Dr. Putin realizes that developing and controlling energy, metals and other natural resources are the key to Russia’s economic success. Indeed, the past 14 years that he has been in the driving seat have seen many advances, not least a five or six-fold increase in Russian per capita GDP. The two massive pipeline projects with China are just the latest example of this plan in action. More controversial is the claim that a part of this strategy is to undermine the reserve currency status of the US and bring about the end of the petrodollar that allows Americans to borrow and live way beyond their means. Once this economic advantage is removed the US will have no alternative but to shrink its military and the standard of living of its citizens will stagnate or decline. You can see that many who envy the Americans their wealth and power would like to see the end of the dollar as a reserve currency, and yet today the dollar is getting stronger and not weaker. It’s Dr. Putin’s ruble that is in dire straits thanks to his adventures in the Ukraine this year. Not that the yen, euro, Canadian and Australian dollars or the dear old pound sterling are in that much better shape. The almighty dollar stands proud. Still Mr. Katusa has a point in that direct non-dollar trade between countries in natural resouces is coming. You can see how the Chinese renminbi is becoming far more easily convertible. The recent Chinese-Russian pipeline deal spoke boldly about using the ruble-renminbi in this $400 billion project, the largest engineering project since the Great Wall perhaps. Saudi Arabia Could Saudi Arabia be persuaded to drop the petrodollar, a part of its 1970s defense pact with the US? Well China is the kingdom’s biggest customer for oil these days. But it is hardly likely. Is it not more plausible to see the dollar gradually losing its dominance over a much longer period, say the 30 years that it took the British Empire to blow its inheritance? I don’t know. Mr. Katusa has a good argument for more rapid change in an interlinked global economy with trade done in seconds not months let alone years, and he is certainly right that there’s a lot of anti-American will power to make it happen. Still analysts talked of an end of the US dollar in the 1970s when it really did look a complete shambles amid high inflation and soaring deficits, and where are we today? In currency wars there is always a winner. The 600lb gorilla in the front room. | ||||||||||||||
| GLD Drawdown Continues, Confirming the WGC Findings Posted: 13 Nov 2014 05:08 PM PST If you have not taken some time out to read through the World Gold Council's recent report on the gold market ( see my earlier post from today for the link) I would strongly urge you do so. It is an excellent and illuminating read. I already made some comments in regards to the section on ETF's. In tracking the largest of these gold ETF's, namely, GLD, this afternoon is just more confirmation of the accuracy of that report. They have come to exactly the same conclusion as we have over here - namely that money is being pulled out of GLD in order to take advantage of obtaining better yields elsewhere, specifically in equities. Notice that ever since that big upside day in gold last week (Nov 7), when we got a massive short covering burst of buying on the heels of the jobs report, the reported tonnage in gold has continued to drop. Simply put, investors are taking advantage of the moves higher in the price to exit and put the money to work elsewhere. Here is the latest chart of GLD and it is a doozy. Since the day just before the big price surge last Friday, GLD has disgorged another 12+ tons of the metal. It's holdings are now down to 720.62 tons, the lowest level since September 2008. Interestingly enough, it is back to levels last seen PRIOR to the onset of any of the QE programs by the Federal Reserve.  Also, as of today, the ETF has shed an astounding 77.6 tons of gold this year alone. No matter how one slices it or dices it, that is one heckuva lot of gold. As I have stated so often over here the last couple of years, the market sees no inflation worries whatsoever at this point so any buying of the metal as an inflation hedge is non-existent. Just look at the carnage in crude oil today and the liquid energies! Crude oil prices are falling out of bed as the world is swimming in the black goo. The impact from this key market is being keenly seen on the various commodity indices. Here is the latest for the Goldman Sachs Commodity Index. It hit a 51 month low today! The last time it was at this level was all the way back in September 2010!  Just look at this chart of unleaded gasoline. I recall posting a chart of unleaded just very recently and remarking that it might actually put a "1" handle in front of the price at the rate it has been plummeting, but I never expected to see it get there this quickly! Talk about a bonanza for the transportation industry and for the consumer!  This is coming at the perfect time for retailors as it puts more money in the pocket of the US consumer at precisely the exact time for Christmas shopping season. No wonder retail stocks are doing what they are doing! I think this has a lot to do as well with the fact that the cattle market simply refuses to break down. As the frequent readers know, I am on record as saying that I believe both pork and beef prices would come down in Q4 and certainly by Q1 2015. Pork prices had come down somewhat ( they are now beginning to movce back up at the wholesale level) as had beef, but only slightly. My view was that the economy was too weak for consumers, who had been cash strapped to afford record high beef prices, especially in light of cheap pork and chicken. However, the beef market has been the beneficiary of these incredibly cheap gasoline prices which is freeing up money for consumers to spend elsewhere. As a result, packers have been able to force the wholesale price higher and so far, distributors and grocers have been willing to pay it. Apparently they are able to move it, high price notwithstanding. It is almost as if demand for beef is proving to rather inelastic due to the cheap gasoline prices.  Just look at this market. Talk about one helluva strong bull! I keep watching this for some evidence of a top but the funds are in the driver's seat and are pushing it for all their worth. Until the beef shows signs of end user resistance, feedlots are in control and are squeezing packers and forcing them to pay up, even though they are losing in the vicinity of $100 head for every single animal they put down. Good thing they have such excellent margins in the hogs. A brief comment on the gold - again, nothing doing as it remains range bound. Safe haven buying related to the ongoing mess in Ukraine is propping it up with strength in the Dollar keeping pressure on the market. I expect this standoff to continue for a while until we get some piece of fundamental data to drive it either way. The mining shares are proving to be of no help whatsoever to the metal as they displayed exactly ZERO upside follow through to last week's one day wonder. Copper is trading below $3.00 and in my mind, that is a very big deal, especially if it stays below that level. The Japanese Yen has entered Asian trade at this moment notching a fresh SEVEN YEAR LOW against the US Dollar.  Lastly, one of the things I must do as a trader is try to juggle all the various cross currents that buffet the markets that we trade and try to understand their impact on price. One thing I can say is that in an environment such as this one, where the overall trend for commodities is lower, it makes me suspect rallies that might break out in certain sectors. I have to respect the chart pattern but I do wonder about their staying power. Thus far cattle have been the exception as has been the meal market, which continues to drag the grains higher, but one wonders how much longer those stalwarts are going to be able to buck the wider trend. | ||||||||||||||
| Posted: 13 Nov 2014 04:00 PM PST What we'll likely face dead ahead, calls for an emergency post. Submitted by The Wealth Watchman: I've had such a strong foreboding feeling the last several days, that I feel I cannot ignore it. The last series had ended in a good place, anyway. So I'm going to pen a warning instead. What follows is a […] The post A Warning from the Watchman appeared first on Silver Doctors. | ||||||||||||||
| Harvey Organ: Evidence of Paper Settling on the COMEX? Posted: 13 Nov 2014 03:49 PM PST A few months ago the comex had 303 tonnes of total gold. Today the total inventory rests at 255.02 tonnes for a loss of 48 tonnes over that period. . Furthermore, there is now evidence of paper settling on the COMEX! Let's head immediately to see the major data points for today: 20% Off Your First […] The post Harvey Organ: Evidence of Paper Settling on the COMEX? appeared first on Silver Doctors. | ||||||||||||||
| Marshall Swing: PMs Will Not Be Allowed to Crash Until September 2015 Posted: 13 Nov 2014 01:25 PM PST All speculators should cover all the shorts they have right now to secure MASSIVE profits! But they won't. Why? The speculators really believe they can force the Commercials hand and pin their positions on them but that is not mathematically possible. They sense and even smell the blood of far lower spot prices in the future and they […] The post Marshall Swing: PMs Will Not Be Allowed to Crash Until September 2015 appeared first on Silver Doctors. | ||||||||||||||
| Posted: 13 Nov 2014 01:22 PM PST We have recently been asked to comment on the upcoming referendum in Switzerland on gold. | ||||||||||||||
| “Paper gold”: What every investor should know Posted: 13 Nov 2014 10:39 AM PST By Bud Conrad, Chief Economist, Casey Research:Gold dropped to new lows of $1,130 per ounce last week. This is surprising because it doesn't square with the fundamentals. China and India continue to exert strong demand on gold, and interest in bullion coins remains high. I explained in my October article in The Casey Report that the Comex futures market structure allows a few big banks to supply gold to keep its price contained. I call the gold futures market the "paper gold" market because very little gold actually changes hands. $360 billion of paper gold is traded per month, but only $279 million of physical gold is delivered. That's a 1,000-to-1 ratio:
We know that huge orders for paper gold can move the price by $20 in a second. These orders often exceed the CME stated limit of 6,000 contracts. Here's a close view from October 31, when the sale of 2,365 contracts caused the gold price to plummet and forced the exchange to close for 20 seconds:
Many argue that the net long-term effect of such orders is neutral, because every position taken must be removed before expiration. But that's actually not true. The big players can hold hundreds of contracts into expiration and deliver the gold instead of unwinding the trade. Net, big banks can drive down the price by delivering relatively small amounts of gold. A few large banks dominate the delivery process. I grouped the seven biggest players below to show that all the other sources are very small. Those seven banks have the opportunity to manage the gold price:
After gold's big drop in October, I analyzed the October delivery numbers. The concentration was even more severe than I expected:
This chart shows that an amazing 98.5% of the gold delivered to the Comex in October came from just three banks: Barclays; Bank of Nova Scotia; and HSBC. They delivered this gold from their in-house trading accounts. The concentration was even worse on the other side of the trade—the side taking delivery. Barclays took 98% of all deliveries for customers. It could be all one customer, but it's more likely that several customers used Barclays to clear their trades. Either way, notice that Barclays delivered 455 of those contracts from its house account to its own customers. The opportunity for distorting the price of gold in an environment with so few players is obvious. Barclays knows 98% of the buyers and is supplying 35% of the gold. That's highly concentrated, to say the least. And the amounts of gold we're talking about are small—a bank could tip the supply by 10% by adding just 100 contracts. That amounts to only 10,000 ounces, which is worth a little over $11 million—a rounding error to any of these banks. These numbers are trivial. Note that the big banks were delivering gold from their house accounts, meaning they were selling their own gold outright. In other words, they were not acting neutrally. These banks accounted for all but 19 of the contracts sold. That's a position of complete dominance. Actually, it's beyond dominance. These banks are the market. My point is that this market is much too easily rigged , and that the warnings about manipulation are valid. At some point, too many customers will demand physical delivery and there will be a big crash. Long contracts will be liquidated with cash payouts because there won't be enough gold to deliver. I saw a few squeezes in my 20 years trading futures, including gold. In my opinion, the futures market is not safe. The tougher question is: for how long will big banks' dominance continue to pressure gold down? Unfortunately, I don't know the answer. Vigilant regulators would help, but "futures market regulators" is almost an oxymoron. The actions of the CFTC and the Comex, not to mention how MF Global was handled, suggest that there has been little pressure on regulators to fix this obvious problem. This quote from a recent Financial Times article does give some reason for optimism, however: UBS is expected to strike a settlement over alleged trader misbehaviour at its precious metals desks with at least one authority as part of a group deal over forex with multiple regulators this week, two people close to the situation said. … The head of UBS's gold desk in Zurich, André Flotron, has been on leave since January for reasons unspecified by the lender…. The FCA fined Barclays £26m in May after an options trader was found to have manipulated the London gold fix. Germany's financial regulator BaFin has launched a formal investigation into the gold market and is probing Deutsche Bank, one of the former members of a tarnished gold fix panel that will soon be replaced by an electronic fixing. The latter two banks are involved with the Comex. Eventually, the physical gold market could overwhelm the smaller but more closely watched US futures delivery market. Traders are already moving to other markets like Shanghai, which could accelerate that process. You might recall that I wrote about JP Morgan (JPM) exiting the commodities business, which I thought might help bring some normalcy back to the gold futures markets. Unfortunately, other banks moved right in to pick up JPM's slack. Banks can't suppress gold forever. They need physical gold bullion to continue the scheme, and there's just not as much gold around as there used to be. Some big sources, like the Fed's stash and the London Bullion Market, are not available. The GLD inventory is declining.
If a big player like a central bank started to use the Comex to expand its gold holdings, it could overwhelm the Comex's relatively small inventories. Warehouse stocks registered for delivery on the Comex exchange have declined to only 870,000 ounces (8,700 contracts). Almost that much can be demanded in one month: 6,281 contracts were delivered in August. The big banks aren't stupid. They will see these problems coming and can probably induce some holders to add to the supplies, so I'm not predicting a crisis from too many speculators taking delivery. But a short squeeze could definitely lead to huge price spikes. It could even lead to a collapse in the confidence in the futures system, which would drive gold much higher. Signs of high physical demand from China, India, and small investors buying coins from the mint indicate that gold prices should be rising. The GOFO rate (London Gold Forward Offered rate) went negative, indicating tightness in the gold market. Concerns about China's central bank wanting to de-dollarize its holdings should be adding to the interest in gold. In other words, it doesn't add up. I fully expect currency debasement to drive gold higher, and I continue to own gold. I'm very confident that the fundamentals will drive gold much higher in the long term. But for now, I don't know when big banks will lose their ability to manage the futures market. Oddities in the gold market have been alleged by many for quite some time, but few know where to start looking, and even fewer have the patience to dig out the meaningful bits from the mountain of market data available. Casey Research Chief Economist Bud Conrad is one of those few—and he turns his keen eye to every sector in order to find the smart way to play it. This is the kind of analysis that's especially important in this period of uncertainty and volatility… and you can put Bud's expertise—along with the other skilled analysts' talents—to work for you by taking a risk-free test-drive of The Casey Report right now. | ||||||||||||||


| You are subscribed to email updates from Gold World News Flash 2 To stop receiving these emails, you may unsubscribe now. | Email delivery powered by Google |
| Google Inc., 1600 Amphitheatre Parkway, Mountain View, CA 94043, United States | |
No comments:
Post a Comment