


saveyourassetsfirst3 |
- Deflation Fears Gaining Ground in Europe
- PM Fund Manager Explains How Bullion Banks Can Continue PM Manipulation
- 18 Sobering Facts About The Unprecedented Student Loan Debt Crisis In The United States
- Marc Faber: Investors Recognizing Global Growth Slowdown
- Casey Research: The Broken State and How to Fix It
- William K. Black: Too Big to Jail?
- U.S. and U.K. to test big bank collapse in joint model run
- Luxembourg court declares Portugal's Espirito Santo Holdings bankrupt
- ECB Weighing First Step to Buying Yuan for Foreign Reserves
- "De-Dollarizing" Russia Pays Down Near-Record $53 Billion in Debt in Third Quarter
- The U.S. is in the Midst of a Full-Scale Strategic Meltdown in Syria
- Why the gold bear market may finally be over
- Lawrence Williams: Silver in supply deficit but price unmoved so far
- Swiss National Bank Explains Why it is Against Repatriating Gold
- Nomura Currency Analysts Think Swiss Gold Vote Unlikely To Pass
- Chinese gold buying picks up after holiday; Indian premiums rise
- Goldcorp CEO visits Australia and predicts 'peak gold' next year
- Lawrence Williams: Silver in Supply Deficit, But Price Unmoved So Far
- An End Is Still Not In Sight Gold And Silver’s Price Decline
- Precious Metals Getting a Temporary Reprieve
- The case for Gold
- Countdown!
- PM Fund Manager Explains How Bullion Banks Can Continue PM Manipulation
- the Gold Standard
- Fear?
- Oil price slump to $85 pulls the S&P 500 down so what about Gulf equities?
- USDA Supply and Demand Reports
- Just the start of a correction for US stocks no sign of capitulation
- Marc Faber smiles as S&P 500 has worst week in two years and gold up 3%
- Marshall Swing: It is Time to BUY, BUY, BUY Physical Silver With Every Fiat Dollar You Have!
- Russell 2000 a Harbinger to come?
- Gold skyrockets as dollar stalls
- Precious Metals Getting a Temporary Reprieve
- One of the world's best indicators says this essential commodity is headed much higher
| Deflation Fears Gaining Ground in Europe Posted: 11 Oct 2014 11:48 AM PDT The following article in the London Telegraph is definitely worth a read. It confirms what I have been thinking for a while now that the primary fear facing the markets and thus the Central Banks as far as the Western economies go, is NOT inflation, but rather deflation. Try as they can, the ECB and the BOJ in particular, cannot seem to get the kind of growth they are hoping for, and more particularly, an inflation rate of 2% annually. Dam breaks in Europe as deflation fears wash over ECB rhetoric'We are reaching the end game in Europe. If they don't launch real QE soon, the consequences are too awful to contemplate,' warns RBShttp://www.telegraph.co.uk/finance/economics/11154553/Dam-breaks-in-Europe-as-deflation-fears-wash-over-ECB-rhetoric.html We have been following the Euro here in detail ever since ECB head Draghi first began attempts to talk the currency down when it reached the 1.400 level in May of this year. Quite frankly, with the problems that the Eurozone was having economically, the last thing desired in those quarters was a strong currency. This was accomplished primarily by first raising the specter of additional monetary easing by lowering rates. Secondly it was then further reinforced by successive steps taken by the ECB which were seen as stimulative in nature by investors. I will not go into detail here as those have been covered previously here on this site. Let me make one additional point here to refute the idea that the Euro fell primarily as a result of the sanctions imposed by the West on Russia. There is no doubt that those sanctions might have shaved some potential growth off of the Eurozone but frankly, the Eurozone has been in trouble long before those sanctions were announced or implemented. There seem to be some who are so intent on preaching the demise of the US Dollar that they are blinded to the severe economic problems affecting the other major Western industrialized nations. The Dollar certainly has its own set of woes to contend with, but let's face it, right now the US is certainly more attractive of foreign capital flows than is the Eurozone or Japan for that matter. Also, consider the fact that with global economic growth slowing and not rising, those nations whose currencies we have dubbed, "Commodity currencies", are having their own difficulties as well. The Canadian Dollar, for example has fallen from 1.06 to its current .89 over the last three years. That is a decline of some 15.5%. The Australian Dollar has declined nearly 22% in value against the US Dollar over that same three period with the currency being especially hit hard over the last month as it has plummeted some 8.5% alone! I view the Aussie as a "Growth Currency" meaning that I look at it to try to get a sense of how the world at large sees the potential for commodity usage and thus, as a byproduct, overall world growth. Australia's close proximity to China, and its large trade in raw materials that are used in industrialized nations, infers that it is particularly vulnerable to any slowdown in growth from that corner of Asia. Here is the currency chart:  That does not look like a currency chart showing a strong, vibrant, commodity-based economy now does it? It reflects what I and many others have been saying for a while now, that growth is slowing and deflationary headwinds are building. Those who keep with their incessant, inflation this and inflation that, are simply barking up the wrong tree. Could we experience a currency crisis here in the US at some point? Sure we could. One never knows when the sentiment shifts in a market and suddenly something that was of seemingly little to no concern erupts into a full blown panic. Take the European Sovereign Debt crisis as an example. It was no NEW news to the market that Greece or Spain or Portugal or even Italy had huge amounts of debt for the size of their overall GDP. The market knew that for a long time. Yet, something triggered a sudden shift in sentiment towards those nations' debt one day and on came the crisis. What I am trying to say here is that one must deal with the present realities in the market to be successful as a trader or even an investor. Those who are handling real money and placing real trades or making real investments do not have the LUXURY of postulating theory after theory, many or even most of which will not turn out to be true. Instead they must understand the thinking or sentiment of the market. If it worries the market; it worries the trader. If the market could care less; the trader could care less. That sounds blasé but it is axiomatic due to the nature of money flows. Standing in front of a tidal wave of money moving against you is a surefire method to be financially destroyed and left as "road pizza" ( one of my favorite analogies ) on the floor of the trading pits. Let me shift gears here slightly and note the chart of gold priced in terms of the Euro. Eurogold has been holding much better than US Dollar priced gold on the chart, which is of course due to the sharp fall in the Euro.  Some have asked me what the repercussions to the Euro might be were the ECB to actually engage in their own version of QE to try reversing the deflationary pressures that are relentless in the Eurozone. I honestly do not know. I can make a case for a move higher and make one for a move lower. The case for the lower Euro would be simple - the ECB creates more supply of the currency which tends to undercut the unit and thus knocks its lower. I am sure that is what they would hope the currency would do as they would thus bank on the weaker currency stimulating exports and serving to help generate some inflationary pressures. The reverse could happen however. What if the market views the QE as sufficiently large enough in size to actually make a big impact on the economy and thus decides that the Eurozone will actually begin to grow? Could they decide that the Euro is now low enough and will move higher as the economy improves? I don't know. The truth is I am not sure if anyone really knows. The reasons is because of something I have said many times here - we are in an era in which a monetary experiment of this size and of this nature has never been previously attempted. No one has thus ever lived through or been familiar with its eventual outcome. We are all trying to use our experience and wisdom gained over the years in deciphering the enigma presently before us. That is why I caution my readers against those who confidently ( hubristically in my opinion) proclaim with absolute certainty that "this market has bottomed" or "this market has topped" or "this event will now follow as sure as the sun rises in the East"., etc. Let me draw some on my Texan roots and say that is pure "Bullsh*t!". They no more know the outcome or path of events that is going to transpire that the proverbial man in the moon. My advice is to ignore the wild screamers and theorist over at websites that are constantly regaling us with one sensational, dogmatic prediction after another and try to maintain a sort of quiet calm while you study developments and price action as you try to get a sense of how the markets are going to respond. Lastly - Compare the Eurogold chart above to the weekly chart pattern of gold priced in US Dollar terms.  As you can see, that is quite a difference! This one looks abysmal compared to Eurogold. I am noting however that this week's wild swings in price have produced a Bullish Engulfing pattern on the weekly chart. That pattern has appeared at the previous double bottom level near $1180. My view on triple bottoms is well known by now - they rarely hold. But "rarely" is the key word. This one just might hold. Again, I honestly do not know. A technical chart pattern like this tends to be fairly reliable but all it could mean this time around is a halt in the ongoing downtrend, a sort of pause while the market consolidates before beginning a new leg lower. The reason for the uncertainty in my mind is that I did not see anything similar in the gold mining shares as evidenced by the HUI or GDXJ, both of which produced lousy weekly closes this week. With the GLD disgorging the metal and with the TIPS spread continuing to fall, and with the commodity indices all dropping lower, will gold be able to withstand the headwinds coming from those negative fundamentals? Will those holding the metal ( big speculative interests ) decide to sell their gold to meet margin calls in equity markets exactly as happened back in 2008 when the crash began across nearly all asset classes except bonds? Again, I do not know. I am watching and observing however so let's do that together and see what comes next. |
| PM Fund Manager Explains How Bullion Banks Can Continue PM Manipulation Posted: 11 Oct 2014 06:51 AM PDT
|
| 18 Sobering Facts About The Unprecedented Student Loan Debt Crisis In The United States Posted: 11 Oct 2014 05:00 AM PDT The student loan debt bubble in America is spiraling out of control, and it is financially crippling an entire generation of young Americans. At this point, the grand total of student loan debt in the United States has reached a staggering 1.2 trillion dollars, and an all-time record high 40 million Americans are currently paying off student […] The post 18 Sobering Facts About The Unprecedented Student Loan Debt Crisis In The United States appeared first on Silver Doctors. |
| Marc Faber: Investors Recognizing Global Growth Slowdown Posted: 11 Oct 2014 03:17 AM PDT Marc Faber, publisher of The Gloom, Boom & Doom Report, talks about global stocks, the economy and gold prices. Faber speaks with Matt Miller, Scarlet Fu and Olivia Sterns on Bloomberg Television's "In the Loop." Bloomberg View columnist Barry Ritholtz also speaks. This 9:02 minute video clip appeared on the Bloomberg Internet site yesterday sometime---and it's worth your while. I thank Nitin Agrawal for sharing it with us. |
| Casey Research: The Broken State and How to Fix It Posted: 11 Oct 2014 03:17 AM PDT The United States of America is not what it used to be. Unsustainable mountains of debt, continuous meddling by the government and Fed to “stimulate the economy,” and the US dollar’s dwindling status as the world’s reserve currency are very real threats to Americans’ standard of living. Here are some opinions from the recently concluded Casey Research Fall Summit on the state of the state and how to fix it. This commentary showed up on the Casey Research website yesterday---and it's certainly worth skimming. |
| William K. Black: Too Big to Jail? Posted: 11 Oct 2014 03:17 AM PDT Attorney General Eric Holder’s resignation last week reminds us of an infuriating fact: No banking executives have been criminally prosecuted for their role in causing the biggest financial disaster since the Great Depression. “I blame Holder. I blame Timothy Geithner,” veteran bank regulator William K. Black tells Bill Moyers. “But they are fulfilling administration policies. The problem definitely comes from the top. And remember, Obama wouldn’t have been president but for the financial contribution of bankers.” And the rub? While large banks have been penalized for their role in the housing meltdown, the costs of those fines will be largely borne by shareholders and taxpayers as the banks write off the fines as the cost of doing business. And by and large these top executives got to keep their massive bonuses and compensation, despite the fallout. But the story gets even more infuriating, the more Black lays bare the culture of corruption that led to the meltdown. “The Clinton, Bush and Obama administrations all could have prevented [the financial meltdown],” Black tells Moyers. And what’s worse, Black — who exposed the so-called Keating Five — believes the next crisis is coming: “We have created the incentive structures that [are] going to produce a much larger disaster.” This 25:24 minute video interview with William Black was posted on the billmoyers.com Internet site back on October 3---and I thank reader Wayne Wilcox for bringing it to my attention on Wednesday. But for length reasons, it had to wait for my Saturday column. It's worth watching if you have the time. |
| U.S. and U.K. to test big bank collapse in joint model run Posted: 11 Oct 2014 03:17 AM PDT Regulators from the United States and the United Kingdom will get together in a war room next week to see if they can cope with any possible fall-out when the next big bank topples over, the two countries said on Friday. Treasury Secretary Jack Lew and the UK's Chancellor of the Exchequer, George Osborne, on Monday will run a joint exercise simulating how they would prop up a large bank with operations in both countries that has landed in trouble. Also taking part are Federal Reserve Chair Janet Yellen and Bank of England Governor Mark Carney, and the heads of a large number of other regulators, in a meeting hosted by the U.S. Federal Deposit Insurance Corporation. "We are going to make sure that we can handle an institution that previously would have been regarded as too big to fail. We're confident that we now have choices that did not exist in the past," Osborne said at the International Monetary Fund's annual meeting. This very interesting news item appeared on the Reuters website at 6 p.m. EDT on Friday evening---and the first reader through the door was Dr. Dave Janda. Reader Harry Grant sent the Russia Today take on this a few minutes later. It's headlined "Bankocalypse drill: U.S. and U.K. to run ‘too big to fail’ collapse simulation". One, or both, are worth your time. |
| Luxembourg court declares Portugal's Espirito Santo Holdings bankrupt Posted: 11 Oct 2014 03:17 AM PDT Two holding companies of Portugal's bailed out Espirito Santo banking group have been declared bankrupt by a Luxembourg court, an official announcement said Friday. The widely expected bankruptcy ruling of Espirito Santo Financial Group and Espirito Santo Financiere came one week after the same court refused a request for creditor protection for the entities. The companies are part of the complex web of assets that controlled the fortune of Portugal's prominent Espirito Santo family, including one of the country's biggest banks. The collapse of Banco Espirito Santo came just months after Portugal successfully emerged from a €78-billion ($99-billion), three-year bailout financed by the EU-IMF. This is another story from reader B.V.---and it was posted on the South African website moneweb.co.za at 15:26 p.m. South Africa Standard Time yesterday afternoon. |
| ECB Weighing First Step to Buying Yuan for Foreign Reserves Posted: 11 Oct 2014 03:17 AM PDT The European Central Bank will discuss next week whether to begin laying the groundwork to add the Chinese yuan to its foreign-currency reserves, according to two people with knowledge of the matter. Governing Council members gathering in Frankfurt for their Oct. 15 mid-month meeting will consider the move, said the people, who asked not to be named because the discussions aren’t public. Should officials eventually decide to buy the currency, initial purchases would be small and might start in a year at the earliest, one of them said. Such a measure by the ECB would mark a major step in the internationalization of China’s currency, also known as the renminbi. While China is the world’s second-largest national economy, the yuan isn’t ranked among the most-held foreign reserve assets, according to data from the International Monetary Fund. The U.S. dollar leads at 61 percent of holdings. This news item, co-filed from Washington and Frankfurt, appeared on the Bloomberg Internet site at 4:00 p.m. MDT yesterday---and I thank reader 'David in California' for passing it around. |
| "De-Dollarizing" Russia Pays Down Near-Record $53 Billion in Debt in Third Quarter Posted: 11 Oct 2014 03:17 AM PDT Despite the reassuring narrative from The West that Russia faces "costs" and is increasingly "isolated" due to sanctions for its actions in Ukraine, the most recent data suggests reality is quite different. First, capital outflows slowed dramatically in Q3 (from $23.7 billion in Q2 to $13 billion in Q3) with September seeing capital inflows for the first time since Sept 2013. Second, Russia's current account surplus was significantly stronger than expected ($11.4 billion vs $8.8 billion expected) driven by increased trade. Third, and perhaps most crucially, Russia paid down a massive $52.8 billion in foreign debt as Putin "de-dollarizes" at near record pace, reducing external debt to the lowest since 2012. And don't forget that they're buying gold hand over fist every month as well---and we'll find out in nine days how much they added to their reserves in September. This Zero Hedge piece appeared on their website at 5:23 p.m. EDT yesterday---and it's the first contribution of the day from Manitoba reader U.M. |
| The U.S. is in the Midst of a Full-Scale Strategic Meltdown in Syria Posted: 11 Oct 2014 03:17 AM PDT For a while there, he had us going. When President Obama announced his long-contemplated strategy for confronting the Islamic State (ISIS) last month and made it clear that this would necessitate air strikes in Syria, many Syrians rejoiced at the news, believing that any intervention in their ravaged country was better than no intervention at all. Mission creep, it was hoped, would force the United States into an eventual showdown with Bashar al-Assad, a mass-murdering dictator who, as Obama was keen to reassure everyone, was not going to be a US partner in this counter-terrorism coalition since he had lost all “legitimacy” through his barbarism and would therefore be negotiated out of power — once the more pressing ISIS menace was dealt with. Except that there are growing signs that Washington has worked quietly, if indirectly, with Assad to avoid any such confrontation in the skies over Syria. This long essay appeared on the businessinsider.com Internet site at 10:11 p.m. EDT on Thursday evening---and for length reasons, had to wait for today's column. It's worth reading if this subject interests you---and I thank reader Harry Grant for bringing it to our attention. |
| Why the gold bear market may finally be over Posted: 11 Oct 2014 03:17 AM PDT After three tough years for gold, could a bullion turnaround finally be in the cards? That's the argument made by Lindsey Group's chief market analyst, Peter Boockvar, who says that the Federal Reserve meeting minutes released this week point to a reversal for the precious metal. "The three-year bear market in gold, in my opinion, is over, because yesterday in their minutes, the Fed officially threw their hat in the global-currency-war ring," Boockvar said Thursday on CNBC's "Futures Now." Boockvar refers to the unease that Federal Open Market Committee officials voiced about the dollar's strength against foreign currencies. Boockvar's interpretation is that after standing by and watching a bevy of central banks around the world take measures (lingual or market-based) to reduce the level of their currencies, "the Fed finally decided, 'You know what? I want to be part of this battle.' And to me, that's the last missing piece in the gold bull case in the context of a three-year bear market." This gold-related news story appeared on the msn.com Internet site early Friday morning EDT---and I thank Casey Research's own Dennis Miller for sending it our way. |
| Lawrence Williams: Silver in supply deficit but price unmoved so far Posted: 11 Oct 2014 03:17 AM PDT Silver has been dubbed the ‘devil’s metal’ and likened to ‘gold on steroids’ because of its vastly more volatile price pattern vis-à-vis gold, with which it is inextricably linked. Indeed the prices of all the so-called precious metals tend to be linked to gold’s price performance although their fundamentals suggest that this should not be the case and, like silver, industrial supply/demand factors should be the main price drivers.. Over the past two years with gold in decline, silver has thus fared even worse, it tending to underperform gold on the downside and outperform on the up. A much followed measure of this is the gold:silver ratio which over the past few years has varied from around 35 to 70 and, at the time of writing is sitting at just over 70 – the worst level (for the silver investor that is) for 4 years. What is perhaps surprising regarding the current silver price though, is that the latest analysis figures from specialist London-based precious metals consultancy, Metals Focus, suggest that this year silver will again be in supply/demand deficit, as it was last year, yet the price has still continued to fall. The silver bulls – and there are plenty of them – will point to murky goings on in the COMEX silver market as the root cause behind the decline, with huge short silver positions held by big banks with the apparent financial clout to manipulate the market whichever way they wish. Lawrie understands the situation precisely---and even a cursory glance at my comments on silver in the Bank Participation Report shows that JPMorgan and Canada's Scotiabank are the two largest Comex short holders in silver on Planet Earth. This commentary appeared on the mineweb.com Internet site on Friday---and I thank reader U.M. for sending it our way. It's certainly a must read. |
| Swiss National Bank Explains Why it is Against Repatriating Gold Posted: 11 Oct 2014 03:17 AM PDT The Swiss National Bank has lashed out at the so-called "gold initiative" efforts to "Save Our Swiss Gold" unsurprisingly proclaiming it as a bad idea. As Ron Paul previously noted, "The gold referendum, if it is successful, will be a slap in the face to those elites," and so the full-court press ahead of the Nov 30th vote has begun (a la Scotland fearmongery) as SNB Vice Chairman Jean-Pierre Danthine explains how a 'yes' vote for the initiative "would severely constrain the SNB’s room for manoeuvre in a future crisis," as it "poses danger to the conduct of a successful monetary policy." His reasoning (below) is stunning... This very interesting commentary appeared on the Zero Hedge website at 10:06 a.m. EDT yesterday---and I thank reader U.M. for bringing it to my attention, and now to yours. It's worth reading if you have the time. |
| Nomura Currency Analysts Think Swiss Gold Vote Unlikely To Pass Posted: 11 Oct 2014 03:17 AM PDT Although more attention is being focused on Switerland’s gold referendum on Nov. 30, currency analysts at Nomura said a “yes” vote could be difficult to achieve, according to the country’s voting statistics. According to a research report published Tuesday by Nomura, referendums in Switzerland are fairly popular; however, very few are actually able to pass. Since 2000, the country has voted on 66 different initiatives, about 4.7 referendums per year, and only 15% have passed. In the Nov. 30 referendum, Swiss citizens will be voting on three initiatives: whether or not the Swiss National Bank should increase its gold reserves to 20%, that the central bank should stop selling its precious metals and that all its gold should be held within the country. The analysts said that their base case is for the “no” side to win, but they still looked at the implications in the off-chance that the “yes” vote one. This news item showed up on the kitco.com Internet site at 11:58 a.m. EDT yesterday---and it's another offering from reader U.M. |
| Chinese gold buying picks up after holiday; Indian premiums rise Posted: 11 Oct 2014 03:17 AM PDT Buying activity in China's physical gold exchange ticked up this week, indicating retailers in the top consumer of the metal saw good sales during the week-long National Day holiday. Prices on the Shanghai Gold Exchange - the platform for all physical trades in China - were about $5-$6 an ounce higher than the global benchmark XAU, compared with about $3 before Chinese markets closed for the holiday. The increased buying interest shows retailers are probably restocking after sales during the holiday from Oct. 1-7. The annual holiday, also known as the Golden Week, is a time when millions of people travel and spend more than usual. It also marks a pick-up in weddings, boosting demand for gold jewellery. This Reuters story, co-filed from Singapore and Mumbai, was posted on their Internet site at 5:00 p.m. IST on their Friday afternoon---and it's the final contribution of the day from Manitoba reader U.M.---and I thank her on your behalf. |
| Goldcorp CEO visits Australia and predicts 'peak gold' next year Posted: 11 Oct 2014 03:17 AM PDT Canada's Goldcorp, the world's biggest gold producer by market value, has renewed its prediction that "peak" gold will arrive next year, setting the scene for the bullion price to rise significantly over the next five to 10 years. And it expects competition for gold resources will eventually force it out of its "comfort zone" of operating only in North and South America, with Australia's status as a major mining destination making it part of the new location considerations. Goldcorp president and chief executive Chuck Jeannes told the Melbourne Mining Club yesterday that from next year there would be a steady reduction in global mine supply, due in part to the rate of new discoveries falling dramatically since peaking at 175 million ounces in 1995. He said while investment demand for gold had been hit with the flight to equities in the past two years, China's cultural affinity for the precious metal, the rising wealth of its population, and the need for asset diversification away from the U.S. dollar meant the supply/demand fundamentals were "very strong" with the coming of peak gold. This story, filed from Melbourne, was posted on theaustralian.com.au website on Friday---and it's posted in the clear in this GATA release. |
| Lawrence Williams: Silver in Supply Deficit, But Price Unmoved So Far Posted: 11 Oct 2014 03:17 AM PDT "Well, we're back at the brink once again" ¤ Yesterday In Gold & SilverIt was a 'nothing' sort of day in the gold market yesterday, with the price trading within a five dollar range for the entire Friday session everywhere on Planet Earth. The highs and lows aren't worth looking up. Gold was closed in New York yesterday at $1,223.00 spot, down 60 cents from Thursday's close. Net volume was pretty quiet at 115,000 contracts. The silver price action had a bit more shape to it, but only just. After getting sold down about 15 cents in early Far East trading, it bumped along the bottom in a very tight range until the noon silver fix in London. At that point it chopped quietly higher until noon in New York---and that was it for the day. The low and high ticks, such as they were, were reported by the CME Group as $17.205 and $17.42 in the December contract. Silver finished the day at $17.395 spot, up 4.5 cents from Thursday's close. Net volume was only 29,000 contracts. Platinum continued its downward trend from Thursday afternoon into early morning trading in the Far East on their Friday, hitting its low around 10:20 a.m. Hong Kong time. After that it didn't do much---and was closed down 15 dollars on the day. Palladium had a somewhat similar sell-off, although it took longer to get to its low of the day, which came in mid-morning trading in New York. It rallied a few bucks off that low before trading sideways for the remainder of the Friday session. Palladium was closed down another 12 bucks. The dollar index closed late on Thursday afternoon in New York at 85.55---and then didn't do much until 2 p.m. Hong Kong time. From there it rallied to its 85.97 high, which came around 10:40 a.m. EDT. The index sold off a handful of basis points into the close, finishing the Friday session at 85.85---up 30 basis points from Thursday's close. The gold stocks opened weaker, hitting their mid-morning low minutes after 10:30 a.m. EDT. From that point they rallied into positive territory, but couldn't hold even those tiny gains---and sold back into the red as the Friday trading session wore on. The HUI finished down another 2.44%---and back at its low of the day. The silver equities followed a similar pattern, but they fared somewhat better, as the sell-off after the noon EDT high tick wasn't quite as severe as gold's---and Nick Laird's Intraday Silver Sentiment Index closed down 'only' 1.29%. The CME Daily Delivery Report showed that zero gold and zero silver contracts were posted for delivery within the Comex-approved warehouses on Tuesday. There were, however, 401 platinum contracts posted for delivery. All were issued by JPMorgan Chase out of its in-house [proprietary] trading account---and the biggest stopper [out of 7 in total] was HSBC USA with 230 contracts, also out of its in-house [proprietary] trading account. The link to yesterday's Issuers and Stoppers Report is here. As I mentioned here yesterday, the folks over at the CME Group posted the wrong day for Thursday's Preliminary Report, so here are the final numbers for that day. There was little change in the number of gold contracts still open in October. There were 1,316 contracts open, down 1 contract from Wednesday. In silver, the number of contracts still open declined by 46 contracts---down to a total of 178 contracts still outstanding. The CME Preliminary Report for the Friday trading session showed that October open interest in gold slid another 182 contracts down to 1,134---and silver added 6 contracts to 184. There was 85,039 troy ounces of gold withdrawn from GLD yesterday---and 1,917,484 troy ounces of silver were withdrawn from SLV, the second withdrawal in as many days. The U.S. Mint finished the week with another decent sales report. They sold 8,000 troy ounces of gold eagles---1,500 one-ounce 24K gold buffaloes---and 270,000 silver eagles. Month-to-date the mint has sold 33,000 troy ounces of gold eagles---11,000 one-ounce 24K gold buffaloes---2,520,000 silver eagles---and 400 platinum eagles. Based on these numbers the silver/gold sales ration stands at a hair over 57 to 1. There was a big gold shipment out of JPMorgan's vault at the Comex-approved depositories on Thursday, as they sent 128,698 troy ounces off for parts unknown. 19,933 troy ounces were reported received by Canada's Scotiabank. The link to that activity is here. The in/out activity in silver was rather subdued for the second day in a row, as only 300,251 troy ounces were reported received---and nothing was shipped out. What activity there was came at Brink's, Inc.---and the link is here. The Commitment of Traders Report, for positions held at the close of Comex trading on Tuesday, wasn't what I was expecting, but as Ted Butler pointed out on the phone yesterday afternoon, the silver price ended flat for the reporting week---and gold actually closed up a couple of bucks. Yes, we set new low ticks for all four precious metals during the reporting week, with all but silver occurring just after the markets opened at 6 p.m. EDT on Sunday. Ted said that these lows didn't mean much, as there was so little volume associated with them, that they were more fishing expeditions by JPMorgan et al and their HFT buddies, than anything else---and the powerful rallies [with high volume] off those lows pretty much negated any improvements in the COT Report that would have shown up if those rallies hadn't occurred. So the report is what it is. In silver, the Commercial net short position actually increased by 1,479 contracts, or 7.4 million ounces. The Commercial net short position now stands at 81.2 million ounces. Ted says that JPMorgan's short-side corner dropped by about 500 contracts during the reporting week---and now stands at 10,500 contracts, or 52.5 million ounces of the stuff, which is a huge percentage of the total Commercial net short position. Ted also said that this is JPM's smallest short position in silver since they took over Bear Stearns back in mid 2008. Under the silver hood in the Disaggregated COT Report, the Managed Money sold 1,200 long contracts---and covered 835 short contracts, so their net short position is a new record high, albeit by a small amount---365 contracts. In gold, the Commercial net short position also increased, but it was only by 2,678 contacts, or 267,800 troy ounces. Their net short position now stands at 6.34 million troy ounces. Ted says that JPMorgan's long-side corner in gold is now 2.1 million troy ounces. In the Managed Money category, these traders sold 1,200 longs and covered 140 shorts, so they increased their net short position in gold by the difference between those two numbers. In copper, the Commercial traders' net long position increased by another 1,409 contracts. Here's Nick Laird's "Days of World Production to Cover Short Positions" for the 4 and 8 largest short holders in all the physically-traded commodities on the Comex. And now for the October Bank Participation Report. There were improvements in the Comex net short positions of all the world's banks in all four precious metals---from big changes to small ones. Don't forget that this BPR data is extracted directly from the current COT Report data, so for this one day a month we can compare apples to apples---and see what the bullion banks have been up to versus the rest of the traders. In gold, '3 or less' U.S. banks were net short 2,633 Comex contracts. In the September BPR, these same '3 or less banks' were net short 10,064 Comex contracts, so there has been an improvement of about 8,400 contracts during the reporting month. Since Ted puts JPMorgan's long-side corner in the Comex gold market at 21,000 contracts, this means that the other '2 or less' U.S. bullion banks---which would be HSBC USA and Citigroup---have to be net short about 18,400 Comex contracts between them to make the math work out properly. Also in gold, '19 or more' non-U.S. banks held 49,887 Comex contracts net short. In the September report, these same banks were short 60,925 Comex contracts. I would be prepared to bet a decent amount of money that Canada's Scotiabank is short a third of those 60,925 contracts all by itself. That would make the remaining 40,000 contracts or so, divided up between the remaining 18 non-U.S. banks, are more or less immaterial. Below is the BPR chart for gold going back to 2000. Note the blow-out in the short position in gold in the U.S. banks [red bars on Charts 4 and 5] in August of 2008. This is when JPMorgan took over the Comex short positions of Bear Stearns. Also note the blow-out in gold in the non-U.S. banks [the blue bars on Chart #4] when Scotiabank got 'outed' in October of 2012. The net Comex short position there blew out by almost double. The net long position also increased. The 'click to enlarge' feature really helps here. In silver, '3 or less' U.S. bullion banks were net short 9,867 Comex contracts. [In the September report, the same number of banks were short 15,953 Comex contracts] Since Ted pegs JPM's short position in silver at 10,500 contracts, this means that the other U.S. banks must be net long the Comex futures market to the tune of 700 contracts or so. Obviously JPMorgan holds the largest silver short position of all the U.S. banks. Also in silver, '11 or more' non-U.S. banks are net short 19,585 Comex silver contracts. [In the September BPR these same banks were short 22,298 Comex silver contracts] Just like in gold, I'd bet money that the lion's share of the non-U.S. banks' short position in silver is held by Canada's Scotiabank---approaching 90 percent, if not higher. It's my opinion that their short position in the Comex silver market now dwarfs that of JPMorgan. It's almost not worth mentioning, but the Comex short positions in silver held by the other 10 bullion banks are totally immaterial. Below is the BPR chart for silver and, once again, cast your eyes on the events of August 2008 on charts #4 and #5---and October 2012 in chart #4---to see where JPMorgan took over the silver short position once held by Bear Stearns---and where Canada's Scotiabank was 'outed' by the CFTC. Both events stand out like the proverbial sore thumbs that they are. In platinum, '3 or less' U.S. bullion banks are net short 6,196 Comex contracts, which is a huge decrease compared the prior three reports. Note on chart #5 the tiny long positions held by these U.S. banks, compared to their massive short positions. This is proof positive that these positions are held solely for price management purposes. I would bet that JPMorgan is the proud owner of the lion's share of these positions as well. Also in platinum, '14 or more' non-U.S. banks are net short 4,453 Comex contracts, which is also a massive improvement from prior months. As a 'for instance' these same banks were short 8,880 Comex platinum contracts in the July BPR, which was the low before the last rally in gold and silver began. Divided up more or less equally, which they probably aren't, most of the positions held by these 14 banks approach immaterial as well, at least compared to the outrageous short positions held by the U.S. bullion banks, principally JPMorgan Chase. In palladium, '3 or less' U.S. bullion banks are net short 8,687 Comex contracts, which is down from the 10,643 contracts they were net short in September, but virtually the same as they were short back in the July BPR. So even though JPMorgan et al engineered the price down by about $150 during the reporting month, to its lowest level since mid April, that's the best they could do. The non-technical traders on the long side in the Managed Money category flatly refused to puke up their positions, or go short by much. That situation holds true to a certain extent in platinum as well. Also in palladium, '13 or more' non-U.S. banks were net short 3,765 Comex contracts, which is down big from the 5,937 Comex contracts they held net short in September's BPR. But it's only a marginal improvement in their 4,694 short position they held back at the end of June. Try as they might, da boyz can't get any traction in palladium---and that's certainly obvious over the last 18 months in the chart below. And as an aside in Chart #5, look at the obscene short positions compared to their puny long positions held by the '3 or less' U.S. banks. It's so grotesque, one doesn't know whether to laugh or cry. So, once again, it's Citigroup, HSBC USA, Scotiabank---along with the ring leader JPMorgan Chase that run the show in all four precious metals. And it's a good bet that they, at least the U.S. banks, have their little piggy noses in the copper, crude oil and dollar index troughs as well. Here' the Global Indices chart that Nick Laird sent around very late yesterday evening MDT---and it tells you pretty much everything you need to know. I have a very decent number of stories for you today, so I hope you can find the time in what's left of your weekend. ¤ Critical ReadsJim Grant: Time to stop government-imposed bull marketThe Federal Reserve needs to return interest rates to more normal levels and free financial markets from government-sponsored price control, said Jim Grant, founder of Grant's Interest Rate Observer. The real value of asset prices would come in "clearer focus" if rates were not so artificially low, he said on CNBC's "Squawk Box" Friday, a day after a 334-point drop in the Dow Jones industrial average—the worst day since February and the third straight move in either direction of 200 points or more. "Interest rates now are not discovered as one discovers prices in a free market. They are administered and imposed," he said. Since the financial crisis, the central bank's easy money policies have been encouraging a shift into riskier assets, said Grant. "The Fed was wanting us all to get out of savings accounts and into junk bonds and equities. It was very pleasant when the getting in was going on. Now perhaps, it's time for the getting out." This must watch 2:02 minute CNBC video clip was posted on their website around 7 a.m. EDT on Friday morning---and I thank reader Ken Hurt for today's first story. Marc Faber: Investors Recognizing Global Growth SlowdownMarc Faber, publisher of The Gloom, Boom & Doom Report, talks about global stocks, the economy and gold prices. Faber speaks with Matt Miller, Scarlet Fu and Olivia Sterns on Bloomberg Television's "In the Loop." Bloomberg View columnist Barry Ritholtz also speaks. This 9:02 minute video clip appeared on the Bloomberg Internet site yesterday sometime---and it's worth your while. I thank Nitin Agrawal for sharing it with us. It Doesn't Get Any Scarier Than This (Literally)The Fear and Greed meter is pretty much pegged in the red on the Fear side at the moment---and you can read all about it in chart form in this commentary that was posted on the Zero Hedge website at 7:28 p.m. EDT on Friday evening. I thank reader U.D. for passing it around. A 14% Student Loan Default Rate Isn't 'Good News'The Department of Education just published its latest report on cohort default rates for student loans that entered repayment in 2011, which officials characterized as “good news” because the rate declined to 13.7% versus 14.7% for the prior year. Despite what the officials say, perhaps it would be wise to keep the champagne on ice for a while longer. The calculation behind the CDR divides the total number of students who defaulted on government loans that entered repayment in a particular year (the so-called cohort year), by the total number of borrowers who began to repay their education-related debts in the same cohort year. Colleges and universities are especially focused on this metric, not least because their access to federal grants and loans hinges upon default rates that are no more than 30% for three consecutive years or 40% in any one year. This very interesting opinion piece appeared on the credit.com Internet site on Tuesday---and it's the second offering of the day from Ken Hurt. S&P 500 Companies Spend 95% of Profits on Buybacks, PayoutsCompanies in the Standard & Poor’s 500 Index really love their shareholders. Maybe too much. They’re poised to spend $914 billion on share buybacks and dividends this year, or about 95 percent of earnings, data compiled by Bloomberg and S&P Dow Jones Indices show. Money returned to stock owners exceeded profits in the first quarter and may again in the third. The proportion of cash flow used for repurchases has almo |
| An End Is Still Not In Sight Gold And Silver’s Price Decline Posted: 11 Oct 2014 02:40 AM PDT At the end of September, Yahoo ran a picture of Putin along side of Stalin. No too much in the way of suggestive association at play here by the media intent on pleasing the elites and federal government. The caption was what the two have in common, both from Russia certainly being one. What we know for sure is that neither ever won a Nobel Peace Prize, and neither has been responsible for inciting wars all across the globe and bombing other countries into submission, so Obomba is one-up on them in that regard, but his photo did not appear in the line up. Question? How many countries have Russian troops on their soil? The US has maybe over 150. How many drone strikes has Russia conducted against other sovereign nations? No one has unleashed more killer drone strikes than Barack Hussein Obomba. No one. How many Islamic extremist groups has Russia trained and armed? The CIA has created, armed and trained al-Quida, and now ISIS with the intent is to create chaos in the Middle East as an indirect deflection for bringing down Assad in Syria and attempting to disrupt the flow of Russian oil and natural gas to Europe, trying to save the fast-sinking US fiat petrodollar. ~ Few Americans have ever heard of Udo Ulfkotte, a former editor of Frankfurter Allgemeine Zeitung [one of Germany's largest newspapers]. The CIA had been pimping him out to write pro-American articles for German and international consumption. He had an "aha" moment of conscientiousness when he could see how the US has been pushing so hard for war, and he had had his fill of lying for the US government. There is an article and clip from RT News, but do not be put off by the news source. No US media would ever give it coverage. It is interesting, especially for Americans who do not get any or much news outside of elite-controlled mainstream news. Lest anyone think the story lacks credibility, we did an article a few weeks ago of a US journalist who refused to cooperate and, in fact, wrote an expose on the CIA employing journalists in this country, [Do You Trust The Government, Or The Media?]. The movie, Dark Alliance, is due out soon. ~ Who put the TSA in charge of groping Americans, including the handicapped, the elderly, and children from toddlers to teens? In every other aspect of American society, children are a special class and are to be protected. The federal government does not see it that way. Obama is responsible for that. There has never been a single incident in U S airports to justify the personal abuse and onslaught against rights. Other airports around the world where terrorists are more likely to strike do not have the same kinds of unnecessary security as does the US, but it serves a purpose here. Psychological control and conditioning to keep citizens subservient to the increasingly militarized government. Ferguson, Missouri is an example of the direction this country has taken, and as night follows day, expect to see the militarization of all police, more control given to the TSA, more clamping down by Homeland Security [it is NOT your Homeland being secured… the homeland is the corporate federal government that is to be protected at all costs]. ~ The US wars in Iraq and Afghanistan cost $6,000 billion, and counting, as compared to the $738 billion spent on the Vietnam War. There are certain factions in the Western world that are the sole financial beneficiaries of creating war[s]. The United States has been in a perpetual "state of war" since WWII. During times of war, constitutional rights are suspended, a fact of which few American are aware. ~ Here is something to which many Americans can relate. To learn how corrupt the United States government has become, just follow the money. According to the most recent Federal Reserve Flow of Funds report, US households currently have an all-time high $82 trillion in overall wealth. However, that wealth is not evenly spread around. If it were spread out evenly, every US household would now have $712k. As of the end of 2013, the median household only had $56k in wealth. From 2007 – 2013, overall wealth increased 26%, while the median household lost a shocking 43% of their wealth. If median wealth continues to decline at this rate, over 50% of US households will be bankrupt within the next decade. Next time, listen closely to Obama as he tells you how well the economy is doing. Then compare his empty words to the facts of reality. ~ The US knows two things and two things only, exporting debt and war. The rest of the world has reached the end of their tolerance level as the US continues to lose respect and support from what were once considered staunch allies. Everyone knows what has happened to Greece, Cyprus, Ireland, and a host of other countries on the brink on insolvency. All of these countries were financially weak and politically vulnerable to the unelected officials from the EU who are dictating to these once sovereign nations. Those financially weak were stuffed with more impossible to repay burdensome debt. Other counties, particularly of the Muslim persuasion, have been facing war endless bombing, and the devastation of their countries, either in the service of US control of the drug trade and the wealth it brings, or in the service of applying pressure to Russia. ~ Take Germany, for instance, the de facto 53rd state of the United States. Germany has had to make some choices recently: agree to side with the US and support sanctions against Russia over Ukraine, or not. By allying with the US, Deutschland is faced with unlimited amounts of debt and increasing risk of war. By Germany not sanctioning Russia and maintaining its economic ties, instead, it had potential unlimited economic growth. Frau Merkel chose to side with the US and the unelected parasites from the EU and go along with the sanctions pushed so hard only by Obama and no other country. In so choosing, Merkel has put at risk over 300,000 German jobs. There has been a 25% decline in new car sales, 8.8% less capital goods were produced, factory orders were down by 5.7%, and industrial production declined by 4%, recently. There are around 4,000 German companies that do business with Russia, and there are also many financial ties between Germany and China. Germany chose to suffer economic decline over economic growth in order to support sanctions against Russia that are not working, and in fact are working against those countries participating in the sanctions. It is hard to believe Germany will continue along the path of decline along with the US descent into Third World Status. If not Merkel, sooner now, rather than later, the German people will say, Enough! When that happens, it will be the US/UK standing [sinking] alone as the rest of the Western world, maybe except Poland, decides sovereign-death- by-US-debt is not the way to go. ~ Ebola. Americans have to be body searched at airports, cannot bring bottles of water on board, and a host of other absurd but harmless rules, but hey if you have the Ebola virus, bring the patients to America on board flights. No problem, says the federal government. "We have everything under control." Why risk and allow people exposed to this deadly virus into the country? From that non-Ebola infected state, Connecticut, its citizens are now now subject to martial law where people can be detained for no apparent Ebola reason than "just in case," and detained for any length of time, without recourse to rights or any trial. How New World Order of Connecticut to take pre-emptive measures and shred the Constitution and all Rights for its residents. Coming soon to a state near you! Us motto: Never let a good disaster go without taking advantage of the people. ~ What is the binding factor in these events? All have the fingerprints of the elites going about whatever way necessary in order to destroy social order and bring about total New World Order control over a Single World State. Taken individually, there would seem to be no apparent tie, but all Western world events are tied to elite domination. The fact that the New World Order continues to move forward, unimpeded by any nation, to date, tells you how suppressed control over the price of gold and silver is so readily accomplished, irrespective of China and Russia's massive accumulation of both metals. The end of the story is inevitable, at least for the US as a failed nation that wrecked its own economy and those of many other countries, all in the service of perpetuating a fiat currency Ponzi scheme devised and implemented by the Rothschilds. No nation has ever escaped from or triumphed over a fiat paper economy. What so many are now discovering, and is the point of this article, is that it will take much longer than most ever expected before gold and silver will emerge as winners over a failed system. All of these seemingly unrelated events are examples of the hidden but absolute control exerted by government forces carrying out the orders of the money controllers. Have gold and silver seen a bottom yet, and is there a turnaround soon in the cards? No, and no. The realization that the Shanghai Gold Exchange has not had the impact of "truth in gold pricing" many expected, should come as no surprise. It is still business as usual as gold and silver languish around recent lows. There is no date one can mark on the calendar that points to an end of the Rothschild dominance over Western fiat currencies and their suppression of the anti-dote to all fiats, gold and silver. We reported Switzerland is due to hold a referendum on expanding the % of gold as a backing to its once stable currency. The Swiss central bank came out opposed to any such notion as it would restrict the central bank's ability to issue more fiat, and it would make Swiss bankers more fiscally responsible, an impossibility for them. If ever there were an example of getting out from under the Rothschild fiat thumb, this would be such an opportunity. It will likely go the way the Scottish referendum did: A fixed "No" vote. All one can do is to keep holding and keep buying as much as one can, suitable to their financial circumstances, and wait. There really is no alternative, and complaining about it will not bring the day of fiat reckoning any closer. Weekly gold has hit important support for the third time since the 2011 highs. There was an immediate rally following the previous two tests, and it would seem one will follow this one. There is a more positive sign on last week's retest, for it is the only retest where price opened near the low for the week and closed relatively strongly. Many want to be the first to call a bottom, and almost all of those "many" have already called for a bottom, some more than once, but we will not likely be among them. We prefer to follow developing market activity, and let it determine when a bottom is final. The realization of a bottom can take days, often weeks to confirm. Those who have called bottoms in the past few years never had the patience to wait for confirmation, which never came, obviously. Agreement between time frames is important, so after last week's key reversal low, a look at the daily chart is in order to se if that time frame supports the weekly activity.
The chart comments are apt. Wednesday's high volume red bar, [indicating a close lower than the previous day] is noteworthy because increased effort to sell did not lead to more selling. If that were the case, then the apparent selling is more likely smart money buying from weak longs and short-term profit-takers who bought lower. It seemed the activity from last week looked mixed but could be stronger than it seemed, so a look at an intra day chart could add to the read.
Three things stand out, in order, and their order demonstrates the necessity of waiting for confirmation of one form of activity followed by another. We start with the S/D from the previous Friday, 3 October. [S/D = Supply over Demand, denoted by an EDM {Ease of Downward Movement}, a wide range bar on increased volume that closes low-end.] By Friday's poor close, it "looked" like there was more downside to follow, and that would be a logical assessment. By the end of trade on Monday, the previous Friday's losses were retraced. There was no confirmation that Friday's sell-off would lead to lower prices. A few days later, on the 8th, there was another strong volume move lower, intra day, but it stopped at the developing support area of 1205, and a fast reversal developed on even stronger volume, a D/S bar that totally erased the sell-off from the 3rd. What can be said now of the activity from the 3rd, which was not apparent at the time, is that the S/D was really strong hands buying everything offered from weak longs, sell stops, new shorts, etc. This is an important piece of information because we now know that area, 1210 – 1195 will be defended as support rom those who were buyers. Adding the D/S market activity from the 8th strengthens that new read of market activity, and the 1205+/- area should be watched closely as future support. It also explains the artificially set closing price at the low of the bar, when in reality, price closed near the high. This would be a minor example of persistent price manipulation by the banks in charge of setting prices for gold. The seeming weak upside rally attempt and less than strong close looked like buyers had lost the ability to move price higher, but with last Friday's activity added, both days stayed above a 50% range retracement of the D/S high volume bar of the 8th. This indicates a sign of strength, at least for the short-term, in an otherwise down market environment. It is not that these price points are necessarily inviolate over the next several TDs [Trading Days], but they are important point to watch for HOW price reacts to them in the future. For example, if a correction were to hold at the 1205 area, it would then confirm what was observed back them. If price declines easily through the 1205 area support, it then erases the potential significance of support there. The conclusion is that gold has responded positively over the last several TDs. Now we need to see some successful retesting and holding at these observed levels.
Silver is a different read, lacking the positive elements discussed in the gold charts. We need to see buyers be able to create strong volume and strong close bars to the upside. Just as one swallow does not a summer make, one reversal bar does not a trend change make.
Not much can be said of silver until there is evidence of buyers taking a stand and overcoming the effort of sellers. In fact, silver remains in an oversold condition, so one cannot be very bullish about a market in a down trend and oversold within such a trend. It does not speak of any strength.
|
| Precious Metals Getting a Temporary Reprieve Posted: 11 Oct 2014 01:10 AM PDT The Daily Gold |
| Posted: 10 Oct 2014 10:00 PM PDT Mises.org |
| Posted: 10 Oct 2014 09:40 PM PDT Readers have made an amazing response to our final appeal, for $16,000 to fund more original reporting. Since our last update, a mere few hours ago, we went from being 34 shy of meeting our donor goal of 1200 to a mere three donors short. And we were then $560 below our $16,000 goal but have now exceeded it by $1250! Only three hours remain in the Naked Capitalism fundraiser. Show your support of critical thinking, merciless evisceration of lame punditry, deep diving into turbid financial waters, and cute animal pictures. Every dollar you give now goes to support more original reporting. |
| PM Fund Manager Explains How Bullion Banks Can Continue PM Manipulation Posted: 10 Oct 2014 09:18 PM PDT PM Fund Manager Dave Kranzler joins us this week for a power packed show discussing: Triple Bottom or Dead Cat Bounce? The outlook for gold & silver over the next 6 months Physical silver update- demand explodes as more physical sold in the first week of October than all of July & August! Giant House […] The post PM Fund Manager Explains How Bullion Banks Can Continue PM Manipulation appeared first on Silver Doctors. |
| Posted: 10 Oct 2014 09:00 PM PDT Golden Sextant |
| Posted: 10 Oct 2014 08:54 PM PDT So much for stock market complacency.. the VIX - Volatility Index - or as I prefer to call it, the Complacency Index, hit a 10 month high today. The bulls have pretty much had a one way market for as long as we can seemingly remember. Looks like that has changed some! We have gone from confidence to uncertainty to concern. We have not reached fear however.  By the way, further confirmation that those who have been preaching hyperinflation and currency induced cost push and whatever for so many years have been utterly confounded. The yield on the Ten Year Treasury hit a 16 MONTH LOW today!  The US Dollar managed to bounce right off of chart support near 85 and ended the week just below 86. It is essentially halfway between resistance at 87 on the top and support at 85 on the bottom. A push through 87 sets it up for a run to near 89. Should it fall below 85, there is a band of support near 84 and with better support near the Fibonacci retracement level just below 83.  I have some further bad news for gold bulls unfortunately - GLD, that big gold ETF has been disgorging gold all week long even as the price has moved up from below the $1200 level. Simply put - investors/traders are moving money out of GLD and out of equities and putting that into bonds during this risk aversion period. Rallies in GLD are thus being viewed as selling opportunities. This is NOT what gold bulls want to see.  For this year, 2014, reported gold holdings are down over 38 tons from the start of the year ( 38.78 to be exact ) to 759.44 tons. This is the lowest level in GLD since December 2008! That is NEARLY SIX YEARS AGO. Western-origin gold investment demand continues to disappoint. |
| Oil price slump to $85 pulls the S&P 500 down so what about Gulf equities? Posted: 10 Oct 2014 08:32 PM PDT Black gold continues to slump in price and energy is such an important sector of the S&P 500 that it is pulling the whole index lower and lower. The equity markets of the Arabian Gulf will doubtless be in the crosshairs too this coming week as a weaker oil price impacts directly on their local economies. The ‘Squawk Box’ crew discuss the impact of lower oil prices on the stock market, with CNBC’s Dominic Chu… |
| USDA Supply and Demand Reports Posted: 10 Oct 2014 08:25 PM PDT As promised - though admittedly quite late - here are some observations on today's (Friday) USDA grain reports, which resulted in some very big moves across the complex. Let's start with the corn first - The trade was expecting a reduction in the ACREAGE PLANTED and that is what it received. Specifically, the number was lowered to 90.9 million acres from last month's 91.6 million. Harvested acreage was also reduced slightly to 83.1 million from last month's 83.8 million. What the trade seemed focused on however was the increase in yield from 171.7 bushels to 174.2. They also boosted beginning stocks to 1.236 billion bushels from last month's 1.181 billion. Total production for this year came in at 14.475 billion bushels up from the September estimate at 14.395 billion. USDA found another 50 million bushels for feed usage from the September estimate mainly because the WASDE report showed an increase in beef, pork, and poultry production next year from the previous month. Those critters need to be fed. By the time they did the numbers, they gave us a carryover of 2.081 billion bushels compared to what they estimated last month would be a 2.002 billion bushel carryover. To provide a bit of perspective, the 2013-2014 marketing year carryover ended at 1.236 billion. We are essentially going to end up with nearly 70% more corn left over next year. It is interesting to see how the trade responded to the number when it first hit. Expectations were that USDA would kick the yield number higher than they did and some came in to buy on that, but most of us who have followed these reports for many years know that USDA tends to be very conservative preferring to err on the low side and then come in the following month with an upward revision during big crop years. With private analytical firms generally reaching a yield consensus higher than today's number, traders used the short rally to sell as expectations are that USDA will give us that higher number next month. Besides, with a carryover of this size and with a record, bin-busting crop, buying a market to take it higher on data like this was rather ill-advised to say the least. One thing I also noticed was the extent to which those corn/wheat spreads were battered today. Yesterday, the wheat market sharp drop lower on rotten export numbers fueled some big selling in wheat. Harvest delays in corn were used to bull up the market ( strangely I might add ahead of a major USDA report ). The spread shot up in favor of corn by some 16 cents or so. Today, with the lowered than expected wheat number, that entire gain was wiped out in a single day with the spread dropping 16 cents. Talk about whipsawing! And to think that spread trading is supposed to be less risky and less volatile. HA! You have got to be kidding me. When one leg of a spread goes one way and other goes the other way, and both of them are going the wrong way as far as someone in the spread is concerned, you end up LOSING EVEN MORE MONEY than a plain old outright position would have cost you. That HURTS, BIG TIME! What I am going to be very interested in seeing now is how this spread performs as we move forward. The reason is simple - the large specs have been and remain net longs in the corn market even though the primary trend has been down for many weeks. They have been able to do this because they have been in those spreads mentioned and short wheat while maintaining a long corn leg. My concern has been what happens if those big specs decide to unwind those spreads or even reverse them? Corn could get clobbered as they exit the long side of that trade. I am saying that this is going to happen and I certainly cannot advise anyone who does not know what they are doing in the grains to become a spread trader ( remember if you are a novice you could end up losing money on both sides and get hurt even more badly than an outright futures position ) but I will say that the potential exists for wheat to gain on corn. Then again, from what I can see, there is not exactly a shortage of wheat out there either. Exports completely shut off last week when wheat was above $5.00 and here we see the trade push the price right back up over $5.00 today on the USDA numbers although it did settle below that level by the time the closing bell rang. With the Dollar bouncing back off of support near 85, US origin commodities become less competitive on the global market meaning a rally in wheat, along with a rallying Dollar is not going to make it any cheaper for our export customers and they have LOTS of options to choose from out there as the US is not the only wheat game in town. Briefly on the beans ( it has been a very long day ) - USDA cut the planted acreage to 84.2 million from last month's 84.8. They also dropped harvested acreage to 83.4 million from 84.1. Apparently there were some additional acres that were washed out earlier this year and not planted plus some that were planted and then washed out and not replanted. They did however raise the yield to 47.1 bushels from 46.6. I and others believe that they are too low on this number and that it will be revised higher next month and in December as well. They did cut the old carryover number even further to 92 million bushels from last month's 130 million reflecting the rather strong demand from end users as they waited for new crop supplies to hit the pipeline. Total production for this year was bumped up to 3.927 billion bushels from last month's 3.913. The resultant carryover for the new crop came in at 450 million bushels, down from last month's estimate of 475 million but obviously nearly 5X the amount of the 2103-2014 crop year. Traders looking at the numbers were inclined to view that reduction in the carryover as a reason to buy and that is what happened initially. My view is that there were some big guns itching to flush the small spec stops on the upside. However, they could not reach them as these mysterious buyers had already run prices up on Monday this week and proceeded to gun them even higher ahead of the report day. Simply put, there was no reason to chase beans at those levels because in spite of the slight reduction in carryover, we are still looking at a record crop. Traders also felt that USDA yield numbers were too conservative ( so do I based on what I am seeing from the private firms ) and used the rally, just like they did with corn, to sell. The result is that both corn and beans go into Sunday night with some potential to see additional selling take hold, especially if the weather window next week for harvesting looks favorable. I will try to get some charts up tomorrow. I should also note that the Goldman Sachs Commodity Index closed at a 49 month low today! |
| Just the start of a correction for US stocks no sign of capitulation Posted: 10 Oct 2014 08:22 PM PDT How low do US stocks go after the worst week in two years for the market? This is not to be mixed up with normal market volatility there is a far deeper correction in progress now with absolutely no sign of the capitulation phase that would mark its end like we saw in gold prices last week. Gold was up sharply as stocks slumped. Insight to the correlation between monetary policy and investor behavior, with Charles Biderman, TrimTabs Investment Research… |
| Marc Faber smiles as S&P 500 has worst week in two years and gold up 3% Posted: 10 Oct 2014 08:10 PM PDT It was a time to smile for the most trenchant bear Dr Marc Faber with the US stock markets in rapid retreat and his long-time favorite gold up three per cent last week. The publisher of the Gloom, Boom & Doom report, discusses what he sees as the fundamental policy mistake made by global governments and what markets are trying to tell investors. He speaks on ‘In The Loop’… |
| Marshall Swing: It is Time to BUY, BUY, BUY Physical Silver With Every Fiat Dollar You Have! Posted: 10 Oct 2014 04:01 PM PDT What you see on the chart on this past Friday into Sunday/Monday has all the markings of a classic commercial short covering price raid but that is the subject of next week's report after the numbers come out… That $16 handle came and went quickly, did it not? It is still time to BUY, BUY, […] The post Marshall Swing: It is Time to BUY, BUY, BUY Physical Silver With Every Fiat Dollar You Have! appeared first on Silver Doctors. |
| Russell 2000 a Harbinger to come? Posted: 10 Oct 2014 02:32 PM PDT Yesterday I was able to post a chart of the Russell 2000 noting that today's close was going to be a big deal in regards to its overall technical condition. Would the index be able to find enough willing and able buyers near the support zone that has served to hold it for over a year now or would the bears finally be able to break the back of the bulls. I guess that questioned was answered today. Take a look at the extremely poor WEEKLY close on the chart. Note that it fell well below the support zone and in the process confirmed a DOUBLE TOP on the chart. (note that the blog is having problems posting charts right now so I will have to get that up later. Not sure what is up with that. They were having problems earlier this week so it is probably related to that) The question is now what? Here is my read on this. The bulls must immediately, before the end of trading next Friday recapture the broken support zone near and just above 1080 or the bears will have them. Downside - there is some light support near 1040 that might spark some short covering but stronger support does not show up on this chart until closer to the 1000 mark, which I might add is a big psychological number. It also happens to correspond to the 25% Fibonacci retracement level of the entire move off the 2009 low and a band of horizontal support that comes in closer to 1012-1008. Suffice it to say that the close today does not bode well for early next week. The mantra of buying the dip in equities looks like it is going to be tested. One quick thing and I am done for just now as this has been one of the busiest days I have experienced in some time what with a MAJOR USDA Supply and Demand report for the Grains, ( and the livestock markets I might add), as well as some wild swings in wheat, etc. I will get some stuff up about these later on as my schedule permits. For now, I am also noting that once again, gold was saved by its safe haven status as the metal began recovering from its worst levels by the swooning equity markets and the bonds which once again SOARED higher as money went rushing into US Treasuries. Also, right on time, as if clockwork, the Yen scooted higher as more of the risk trades were taken off and that particular carry trade was unwound. The Euro however did not fare so well as once again it was "let's beat the snot out of the Euro" trade resumed. As said yesterday, FOMC (Central Banks) can only talk up currencies so much or talk them down before fundamentals take over. All the Fed did was give those who were looking for a lower level at which to buy the Dollar or a higher level at which to sell the Euro a huge gift to do just that. Sadly for the bullish cause for gold however, the HUI and the GDXJ continue to go "Kerplunk!" along with the rest of the equity markets. The latter actually held up a bit better than the HUI did as it was down only 1.22% today compared to a loss of 2.44% in the HUI. Both charts are not especially promising; however, at least they remain above the lows made on the FOMC day this week ( Wednesday). Bulls might take some consolation in that but a mere 5 points off a multi-year low is not exactly a lot to crow about right now. That level is going to take on a lot of significance as we move forward. If it fails, another leg lower is coming. Let's hope for the long-suffering bulls that is not the case but with deflationary concerns rapidly rising, it is certainly possible that those lows will not hold. Also, while crude oil was able to bounce somewhat off its overnight lows, near 83.50, it still looks iffy. Gasoline was trounced and beaten with an ugly stick today as it made yet another fresh 4 year low in price. I am quite happy with that to be honest. Cattle rebounded when news of firm cash hit the market which saved the complex from the beating it took earlier but USDA also showed an increase in red meat production for next year and for poultry, something which I have been saying for some time now. What that tells me is that red meat prices are coming down for sure. I had expected beef prices to start coming down by the 4th quarter as well as pork. Beef is holding better than I expected thus far but pork looks like it is beginning to weaken. There is going to be too much competition from pork and poultry in 2015 for it to stay up here in the stratosphere. With the combination of cheaper gasoline and falling red meat prices, it looks like more Bar-b-Q is on the menu at my household once more. Then again, the way things are looking with this cursed Ebola virus, maybe all of us will be scared to death to even venture out of the door so cheap gasoline will not matter much! I will get the grain stuff up later as there is a lot to cover....\ |
| Gold skyrockets as dollar stalls Posted: 10 Oct 2014 01:21 PM PDT The U.S. Comex gold futures shot up 2.72% this week to $1,225.30 on Thursday as the market has realized that the Fed will not raise interest rates any time soon. |
| Precious Metals Getting a Temporary Reprieve Posted: 10 Oct 2014 12:53 PM PDT Gold closed last week below $1200 for the first time but has since rebounded from support at $1180. Silver has also rebounded but only after declining in 11 of the past 12 weeks. Precious Metals endured a very rough September and became very oversold. With Gold near its daily low and the gold miners (HUI, GDX) near their December lows, a rebound was probable. Precious metals bulls need to stay patient and disciplined as we believe this is an oversold bounce in a sharp downtrend until proven otherwise. We plot Gold and Silver in the weekly candle chart below. First, we should note that triple bottoms (in the bullish sense) are extremely rare. Gold does not have the look of a triple bottom or reverse head and shoulders pattern. Over the past 15 months Gold has continued to make lower highs. The most recent high (this summer) indicated greater weakness as it reversed course before reaching trendline resistance. Meanwhile, note that Silver recently brokedown from what appeared to be a triple bottom. Silver has declined in 11 of the past 12 weeks. It could rebound back to previous support in the mid $18s before resuming its downtrend.
Another reason to be skeptical is Gold and Silver have major, multiyear levels of support below current levels. As we noted last week, Gold has its 50% retracement at $1080 while the monthly charts for both metals illustrate the strength of support below $1100 in Gold and at $15 in Silver. The same can be said for the mining stocks. As we pen this, GDXJ has about 11% downside to its December 2013 low. The HUI Gold bugs index has about 12% downside to multiyear support at 168. We also plot the HUI's rolling rate of change over three months and one year.
There is huge upside potential in precious metals but in my view that will come after further downside. I believe we have to be patient and let this bounce take its course before the market embarks on its final decline. I am waiting for the market to test or break downside targets in an oversold state much stronger than at present. I see a potential lifetime buying opportunity emerging in the months ahead. In the meantime, stay solvent and consider learning more about our premium service including a report on our top 5 buys at the coming bottom. Good Luck!
Jordan Roy-Byrne, CMT
The post Precious Metals Getting a Temporary Reprieve appeared first on The Daily Gold. |
| One of the world's best indicators says this essential commodity is headed much higher Posted: 10 Oct 2014 09:57 AM PDT From Tom McClellan’s Chart in Focus:
Last week I pointed out how the Commitment of Traders (COT) Report data for currencies were pointing to a big topping condition for the dollar. That top appears to have arrived, and if the dollar heads downward then that should provide a boost to prices for all sorts of commodities. A similar message comes from the COT data on copper futures, where we find that the commercial (big, smart money) traders are net long in a huge way. That means as a group they are positioned for a big rally in copper prices. They are often early in adopting a big skewed position, but nearly always right in the end. So to summarize, the smart money traders are betting on both a dollar decline, and a copper price rebound. Those two bets are actually the same thing, if we assume that a falling dollar happens, and that it causes commodities prices to rise. From a price standpoint alone, copper has broken out above the declining tops line which dates all the way back to 2011. But that breakout never went anywhere, and copper prices have since retraced back downward to rest upon the top side of that broken trendline. Pulling back to test a broken resistance agent like that is actually fairly typical behavior, and ultimately bullish as long as the declining tops line now holds as a support agent. With the commercial traders already at a huge net long position, it is more difficult for the bearish forces to break down through any significant support agent. Instead, copper is likely to move upward from here, with that rally fueled by the short-covering of the speculators who have been shorting it, and fueled as well by the unwinding of the dollar’s blowoff top. Other metals should presumably move higher as well. |


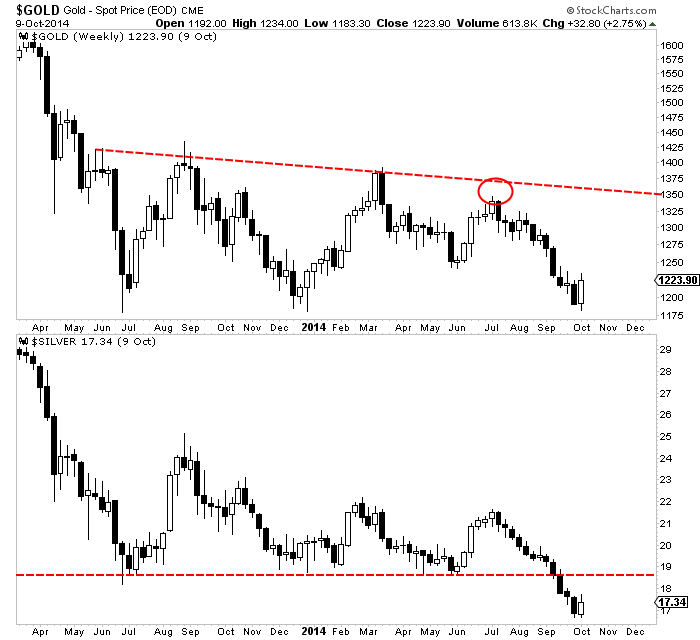
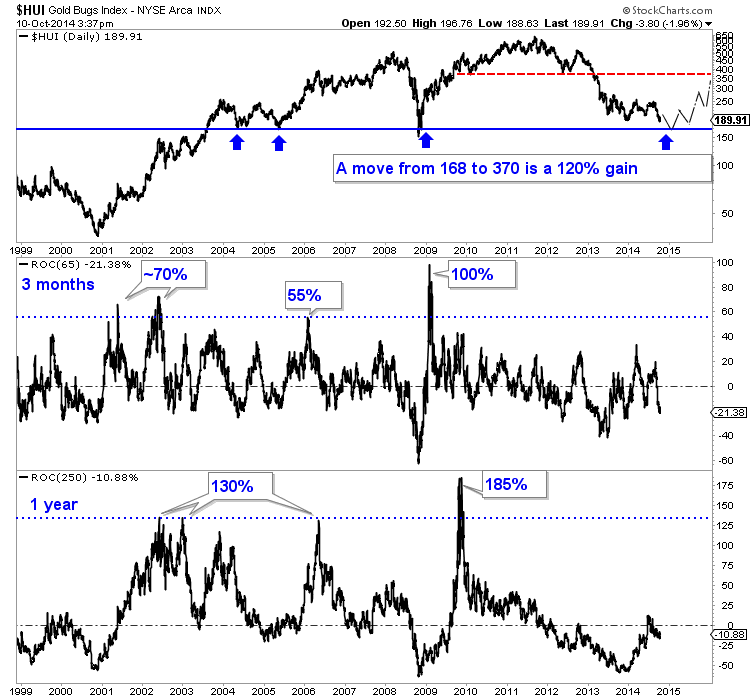

| You are subscribed to email updates from Gold World News Flash 2 To stop receiving these emails, you may unsubscribe now. | Email delivery powered by Google |
| Google Inc., 20 West Kinzie, Chicago IL USA 60610 | |
No comments:
Post a Comment