


Gold World News Flash |
- So central bank gold is being held in investment bank vaults
- All that is gold does not glitter…
- The Gold Price Gained $6.30 to $1,290.50 Ending the February Correction
- Has the Stock Market S&P Topped At Exactly The Same Price As Gold?
- Introducing the Altyn: Russia Accelerates Plans to Launch New “Gold” Eurasian Currency
- Watch As China Is Swept Under The Worst Sandstorm In 18 Years
- Guest Post: Demography + Debt = Doom
- The Gold Price Gained $6.30 to $1,290.50 Ending the February Correction
- Koos Jansen: Russia, Belarus, and Kazakhstan plan Eurasian currency union
- U.S. Exports A Record Amount Of Gold To Hong Kong In January
- Superstar FX Trader Whiz-kid Nothing But A Superspending Ponzi Fraud
- Bold Predictions from the Bubble Crowd
- Precious Metals Set V-Bottom At Key Support Level
- Has The S&P 500 Topped At Exactly The Same Price As Gold?
- Gold Daily and Silver Weekly Charts - Option Expiration Hi-Jinks - Jan Skoyles On Gold
- Gold Daily and Silver Weekly Charts - Option Expiration Hi-Jinks - Jan Skoyles On Gold
- This Will Cause A Massive & Historic Spike In Gold & Silver
- The Price Floor That’s Key to Gold Mining Profits
- Comex plans to get in on Asian gold trade, Reuters says
- Inside Good Delivery Gold Refining
- Inside Good Delivery Gold Refining
- Gold Mining: Where Did New Discoveries Go?
- Gold Mining: Where Did New Discoveries Go?
- Gold Is Personal, Not Geopolitical
- Gold Is Personal, Not Geopolitical
- Police State Rising To Control The People During The Economic Collapse
- Silver $50: Three Years After the "Shortage"
- CME plans to launch physically settled Asia gold futures – sources
- Two-faced Goldman appears to hedge bets on gold stocks and bullion
- ‘Avoid the bears’ driving gold below fundamentals – Roth Cap
- Illegal mining booms below South Africa’s city of gold
- Gold Prices Surge, Reverse Sharp Drop on Russia-Ukraine News & Comex Options Expiry
- Me Again
- Putin’s Secret Weapon – How Russia Could Take Down America Without Firing a Single Shot - Video
- Fastest Drop in Gold Prices of 2014 on Spike in US Comex Trade as "Tech Energy" Boosts Stocks
- Commodities Investing "Back to Normal" as Another Bank Quits
- Commodities Investing "Back to Normal" as Another Bank Quits
| So central bank gold is being held in investment bank vaults Posted: 25 Apr 2014 12:30 AM PDT by Chris Powell, GATA:
Dear Friend of GATA and Gold: Today’s Reuters report about changes at the gold and currency trading desks of investment banks, which was called to your attention in a dispatch a little while ago – http://www.reuters.com/article/2014/04/22/banks-gold-forex-idUSL6N0NE3K9… – is notable for more than its acknowledgment that central banks are surreptitiously trading gold every day, an acknowledgement made last September by the Banque de France: http://www.gata.org/node/13373 For in reporting that “banks that serve central banking customers with large bullion reserves to manage will have a greater need to offer gold trading and storage services,” Reuters also has acknowledged that much central bank gold is now held outside central bank vaults. | ||||||||||||||||||||||||||||||||||||||||||||||||||||
| All that is gold does not glitter… Posted: 24 Apr 2014 11:12 PM PDT A poem for today | ||||||||||||||||||||||||||||||||||||||||||||||||||||
| The Gold Price Gained $6.30 to $1,290.50 Ending the February Correction Posted: 24 Apr 2014 09:32 PM PDT
The GOLD PRICE gained $6.30 to $1,290.50 while silver added 25.2 cents to 1968.2c. These numbers tell no tale without their ranges. The SILVER PRICE today a little before 8:30 a.m. New York time spiked to a low at 1896.8c, fulfilling that 1900c target. It tarried but an hour, then shot clean up to 1980c by 11:30, and remained the rest of the day above 1960c. Not only does this fulfill my awaited target, yea, it also makes the first half of a key reversal (break to new low with a higher close for the day). All that is needed now is a close tomorrow higher than today's. The GOLD PRICE followed the same pattern, with an early low at $1,268.90. That's a new low for this move, and close enough to the $1,270 target to fit. Add to that a higher close for the day, a rebound of $22.50, and you'll begin to savor the strength. Tomorrow both silver and gold prices need to close higher to confirm those key reversals, but I reckon they will. That's it, waiting's over. That should be the bottom of the correction that began after the February high. Okay, y'all listen up now. Most days nothing much happens. The world spins on about like it always has, and markets nudge a little one way or the other. Here's a surprise: Dow Jones Industrial Average closed today unchanged at 16,501.65, something that only rarely occurs. Today's range was wider, top and bottom, than yesterday's, but the Dow gained nought. S&P500 rose 3.22 (0.17%) to 1,878.61. Although the S&P500 rose, it bumpeth only against its top trading channel line, and breaketh not out. Nasdaq Comp looketh none too perky, but did manage to close above its 20 day moving average. Yea, but look, gaze steadily, stare at the Dow measured in metals. Dow in gold dropped 0.24% to 12.76 oz (G$263.77 gold dollars), not a great change from yesterday but baby step by baby step painting out a double top and probable reversal. Lo, the Dow in Silver sank 1.6% to 838.16 oz (S$1,083.68 silver dollars). Did the top for this move occur yesterday? Needs confirming, but the full stochastics turned down yesterday, along with the MACD. Meanwhile, in the Cloud-Cuckoo Land of fiat national currencies, the US dollar index begins to look like a loser. Mark, it hath tried now thrice to pierce its 50 and 20 DMAs overhead, and hath failed each time. Looks like a SELL, but then, it's looked that way since 1934. Dollar index lost 8 basis points (0.1%) to 79.87. Euro gained 0.8% to $1.3828, and although above its 20 DMA, remains in a downtrend, like a mountebank in a moth-eaten tuxedo. Japanese Yen (is there some other yen?) gained 0.23% to 97.77 cents per 100 yen, but still looks ugly as five miles of bad gravel road. Aurum et argentum comparenda sunt -- -- Gold and silver must be bought. - Franklin Sanders, The Moneychanger The-MoneyChanger.com © 2014, The Moneychanger. May not be republished in any form, including electronically, without our express permission. To avoid confusion, please remember that the comments above have a very short time horizon. Always invest with the primary trend. Gold's primary trend is up, targeting at least $3,130.00; silver's primary is up targeting 16:1 gold/silver ratio or $195.66; stocks' primary trend is down, targeting Dow under 2,900 and worth only one ounce of gold or 18 ounces of silver. or 18 ounces of silver. US $ and US$-denominated assets, primary trend down; real estate bubble has burst, primary trend down. WARNING AND DISCLAIMER. Be advised and warned: Do NOT use these commentaries to trade futures contracts. I don't intend them for that or write them with that short term trading outlook. I write them for long-term investors in physical metals. Take them as entertainment, but not as a timing service for futures. NOR do I recommend investing in gold or silver Exchange Trade Funds (ETFs). Those are NOT physical metal and I fear one day one or another may go up in smoke. Unless you can breathe smoke, stay away. Call me paranoid, but the surviving rabbit is wary of traps. NOR do I recommend trading futures options or other leveraged paper gold and silver products. These are not for the inexperienced. NOR do I recommend buying gold and silver on margin or with debt. What DO I recommend? Physical gold and silver coins and bars in your own hands. One final warning: NEVER insert a 747 Jumbo Jet up your nose. | ||||||||||||||||||||||||||||||||||||||||||||||||||||
| Has the Stock Market S&P Topped At Exactly The Same Price As Gold? Posted: 24 Apr 2014 09:11 PM PDT Chances are high that the S&P500 is in the process of making a huge top. We will discuss our rationale in this article, based on the gold to equities ratio, as well as current market conditions. The extremely interesting fact is that spot gold has topped at exactly the same level as the S&P500 top (to date, on a closing basis). Compare the following data: | ||||||||||||||||||||||||||||||||||||||||||||||||||||
| Introducing the Altyn: Russia Accelerates Plans to Launch New “Gold” Eurasian Currency Posted: 24 Apr 2014 09:07 PM PDT from Silver Doctors:
Russia's economy is eight times smaller than the US, but by forming a new 'empire' on top of a vast amounts of resources, this economic block will be a serious threat for the US petrodollar. Russia is now speaking openly about getting rid of the US dollar for trading energy, building its own payment system and closing gas export deals with China – the other Asian empire. The Eurasian Economic Union will be a powerful stab at the US dollar hegemony. By the way, the meaning of the Turkish word "Altyn" is… gold. | ||||||||||||||||||||||||||||||||||||||||||||||||||||
| Watch As China Is Swept Under The Worst Sandstorm In 18 Years Posted: 24 Apr 2014 07:51 PM PDT Some worry about the quality of the drinking water in China, others fear the choking smog of the cities, still more are concerned about the inevitable collapse of their real-estate bubble; but none of these compare to the Gansu Province (in the Northwest of China) strongest sandstorm since at least 1996 that turned day into night Wednesday afternoon.
Of course, the US has its share of sandstorms - here is Phoneix in 2011... | ||||||||||||||||||||||||||||||||||||||||||||||||||||
| Guest Post: Demography + Debt = Doom Posted: 24 Apr 2014 06:07 PM PDT Originally posted at Gerold's blog, A ‘Perfect Storm’ of demography and debt will economically and financially doom almost every country on earth. It will be TEOTWAWKI – ‘The End Of The World As We Know It’. No, it’s not the end of life or even the end of civilization. However, when it’s all over, nothing will ever be the same and that includes the disappearance of much of the middle class. On the other hand, as Jesse of ‘Le Cafe Americain’ writes “there is nothing we are facing or are likely to face, outside of an all out nuclear war, that was not faced by our fathers and grandfathers who faced two World Wars and a Great Depression in between.” Although nuclear war is highly unlikely, the alternatives are not very enticing prospects. First, the good news. The storm won’t last forever. In fact, it may end sooner than many think. And, when it’s finished, life for many may be better than today’s slow economic strangulation, at least for those who stop self-medicating with their boob-tubes, Tweets, iGadgets and self-aggrandizing social media long enough to pay some serious attention and try to understand what’s happening. The bad news is there will be much more pain before it ends unless you make an effort to understand what’s happening and why. Only then will you know how to protect yourself and loved ones from the storm. Otherwise, you risk becoming just another poor, nameless statistic. That would be both tragic and unnecessary because you can do things to prepare and avoid the worst of it. Keep reading. This is a long article, but what’s your life worth? Stupid Government Governments and their handmaidens, the ass media, are trying to convince a dumbed-down, gullible public that we are recovering from the Global Financial Crisis; that they know what they’re doing and they can be trusted. Don’t believe it. Those neo-Keynesian idiots haven’t a clue what they’re doing and they can’t be trusted to run a lemonade stand let alone look out for your best interests. Here’s but one of numerous articles titled, “Economic Bounceback Anticipated for 2014”. First, never trust forecasts. Second, it predicts happy days just as soon as the weather gets better. The Amerikan administration used to blame Bush, but that got stale so now it’s the weather’s fault. And, when that too, gets lame, rest assured they’ll dream up another excuse. The chart below tries to spin a U.S. housing recovery. It’s titled, “Housing Starts Dip in January, Level off in February”. That so-called ‘leveling off’ is the tiny horizontal blue line on the extreme right of the chart. It’s so small it’s almost hidden by the red ‘averaging’ line.
Click chart to enlarge Now cast your eye over the last 14 years back to 2000 and see how low today’s U.S. housing starts are compared to the last 14 years. So, who ya gonna believe; that bullshit headline or your own lyin’ eyes? Such is the ass media’s utter contempt for the public that they think we’re gullible enough to believe the crap they fling at us. Furthermore, what little recovery there is in U.S. real estate is Wall Street snapping up homes to turn them into rental units. Some housing recovery! Canada’s real estate bubble hasn’t burst yet, but it’s coming. Financial crises take a long time to play out and recover. How long? MoneyNews reports “The weakness of the recovery stems in part from the usual lingering hangover from financial crises, according to research by Harvard’s Reinhart and Rogoff. Their research shows that it takes a decade to fully heal … A decade is a long time. But a long time is not the same as forever.” It also depends on how stupid governments are. As a political science major who has watched events unfold for many decades, I can assure you that no creature on earth is as stupid as a meddling government although unions come in a close second. (Disclosure: I once was a union member.) Governments’ brainless bureaucrats lack the balls to proactively prevent problems because that would entail sticking their heads out and risk getting them chopped off. So, instead, they wait for problems to arise. Governments are reactive not proactive. Furthermore, instead of determining the root cause of a problem (usually the government itself through its moronic meddling) they, instead, try to solve the results of a problem rather than the problem itself. You can fix problems; you cannot fix the results of a problem without creating ever more problems. I’m also trained in the 6 Sigma continuous improvement program. One of the most powerful weapons in 6 Sigma’s ‘tool kit’ is DMAIC, an acronym that stand for Determine, Measure, Analyze, Improve and Control. With DMAIC, data and statistics are used to (first step) ‘Determine’ the root cause of a problem through measurement and analysis. Once the root cause is determined (admittedly easier said than done) only then can a process be improved. Like any recipe, if you don’t follow the steps in the right order, the results are disastrous just as baking a cake’s ingredients before mixing them will produce a mess, not a cake. Governments’ brainless bureaucrats cannot understand this. They jump to conclusions about the cause of a problem and they almost always try to fix results. This inevitably creates more problems for the government to pretend to fix and to justify their existence. As I said, you cannot fix results. You can only fix problems and you cannot fix a problem if you don’t first determine its root cause. For example, unemployment is a problem, isn’t it? No, actually, it’s not. Unemployment is the result of a problem so there is no ‘solution’ to unemployment unless the root cause of unemployment is determined and ‘Improved’. President Obama recently launched the “Skills for America’s Future” program to “improve industry partnerships with community colleges and build a nation-wide network to maximize workforce development strategies, job training programs, and job placement.” That sounds wonderful. However, contrary to popular belief, governments do not create jobs. Government meddling and over-regulation destroys jobs. What’s the point of training people for jobs that have been moved overseas? Well-paying jobs in manufacturing have been replaced with low-wage McJobs. The chart below shows low-wage jobs replacing mid-wage and high-wage jobs.
Notice above how most of the jobs lost are in the mid-range. The chart below shows how much high-wage U.S. manufacturing has declined since 1980.
Again, the problem is not unemployment; the problem is lack of well-paying jobs caused by outsourcing and by corporations’ short-sighted fixation on short-term profits thereby destroying their own customer base. In other words, more training won’t fix the jobs ‘problem’. Problems Getting Worse Inept governments have done nothing to fix the issues that created the Great Financial Crisis and the resulting recession. My previous article demonstrated we are overdue for another recession. This is also confirmed by Yahoo! as well as the National Bureau of Economic Research (NBER) and various other articles. Since the problems that caused the last recession have gotten worse, the next recession will be more…painful than the last one despite so-called GDP growth. For instance, the Too-Big-to-Fail banks have gotten larger than before thereby putting them at greater risk. National Review reports that since the year 2000, there are 29% more big U.S. banks and 24% fewer small ones as shown by the chart below.
Not only are banks larger, but world-wide most banks, including central banks too, are insolvent (bankrupt) and starting to panic. Another indication of a slowdown is the closing of so many retail stores. Even MacDonald’s is feeling the pain. In addition, inflation, especially in food, is getting worse which will further impact cash-strapped consumers. I’ve outlined numerous other problems that have been ignored rather than solved in many previous articles so there’s no point repeating them ad nauseum. . It’s the Debt, Stupid The single, major global problem is too much debt. Much of the commentary and analysis I read is misguided. Everyone’s talking about the consequences (results) of the problem yet few understand that the elephant in the room is too much debt. Global debt has passed the $100 trillion mark, an increase of $30 trillion since 2007. To put this into perspective, global GDP is slightly more than $70 trillion. Here’s another perspective; global debt is 137% of global GDP. This is far beyond the 90% mark demonstrated by Rogoff and Reinhart (despite a few minor formula errors) as ‘beyond-the-point-of-no-return’. The last Great Recession triggered by the Global Financial Crisis was caused by too much debt – private debt, government debt, corporate debt, Sesame Street debt, all kinds of debt – we have debt up the yin yang and it keeps growing. The chart below shows that today’s mountainous debt level makes the debt prior to the last Great Depression look like a molehill. The debt/credit excesses of the 1920’s led up to the stock market Crash of 1929 and the Great Depression that followed. Can there be any doubt where today’s enormous debt level is leading?
Some of Aubie Baultin’s comments on the chart above are instructive: “By 1982, with the memory of the 1930s Depression almost completely faded, policy makers once again began to “stimulate” the economy with borrowed dollars. By the mid-1990s we had exceeded the excesses of 1929 both in terms of the total amount of debt and in terms of stock prices.” “As of 2014; there is currently 30% more debt worldwide than at the last peak in 2007 and we are experiencing one of the weakest recoveries of all time.” “The bubble is much bigger than in 1929, [when] we as a people were much more self- sufficient and so the economic destruction will be worse damaging to the individual than in the 1930s!” “We may have engineered a very anemic recovery and new highs in the stock market, but we haven’t solved the underlying problem of too much debt. Rather, we have made it much, much worse and that’s not even mentioning Derivatives in the Quadrillions.” “When the boom ends, the accumulated debts do not.” “A year before the 1929 crash, interest rates started rising while commodity prices fell indicating a risk of deflation – or collapse in prices. The same scenario is true today.” “[China is] are probably in the worst trouble of all, as they discover that their Socialist Capitalism must still follow the Economic laws …” “There isn’t a snowball’s chance in Hell that we will be spared the consequences of our leaders’ incompetence and corruption.” I’ve already covered government’s incredible incompetence, but the corruption is all the new debt that has benefited the banksters and their cronies, but not the people. It has enriched Wall Street by impoverishing Main Street. Worse, as headlined by Washington’s blog, “By Choosing The Big Banks Over The Little Guy, The Government Is Dooming BOTH.” He further headlines “The Elite Financial Players Are Manipulating the Game So that They Get the Stimulus … and the Little Guy Gets the Austerity.” Do you think this will ever stop? Dream on. The great ‘Vampire Squid’ will suck every drop of blood out of the system that it can. To protect yourself you must ‘Get Out of The System’ or GOTS as Jim Sinclair says. Here is his GOTS checklist for those with wealth to protect. It’s not easy but the more you remain in the system, the more vulnerable you are to further losses, bail-ins and pension confiscation. . The Power of Demography Demography (sometimes called demographics) is the statistical study of human population dynamics over time or space. The characteristics of a population include size, structure, density, distribution of the population and the changes resulting from birth, migration, aging, and death. Demographics is as powerful as it sounds and it has enormous predictive abilities. One of the most powerful demographic cohorts in recent times has been the Baby Boom generation. Michael Snyder writes &ldqu | ||||||||||||||||||||||||||||||||||||||||||||||||||||
| The Gold Price Gained $6.30 to $1,290.50 Ending the February Correction Posted: 24 Apr 2014 05:23 PM PDT
The GOLD PRICE gained $6.30 to $1,290.50 while silver added 25.2 cents to 1968.2c. These numbers tell no tale without their ranges. The SILVER PRICE today a little before 8:30 a.m. New York time spiked to a low at 1896.8c, fulfilling that 1900c target. It tarried but an hour, then shot clean up to 1980c by 11:30, and remained the rest of the day above 1960c. Not only does this fulfill my awaited target, yea, it also makes the first half of a key reversal (break to new low with a higher close for the day). All that is needed now is a close tomorrow higher than today's. The GOLD PRICE followed the same pattern, with an early low at $1,268.90. That's a new low for this move, and close enough to the $1,270 target to fit. Add to that a higher close for the day, a rebound of $22.50, and you'll begin to savor the strength. Tomorrow both silver and gold prices need to close higher to confirm those key reversals, but I reckon they will. That's it, waiting's over. That should be the bottom of the correction that began after the February high. Okay, y'all listen up now. Most days nothing much happens. The world spins on about like it always has, and markets nudge a little one way or the other. Here's a surprise: Dow Jones Industrial Average closed today unchanged at 16,501.65, something that only rarely occurs. Today's range was wider, top and bottom, than yesterday's, but the Dow gained nought. S&P500 rose 3.22 (0.17%) to 1,878.61. Although the S&P500 rose, it bumpeth only against its top trading channel line, and breaketh not out. Nasdaq Comp looketh none too perky, but did manage to close above its 20 day moving average. Yea, but look, gaze steadily, stare at the Dow measured in metals. Dow in gold dropped 0.24% to 12.76 oz (G$263.77 gold dollars), not a great change from yesterday but baby step by baby step painting out a double top and probable reversal. Lo, the Dow in Silver sank 1.6% to 838.16 oz (S$1,083.68 silver dollars). Did the top for this move occur yesterday? Needs confirming, but the full stochastics turned down yesterday, along with the MACD. Meanwhile, in the Cloud-Cuckoo Land of fiat national currencies, the US dollar index begins to look like a loser. Mark, it hath tried now thrice to pierce its 50 and 20 DMAs overhead, and hath failed each time. Looks like a SELL, but then, it's looked that way since 1934. Dollar index lost 8 basis points (0.1%) to 79.87. Euro gained 0.8% to $1.3828, and although above its 20 DMA, remains in a downtrend, like a mountebank in a moth-eaten tuxedo. Japanese Yen (is there some other yen?) gained 0.23% to 97.77 cents per 100 yen, but still looks ugly as five miles of bad gravel road. Aurum et argentum comparenda sunt -- -- Gold and silver must be bought. - Franklin Sanders, The Moneychanger The-MoneyChanger.com © 2014, The Moneychanger. May not be republished in any form, including electronically, without our express permission. To avoid confusion, please remember that the comments above have a very short time horizon. Always invest with the primary trend. Gold's primary trend is up, targeting at least $3,130.00; silver's primary is up targeting 16:1 gold/silver ratio or $195.66; stocks' primary trend is down, targeting Dow under 2,900 and worth only one ounce of gold or 18 ounces of silver. or 18 ounces of silver. US $ and US$-denominated assets, primary trend down; real estate bubble has burst, primary trend down. WARNING AND DISCLAIMER. Be advised and warned: Do NOT use these commentaries to trade futures contracts. I don't intend them for that or write them with that short term trading outlook. I write them for long-term investors in physical metals. Take them as entertainment, but not as a timing service for futures. NOR do I recommend investing in gold or silver Exchange Trade Funds (ETFs). Those are NOT physical metal and I fear one day one or another may go up in smoke. Unless you can breathe smoke, stay away. Call me paranoid, but the surviving rabbit is wary of traps. NOR do I recommend trading futures options or other leveraged paper gold and silver products. These are not for the inexperienced. NOR do I recommend buying gold and silver on margin or with debt. What DO I recommend? Physical gold and silver coins and bars in your own hands. One final warning: NEVER insert a 747 Jumbo Jet up your nose. | ||||||||||||||||||||||||||||||||||||||||||||||||||||
| Koos Jansen: Russia, Belarus, and Kazakhstan plan Eurasian currency union Posted: 24 Apr 2014 05:14 PM PDT 8:12p ET Thursday, April 24, 2014 Dear Friend of GATA and Gold: Gold researcher and GATA consultant Koos Jansen tonight reports on plans by Russia, Belarus, and Kazakhstan to form an economic and currency union: http://www.ingoldwetrust.ch/forming-of-eurasian-economic-union-and-joint... CHRIS POWELL, Secretary/Treasurer ADVERTISEMENT Jim Sinclair to hold gold market seminar in Toronto on April 26 Mining entrepreneur and gold advocate Jim Sinclair's next gold market seminar will be held from 1 to 5 p.m. Saturday, April 26, at the Pearson Hotel & Conference Centre at Toronto's Pearson International Airport, 240 Belfield Road, Toronto. For details on tickets, please visit Sinclair's Internet site, JSMineSet.com, here: http://www.jsmineset.com/2014/04/01/toronto-qa-session-announced/ Join GATA here: Porter Stansberry Natural Resources Conference Committee for Monetary Research and Education http://www.cmre.org/news/spring-meeting-2014/ Canadian Investor Conference 2014 http://cambridgehouse.com/event/25/canadian-investor-conference-2014-inc... New Orleans Investment Conference https://jeffersoncompanies.com/new-orleans-investment-conference/home * * * Support GATA by purchasing DVDs of our London conference in August 2011 or our Dawson City conference in August 2006: http://www.goldrush21.com/order.html Or by purchasing a colorful GATA T-shirt: Or a colorful poster of GATA's full-page ad in The Wall Street Journal on January 31, 2009: http://gata.org/node/wallstreetjournal Help keep GATA going GATA is a civil rights and educational organization based in the United States and tax-exempt under the U.S. Internal Revenue Code. Its e-mail dispatches are free, and you can subscribe at: To contribute to GATA, please visit: | ||||||||||||||||||||||||||||||||||||||||||||||||||||
| U.S. Exports A Record Amount Of Gold To Hong Kong In January Posted: 24 Apr 2014 05:03 PM PDT Submitted by SRSrocco via SRSrocco Report blog, The figures are out and it looks like the United States exported a record amount of gold to Hong Kong in January. Not only was this a one month record… it was a WHOPPER indeed. Last year, the U.S. exported a total of 215 metric tons of gold bullion to Hong Kong. This was not the total amount of gold exported to Hong Kong as some smaller quantities of Dore’ and precipitates made their way into the country as well. However, Hong Kong received more gold than any other country… Switzerland came in second at 150 metric tons. The table below shows the breakdown in U.S. Gold Bullion exports in 2013:
Here we can see that the highest month of gold bullion exports to Hong Kong in 2013 was in August at 30.7 metric tons (mt)… let’s just say an even 31 mt. According to the data just released by the USGS, the United States exported a stunning 57 mt of gold bullion to Hong Kong in January.
Not only is this 3 times more gold exported than January 2013 (17 mt), it was 84% more gold than the record month set in August (31 mt). As we can see, gold bullion is fleeing the U.S. and heading to the East. Again.. that 57 mt figure is just gold bullion. Furthermore, total gold exports in January nearly surpassed the total hit in March of last year. Total U.S. gold exports in March, 2013 were 80.8 mt compared to 80.7 mt in January of this year. This is where the majority of the remaining gold was exported in January: Gold Bullion: Australia 3.1 mt, Thailand 2 mt, Switzerland 1.5 mt & Singapore 1.0 mt Dore’ & precipitates: Switzerland 10.6 mt, India 2.7 mt & United Arab Emirates 1.4 mt As the West continues to play games with Monopoly money and Derivatives manufacturing, the East accumulates as much gold as it possibly can. While Main Stream Media and its Banker cohorts release bearish $1,050 price targets for gold, the Asians and Indians smile as they build the largest amount of gold stocks in the world. I get a real kick at the degree of negative sentiment coming from many gold and silver investors. Who said this was going to be easy? It’s simply amazing to watch a DIEHARD gold or silver bug become bearish and downright nasty now that times are tough. However, this is exactly what the FIAT MONETARY AUTHORITIES hand in mind. Unfortunately, many have fallen for their plan… HOOK, LINE & SINKER.
Source: USGS January Gold Mineral Industry study: | ||||||||||||||||||||||||||||||||||||||||||||||||||||
| Superstar FX Trader Whiz-kid Nothing But A Superspending Ponzi Fraud Posted: 24 Apr 2014 04:08 PM PDT Who can forget the amazing story of Alex Hope which was all the rage two years ago? Actually considering how short reader, institutional and certainly vacuum tube memories have become, perhaps everyone. So here is a reminder.
And the obligatory shot of a pensive trader next to many screens with his thumb on his chin, which is supposed to give him more credibility:
Actually, as it turns out, Alex' "success" had little if anything to do with the perversion and idiocy of what Bernanke and central-planning crew have done to the capital markets (which do their best to encourage daily trading perfection by such specimens as Virtu algos, Bank of America's Calcutta trading desk and the E*trade baby), and everything to do with a certain Italian who arrived in the US in 1903, only to take the world of financial criminals, Keynesians and central bankers by storm: one Carlo Pietro Giovanni Guglielmo Tebaldo Ponzi. Because as it turns out young master Hope, who struck the proverbial gold at the tender age of 23, was nothing more than the latest Ponzi schemer whose only success in life was finding the absolute, and quite rich, idiots who believed his lies. Well, that, and being able to transform himself from a catering manager working at Wembley Stadium into an FX trader.... even if a fake, criminal and absolutely terrible FX trader. Daily Mail reports:
So, nothing more than a young apprentice of the likes of Bernie Madoff and Ben Bernanke. But who can blame him? Here's a before picture:
and after:
Because obviously all it takes to fool rich, easily-swayed idiots is a guy chugging hundreds of thousands of dollars in booze and hanging out with bobos. No, really:
And so on. But his most impressive success? "Hope got through £2million in the 13 months before his arrest in early 2012." That somehow between PR clips, photo shoots, and hypnotizing new clients with his unambiguous "charm and likability", he managed to blow through over $3 million in just over a year is truly a commendable achievement, all else being equal. | ||||||||||||||||||||||||||||||||||||||||||||||||||||
| Bold Predictions from the Bubble Crowd Posted: 24 Apr 2014 03:02 PM PDT Uhhh… What happened? Judging by the headlines in mainstream financial media when we woke up, we were supposed to get an enormous rally after fabulous numbers last night from Apple and Facebook. The tech-heavy Nasdaq popped more than 1% on the open. But as we write, it’s barely in the green. The Dow and the S&P are likewise flat. “Today’s action is a huge tell,” reads an email from Greg Guenthner of our trading desk. “Nasdaq futures were up 50 points before the bell. Gold was down big. “Thirty minutes later, momentum stocks were selling off hard (again). Facebook was red. Gold soared close to $1,300. There’s a hint of panic under the surface. “Get out the meat grinder. The psychological damage inflicted by falling momentum and tech names has clearly spooked investors. I think we head lower into the summer.” The more interesting story everyone’s ignoring is this: The bear cases for Apple and Facebook collapsed with last night’s releases. Apple’s best days are supposed to be behind it: Steve Jobs is no longer around. Shorter term, Apple’s iPhone push into China is supposed to fall flat on its face: There aren’t enough Chinese with enough disposable income to buy iPhones when they can buy cheaper domestic or Korean models. Whoops: Apple has now reversed a two-year slowdown in iPhone sales. “Here’s why China is moving the needle now for Apple,” explains Agora Financial investment director Paul Mampilly: “This is the first quarter where they were selling the iPhone in cahoots with China’s biggest mobile phone service — China Mobile (CHL). You see, the Chinese market works a bit like the U.S. market, where people buy their phones and wireless service at the same time.” No, there’s no breakthrough product on the horizon that’ll get people to line up around the block. “But in the meantime,” says Paul, “the company is doing stuff that makes its investors happy.” The stock split announced yesterday means “if you own one share of Apple today, you’ll have seven sitting in your account when the split is complete. But remember that a stock split does not change the value of the Apple shares you own. You can think about it like splitting a single pizza. You can split a pizza into five, seven or 10 slices, but it’s still one pizza.” Doesn’t hurt that Apple is raising its dividend 8% and buying back another $30 billion in stock — which it can afford with $151 billion cash in the bank. “Apple is still a very cheap stock paying a 2.5% dividend,” says Paul. “It’s still growing about 20% a year based on Wall Street analysts’ estimates, and you buy all that for a price-earnings ratio of 11. Not too shabby.” And Facebook? “Facebook does what television used to do,” Paul explained in yesterday’s Daily Reckoning — it delivers eyeballs to advertisers. “The big difference is that the content is created by the users, and it’s created by the users for FREE.” The knock on Facebook went like this: As Internet use transitions from computers to mobile devices, people will have less tolerance for ads hogging the smaller amount of real estate on a smartphone screen. And they definitely won’t put up with video ads that count against their monthly data limits. Whoops again: “Facebook,” says Paul, “reported that 59% of its revenue comes from a mobile-based 1.23 billion users. This is up from nearly zero at the time of its IPO in May 2012. “Overall, Facebook grew its sales by 72% in the first quarter. And if you annualize its sales from this quarter, it’s going to have $10 billion in sales for 2014. Facebook made $642 million for the quarter, or 193% more than last year. “Facebook is a very fast-growing, highly profitable company. I wouldn’t call it a cheap stock. But my experience is that when stocks are growing as fast as Facebook is growing right now, you’ll never get a chance to buy it really cheap. That was true for Microsoft and Cisco and Oracle in the 1990s. And I believe the same thing is happening with Facebook.” One more reality check about the “new tech bubble.” If you’ve seen buzz about it lately, that’s because hedge fund guru David Einhorn — the guy who made a fortune shorting Lehman Bros. in 2008 — recently declared, “We are witnessing our second tech bubble in 15 years.” One of the factors he cited was that investors and analysts are tossing aside traditional valuation methods — the same way they did when they said earnings didn’t matter in 1999. Money manager and uber-blogger Barry Ritholtz begs to differ, and he passes along this chart of the Nasdaq 100′s price-earnings ratio. “It speaks for itself,” he says…
“David Einhorn is a very astute trader and an insightful fund manager,” Mr. Ritholtz avers. “He is a smart guy, and I only rarely find myself in disagreement with him. But when it comes to the declaration of an echo tech bubble, I am on the other side of the argument.” Regards, Dave Gonigam Ed. Note: Whether you believe we’re in the midst of another tech bubble, or that it’s just a solid bull market in tech stocks, you’ll want to make sure you’re prepared for whatever the market decides to throw at you next. Sign up for the 5 Min. Forecast, right here, and learn how you can gain exclusive access to the best investment advice the market has to offer. | ||||||||||||||||||||||||||||||||||||||||||||||||||||
| Precious Metals Set V-Bottom At Key Support Level Posted: 24 Apr 2014 02:58 PM PDT The precious metals have had a very choppy day, with the triggering of downside stops resulting in sharp falls in gold, silver, platinum and palladium. All of the metals have since stabilised and recovered, though palladium is the only metal actually trading higher on the day.  gold, silver, platinum, palladium price on April 24th 2014
The PGMs remain dominated by the ongoing talks between South African miners and the AMCU. As a sign of the impact that the strikes are having on supply, Anglo American's Amplats division reported a 39% y/y drop in production in Q1-14, with Amplats producing 357koz compared to 583koz in Q1-13. Palladium meanwhile continues to garner support from further ETF inflows, with Palladium ETFs adding 52.9koz yesterday to reach a record 2.5Moz. Palladium prices have continued to push higher following the weakness seen at the beginning of the week, with prices climbing back above $790/oz. Gold broke below key technical support at $1,276, with the picture still looking resolutely bearish. Silver is meanwhile also under pressure but is receiving some technical support around $18.90 and is recovering into the afternoon. | ||||||||||||||||||||||||||||||||||||||||||||||||||||
| Has The S&P 500 Topped At Exactly The Same Price As Gold? Posted: 24 Apr 2014 01:56 PM PDT Chances are high that the S&P500 is in the process of making a huge top. We will discuss our rationale in this article, based on the gold to equities ratio, as well as current market conditions. The extremely interesting fact is that spot gold has topped at exactly the same level as the S&P500 top (to date, on a closing basis). Compare the following data:
The following chart shows both assets over the last three years. Chart courtesy: Stockcharts.  Gold to S&P 500 ratio from 2011 to 2014 Both assets have traded visibly inversely correlated since mid-2011:
The following chart shows looks at the gold to S&P 500 ratio in the last 100 years. Note that the red arrows and blue ovals are own additions. Chart courtesy: Macrotrends.  Gold to S&P 500 ratio from 1914 to 2014 The last three years are marked in the blue oval at the right. One of the following two statements must be true:
The second scenario would be a replay of the 70ies. Back then, the secular uptrend in gold corrected significantly and equities experienced a cyclical uptrend. As the chart points out, the cyclical trends lasted for three years. We cannot exclude the first scenario indicated above. However, we estimate the probability to be very low, in the range of 5% to 15%, based on the "set of circumstances" we see in equities and in the economy. Of course, the fact that the S&P 500 and gold have reached the same (price) level and is merely a chart observation. It does not tell anything as such. The more important point is the set of underlying market conditions. In that respect, we currently observe conditions which, in our belief, confirm the chart observation. The "set of circumstances" we discuss in the remainder of the article are related to the equities market, in particular the US, but also the broader economic context and even the monetary system. First, US equities are rising for 5 years now. Technically, the current bull market is +270 days old. This is the second longest bull run in the last 80 years, being beaten by the bull run which started in October 1990 with a duration of 406 days. Source: Standard & Poors. Second, based on the Crestmont P/E ratio, the S&P Composite is trading at very high levels, only beaten twice in the last +100 years, i.e. in 1929 and 2000. Third, margin debt in US equities is at all time highs. SeekingAlpha released an article which explains that "margin debt at the New York Stock Exchange rose to an all-time high of about $465.72 billion in February from its previous record high of about $451.30 billion in January. There is a strong positive correlation between NYSE margin debt and SPY." Although the equities bull run is currently still intact, at least from a technical perspective, the risk of speculation is getting higher as well. The more speculation, the sharper the inevitable correction. Fourth, IPO fever has popped up again, in a similar fashion as during the highs of the dot com era. According to Sentimentrader, the share of money losing IPO's (i.e., IPO's with negative earnings) stands at a remarkable 83%. This is just a hair’s breadth away from the all-time record from mid-March 2000, when 84% of the companies that insiders were selling to the public could not prove their business models. Fifth, according to ShortSideOfLong, in the last 140 years, there have only been 7 prior events where markets gave investors returns in excess of 100% over 5 years. The chart below shows that 6 out of the 7 instances have led to serious corrections or outright crashes, while the one in 1956 lead to only a mild pull back. The chart also shows that equity market trends with 1.5 standard deviations above the 140 year historical mostly mark an intermediate or long term top. "The market has only ever traded at these overextended levels 8.6% of the time or 143 months in the last 140 years (with the outright majority of that during the late 1990s tech bubble)." It is very likely that the run into 2014 is going to produce another major decline.
Sixth, the following chart shows that the average small investor portfolio has a 70% allocation to stocks, a level. Although not visible on the chart, the remaining capital is evenly allocated to bonds and cash. Zero interest rate policy (ZIRP) inflates capital to risk assets, leading to asset inflation. Participation of small investors typically peaks at the end stages of a bull run.  investor allocation to stocks : 1987 to 2014 In the broader economic context, we observe some worrisome facts. Leverage in the financial system is at all time highs. As we noted earlier, "Global derivatives have a notional value of around $700 trillion (latest official BIS data from mid 2013), the highest point historically." We believe this has the potential to accelerate a downward move in whatever asset class. In that respect, we believe that the crash of precious metals in April 2013 was a shot across the bow in increasingly distorted markets, courtesy of the central bankers' policies of this world. Other asset classes will follow with the same vengeance. Meantime, the debt bubble is growing bigger, especially in the US, Japan and China. A credit crisis seems to lure around the corner. The Chinese credit bubble is showing signs of cracking. The housing market in the US is propped up mostly by speculators (think Blackrock) while the real owners of houses account for a minority in the "housing recovery" of the last years. A credit induced economic recession would be similar to the 2008 collapse. The most worrisome fact, however, lies in the monetary system. On the one hand, the central bank narrative is showing signs of cracks. As we all know, a narrative is extremely powerful … until it stops working. The insight that central bank stimulus does not contribute to productive effects in the real economy but only leads to specific asset price inflation, is spreading around. Increasingly, data out of Japan and the US underpin this insight. On the other hand, of higher importance in our view, is the cracking dollar reserve currency. It is widely accepted that the US has enjoyed an exceptional privilege having a world reserve currency. The US has been able to grow its debt mountain to a level never seen before in history of mankind because it had a universally accepted currency which was used in the most traded asset classes, in particular oil (the petrodollar). However, the end of the dollar reserve currency seems to be imminent. Based on historical standards, world reserve currencies have lived on average 27 years. Note that the current dollar hegemony is ongoing for 43 years. Prior threats to the petrodollar have been laughed away by the use of military force. The Ukrainian case, however, has the potential to become a pivot point. Clumsy sanctions against Russia by the West point to retaliation right to the core of the monetary system: the petrodollar. Russia is about to sign energy contracts with its major trading partners in non-dollar currencies. We believe this will act as a precedent, and several Asian and emerging countries will follow. It will result in a loss of trust in dollar denominated assets, undoubtedly affecting US equities. Needless to say, this should also be a major catalyst for precious metals. In the short run, we do not exclude that equities could go higher. However, several factors confirm the longer term view. We see a three double top forming, a huge trading range which is lasting 2 months (very unusual since the bull run of November 2012), and a huge distribution in the RSI and market breadth. Again, it is the combination of all circumstances described in this article, as well as the point of maturation of each, that confirm a major decline in US and European equities is very close. One could argue that the stock market will climb a wall of worry. However, that is what has been going on for five years now, and any historical standard shows that its duration is already stretched. | ||||||||||||||||||||||||||||||||||||||||||||||||||||
| Gold Daily and Silver Weekly Charts - Option Expiration Hi-Jinks - Jan Skoyles On Gold Posted: 24 Apr 2014 01:18 PM PDT | ||||||||||||||||||||||||||||||||||||||||||||||||||||
| Gold Daily and Silver Weekly Charts - Option Expiration Hi-Jinks - Jan Skoyles On Gold Posted: 24 Apr 2014 01:18 PM PDT | ||||||||||||||||||||||||||||||||||||||||||||||||||||
| This Will Cause A Massive & Historic Spike In Gold & Silver Posted: 24 Apr 2014 01:01 PM PDT  Today one of the legends in the business spoke with King World News about what he believes is going to cause a massive and historic spike in gold and silver. Keith Barron, who consults with major companies around the world and is responsible for one of the largest gold discoveries in the last quarter century, also discussed the massive demand we are seeing for gold from China as well as other countries. Today one of the legends in the business spoke with King World News about what he believes is going to cause a massive and historic spike in gold and silver. Keith Barron, who consults with major companies around the world and is responsible for one of the largest gold discoveries in the last quarter century, also discussed the massive demand we are seeing for gold from China as well as other countries.This posting includes an audio/video/photo media file: Download Now | ||||||||||||||||||||||||||||||||||||||||||||||||||||
| The Price Floor That’s Key to Gold Mining Profits Posted: 24 Apr 2014 12:50 PM PDT Chocolate milk isn't my ice-cold beverage of choice. But the "brown milk" holds an important lesson for us in the gold market — as you'll see. Chocolate milk, however, is my 11-year-old nephew's favorite — and lemme tell you, that boy can put away some chocolate milk! Recently, we were hanging out drinking our brown milk, and when the taste hit my lips, I instantly teleported through the wormhole to the last time I had a chocolate milk — back in grade school. It's amazing what a once-forgone taste or smell can do to you. Ah, I remember the good old days of school lunch. Sitting at a table with friends, getting a break from the drone of teachers and generally living the easy life! Heck, I even had an affinity for the school menu. Frankly, I don't know why school lunch got such a bum rap. I loved it — every day was different. You could mix and match your pizza or steak sub with a pretzel or apple — and of course, you got the choice of regular or chocolate milk. Mmm. Mmm. Mmm. …lunch prices in Baltimore County have surged 87% in just 16 years! Plus, 16 years ago, my last soiree of school lunchdom, you could get all of that for just $1.60. That's when I turned to my nephew and asked, "Hey, how much is school lunch these days?" "Three dollars," he said. Holy cow. Three bucks? I was incredulous. Sure, three bucks is a steal for a normal, outside-of-school lunch. But comparing apples to apples, that means lunch prices in Baltimore County have surged 87% in just 16 years! That's insane. It also brings us back to the topic of today's article — no, not chocolate milk — I'm talking about gold! According to the U.S. inflation calculator, the rate of inflation over the past 16 years was a "mere" 44.9% — which accounts for about half of the 87% surge in prices. I guess the other reason for increased prices comes down to local/state/federal bureaucracy or just good old shadow inflation. That being said, a 45% drop in your purchasing power in 16 years is the hefty cost of holding U.S. dollars. That's a losing bet if I ever saw one — and it's written plain as day on the government's CPI inflation calculator. But had you paid for the same school lunch in gold, the price wouldn't have risen at all. In fact, it would have dropped. That's the lesson we can learn from a small carton of chocolate milk. (And I shouldn't need to remind you that the same buffoons that allow 45% inflation in 16 years not only affect the price of school lunch but could also have an impact your Social Security checks. Ugh.) Needless to say, gold should still be a part of your investment philosophy. And today there's reason to believe gold is still a worthy place to stash some cash — particularly the miners look appealing. And — shocker alert — in case you haven't noticed, Janet Yellen is a strong dose of the same medicine at the U.S. Federal Reserve. The same inflationary forces at work for years are continuing to play a large role going forward. That is, the Fed is spinning cash and holding interest rates low to try to goose the economy. To an extent, it's working, too! It's amazing how that works, right? Apparently, when you increase the money supply at an alarming pace and stomp interest rates to the curb, the prices for stocks, houses and everything else seem to rise. The great inflation continues! Not to mention, at the rate the government is spending (think Obamacare, ever-rising Social Security benefits, out-of-control congressional spending, etc.) the only way to pay back all of these greenbacks is to print 'em. All said and done, you and I can count on the status quo at the U.S. Fed for months and years to come. All of this inflation — and the same force that jabs the price of chocolate milk higher — is going to support the gold market. So even though right now it seems like the price of gold and gold miners are walking on ice, rest assured that there will be demand for the "once and future money"! From my perch, we've found a sturdy floor for gold prices above $1,200. Whether that support is based on inflation, money supply, supply/demand or any other fundamental factor is still up for debate. But looking at the chart, I'm confident saying it'll take a large force to push gold below $1,200 and keep it there. Take a look at the all-important three-year chart for gold:
I say that this chart is all-important because it tells the tale of the short- to medium-term gold market. After hitting a high of $1,900, gold prices marched lower and continued to fall until we found support at $1,200. That is, twice since mid-2013, gold prices tried to push below $1,200, and twice, prices sharply rebounded. The second time this happened, in December 2013, we can consider this "confirmation" of that price support level. By no coincidence, once the $1,200 price support was confirmed in December, miners got a boost. I've shared this opinion before in these pages. The reason that miners caught a bid was simple: Up until that point, analysts simply couldn't get a good read on where the price of gold was heading. Without a reliable commodity price, it was impossible for anyone to grade a miner. But with price support at $1,200, the calculators start humming. All things considered, I like gold miners here. I think the price of gold will stay above $1,200, and well-run miners can turn a profit. Regards, Matt Insley Ed. Note: Today, April 24th, was the day most people thought China would officially release its gold numbers. Well, most people thought wrong. If you were subscribed to the FREE Daily Reckoning email edition, you would’ve read all about it. Not to mention, you’d have gotten the real story why China’s hoarding gold. If you’re not subscribed to receive the DR by email each day, you’re tuning out 50% of the actionable ideas we don’t post here on our site. You should fix that. Click here now to subscribe for free, right way. | ||||||||||||||||||||||||||||||||||||||||||||||||||||
| Comex plans to get in on Asian gold trade, Reuters says Posted: 24 Apr 2014 11:34 AM PDT CME Plans to Launch Physically Settled Asia Gold Futures, Sources Say By A. Ananthalakshmi and Frank Tang CME Group Inc. plans to launch a physically deliverable gold futures contract in Asia, three sources familiar with the matter said, as the world's No.1 futures exchange targets rising hedging and investor demand in the top gold-consuming region. An Asian contract from CME could help set a pricing reference for gold futures in Asia, much like its U.S. Comex gold contract sets the benchmark for bullion futures globally. The move may also help CME boost flagging revenues from its precious metals futures and comes as its rivals are expanding their presence in Asia to tap demand from China, the world's biggest consumer of commodities, including gold. ... ... For the full story: http://www.reuters.com/article/2014/04/24/cme-gold-asia-idUSL3N0NF2D3201... ADVERTISEMENT Buy metals at GoldMoney and enjoy international storage GoldMoney was established in 2001 by James and Geoff Turk and is safeguarding more than $1.7 billion in metals and currencies. Buy gold, silver, platinum, and palladium from GoldMoney over the Internet and store them in vaults in Canada, Hong Kong, Singapore, Switzerland, and the United Kingdom, taking advantage of GoldMoney's low storage rates, among the most competitive in the industry. GoldMoney also offers delivery of 100-gram and 1-kilogram gold bars and 1-kilogram silver bars. To learn more, please visit: http://www.goldmoney.com/?gmrefcode=gata Join GATA here: Porter Stansberry Natural Resources Conference Committee for Monetary Research and Education http://www.cmre.org/news/spring-meeting-2014/ Canadian Investor Conference 2014 http://cambridgehouse.com/event/25/canadian-investor-conference-2014-inc... New Orleans Investment Conference https://jeffersoncompanies.com/new-orleans-investment-conference/home * * * Support GATA by purchasing DVDs of our London conference in August 2011 or our Dawson City conference in August 2006: http://www.goldrush21.com/order.html Or by purchasing a colorful GATA T-shirt: Or a colorful poster of GATA's full-page ad in The Wall Street Journal on January 31, 2009: http://gata.org/node/wallstreetjournal Help keep GATA going GATA is a civil rights and educational organization based in the United States and tax-exempt under the U.S. Internal Revenue Code. Its e-mail dispatches are free, and you can subscribe at: To contribute to GATA, please visit: ADVERTISEMENT Silver mining stock report for 2014 comes with 1-ounce silver round Future Money Trends is offering a special 18-page silver mining stock report about how to profit with the monetary and industrial metal in 2014, and it comes with a free 1-ounce silver round. Proceeds from the report's sales are shared with the Gold Anti-Trust Action Committee to support its efforts to expose manipulation in the monetary metals markets. To learn about this report, please visit: | ||||||||||||||||||||||||||||||||||||||||||||||||||||
| Inside Good Delivery Gold Refining Posted: 24 Apr 2014 10:48 AM PDT Gold refining insights from Good Delivery accredited OPM Metals... CONOR DULLAGHAN is executive vice president of Elemetal and president of OPM Metals (Ohio Precious Metals), the US-owned refiner of London Good Delivery gold bullion bars and a major supplier of silver bars to the US market. This week he joined me on New York Markets Live to talk about where the gold and silver refining business is right now, and the challenges it faces both from volatile prices and growing regulatory over-sight of precious metals production. "We've had to work harder and dig in to win market share," said Conor Dullaghan. "We developed a new process to produce certified 100% recycled gold and silver, and conflict-free products through the supply chain." More Finance Podcasts at Blog Talk Radio with New York Markets Live on BlogTalkRadio Accepted to the London Bullion Market Association's prestigious Good Delivery list for gold bar production in December 2013, OPM Metals employs 250 people in a 168,000 square foot facility in Jackson Ohio. Most crucially in the competitive world of precious metals refining, OPM seeks to be a leader in adopting sustainable business practices. On this week's show I asked Conor about changes in the refining industry and how the dip in gold price is impacting the industry. He explained how OPM maintains certifications from some of the world's most respected authorities on humane and environmental processes and manufacturing practices. Dullaghan himself holds several patents in precious metals processes, publishing many papers and with his work cited hundreds of times. Conor Dullaghan received his BSc (Hons) in Science with Business from the University of Ulster, Northern Ireland, and then his PhD in chemistry from Brown University in 1998. He has worked at Lucent Technologies and Metalor Technologies, prior to joining OPM in September 2011. Mr.Dullaghan has been involved in many other aspects of the precious metals business, including R&D, sales and marketing and general management. Speaking to me this week, he also discusses the process by which customers come to the OPM facility in Ohio to have precious metals refined, assessed, shipped or stored in vaults. Hear the full 30-minute interview here. | ||||||||||||||||||||||||||||||||||||||||||||||||||||
| Inside Good Delivery Gold Refining Posted: 24 Apr 2014 10:48 AM PDT Gold refining insights from Good Delivery accredited OPM Metals... CONOR DULLAGHAN is executive vice president of Elemetal and president of OPM Metals (Ohio Precious Metals), the US-owned refiner of London Good Delivery gold bullion bars and a major supplier of silver bars to the US market. This week he joined me on New York Markets Live to talk about where the gold and silver refining business is right now, and the challenges it faces both from volatile prices and growing regulatory over-sight of precious metals production. "We've had to work harder and dig in to win market share," said Conor Dullaghan. "We developed a new process to produce certified 100% recycled gold and silver, and conflict-free products through the supply chain." More Finance Podcasts at Blog Talk Radio with New York Markets Live on BlogTalkRadio Accepted to the London Bullion Market Association's prestigious Good Delivery list for gold bar production in December 2013, OPM Metals employs 250 people in a 168,000 square foot facility in Jackson Ohio. Most crucially in the competitive world of precious metals refining, OPM seeks to be a leader in adopting sustainable business practices. On this week's show I asked Conor about changes in the refining industry and how the dip in gold price is impacting the industry. He explained how OPM maintains certifications from some of the world's most respected authorities on humane and environmental processes and manufacturing practices. Dullaghan himself holds several patents in precious metals processes, publishing many papers and with his work cited hundreds of times. Conor Dullaghan received his BSc (Hons) in Science with Business from the University of Ulster, Northern Ireland, and then his PhD in chemistry from Brown University in 1998. He has worked at Lucent Technologies and Metalor Technologies, prior to joining OPM in September 2011. Mr.Dullaghan has been involved in many other aspects of the precious metals business, including R&D, sales and marketing and general management. Speaking to me this week, he also discusses the process by which customers come to the OPM facility in Ohio to have precious metals refined, assessed, shipped or stored in vaults. Hear the full 30-minute interview here. | ||||||||||||||||||||||||||||||||||||||||||||||||||||
| Gold Mining: Where Did New Discoveries Go? Posted: 24 Apr 2014 10:27 AM PDT High spending is over. But not even that boom found very much gold to be mined... AS GOLD prices boomed during the last decade, writes Henry Bonner of Sprott Global in Addison Wiggin's Daily Reckoning, small explorers and big miners spent billions of shareholder Dollars seeking new deposits. Investors wanted the high rewards of a discovery as metals soared in price. At $1900 per ounce of gold, even mediocre finds could make money. Richard Schodde, of MinEx Consulting, has studied past exploration cycles in detail. He says we are seeing a tightening of the sector, as the availability of capital has plummeted. Costs of exploration are coming down as companies cut back on high-salaried employees and reduce operating costs. The following chart from MinEx shows exploration expenditures rising quickly during the boom years... 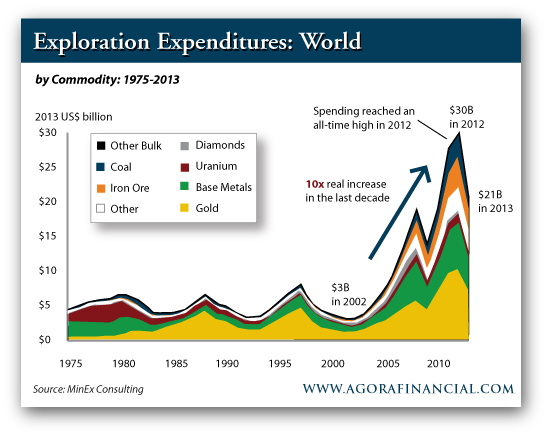 The amount of money spent exploring rose during the last decade from $2.9 in 2002 to $29.4 billion in 2012, before falling back to $21 billion in 2013 says Mr. Schodde. Over the time-frame 2002-12 $136 billion was spent world-wide on non-bulk exploration, resulting in 647 significant new discoveries, of which only 18 are considered to be 'top tier'. Despite a 10-fold increase in the amount of money spent on exploration over the last decade, the amount of new discoveries was relatively unchanged – meaning that more money was spent per new discovery. Mr. Schodde explains that as more money went into the sector, expenses related to exploring went up. Geologists and engineers demanded higher salaries. Drilling equipment and operators became more expensive, and money was spent liberally on general and administrative expenses. As an ebullient market sentiment took hold, money was also wasted on projects with negligible odds of success or likelihood of development and often incompetent management. So despite high expenditures of capital, the pace of discoveries remained relatively tame. Mr. Schodde notes that today, salaries and G&A expenses have come down since 2012, and he believes that this trend will continue as capital remains scarce. Adding to the challenge, finding new deposits will become much tougher for the exploration industry, he says, because most 'easy-to-find' deposits have already been discovered. Explorers will have to drill deeper in known mineral-rich locations, such as Western Australia, or look in problematic jurisdictions, such as Central Africa. Making discoveries should become more costly for these reasons. Already, new discoveries are barely keeping pace with depletion, says Mr. Schodde. As he explains, only about half of new decently-sized deposits will later become a mine. Depending on the commodity and location it will take 10-15 years on average for a discovery to become a mine. So we must discover about twice as much metal today as we will be using in a decade from now in order to maintain supply. Looking ahead to expected production rates in 2020, gold is being discovered at 1.5 times the expected depletion rate. New copper deposits are being discovered at 1.7 times the projected consumption rate in 2020, which is also below the 'replacement rate' for the metal. The exploration sector is contracting – spending less money and pursuing fewer projects – and is being forced to be more efficient, Mr. Schodde explains. While exploration expenses have come down, the need for new deposits is strong. The exploration industry will need to make more new discoveries, despite decreasing capital available, or the supply of mined metals is likely to decline in coming years. | ||||||||||||||||||||||||||||||||||||||||||||||||||||
| Gold Mining: Where Did New Discoveries Go? Posted: 24 Apr 2014 10:27 AM PDT High spending is over. But not even that boom found very much gold to be mined... AS GOLD prices boomed during the last decade, writes Henry Bonner of Sprott Global in Addison Wiggin's Daily Reckoning, small explorers and big miners spent billions of shareholder Dollars seeking new deposits. Investors wanted the high rewards of a discovery as metals soared in price. At $1900 per ounce of gold, even mediocre finds could make money. Richard Schodde, of MinEx Consulting, has studied past exploration cycles in detail. He says we are seeing a tightening of the sector, as the availability of capital has plummeted. Costs of exploration are coming down as companies cut back on high-salaried employees and reduce operating costs. The following chart from MinEx shows exploration expenditures rising quickly during the boom years... The amount of money spent exploring rose during the last decade from $2.9 in 2002 to $29.4 billion in 2012, before falling back to $21 billion in 2013 says Mr. Schodde. Over the time-frame 2002-12 $136 billion was spent world-wide on non-bulk exploration, resulting in 647 significant new discoveries, of which only 18 are considered to be 'top tier'. Despite a 10-fold increase in the amount of money spent on exploration over the last decade, the amount of new discoveries was relatively unchanged – meaning that more money was spent per new discovery. Mr. Schodde explains that as more money went into the sector, expenses related to exploring went up. Geologists and engineers demanded higher salaries. Drilling equipment and operators became more expensive, and money was spent liberally on general and administrative expenses. As an ebullient market sentiment took hold, money was also wasted on projects with negligible odds of success or likelihood of development and often incompetent management. So despite high expenditures of capital, the pace of discoveries remained relatively tame. Mr. Schodde notes that today, salaries and G&A expenses have come down since 2012, and he believes that this trend will continue as capital remains scarce. Adding to the challenge, finding new deposits will become much tougher for the exploration industry, he says, because most 'easy-to-find' deposits have already been discovered. Explorers will have to drill deeper in known mineral-rich locations, such as Western Australia, or look in problematic jurisdictions, such as Central Africa. Making discoveries should become more costly for these reasons. Already, new discoveries are barely keeping pace with depletion, says Mr. Schodde. As he explains, only about half of new decently-sized deposits will later become a mine. Depending on the commodity and location it will take 10-15 years on average for a discovery to become a mine. So we must discover about twice as much metal today as we will be using in a decade from now in order to maintain supply. Looking ahead to expected production rates in 2020, gold is being discovered at 1.5 times the expected depletion rate. New copper deposits are being discovered at 1.7 times the projected consumption rate in 2020, which is also below the 'replacement rate' for the metal. The exploration sector is contracting – spending less money and pursuing fewer projects – and is being forced to be more efficient, Mr. Schodde explains. While exploration expenses have come down, the need for new deposits is strong. The exploration industry will need to make more new discoveries, despite decreasing capital available, or the supply of mined metals is likely to decline in coming years. | ||||||||||||||||||||||||||||||||||||||||||||||||||||
| Gold Is Personal, Not Geopolitical Posted: 24 Apr 2014 10:05 AM PDT Why the Ukraine crisis shouldn't lead your gold investment thinking... JEFF CLARK is senior precious metals analyst at Casey Research. Son of an award-winning gold panner, Clark also works his family's placer claims in California, Nevada and Arizona. Here he speaks with Hard Assets Investor's managing editor Sumit Roy about the latest developments in the gold market... HardAssetsInvestor: What's your view on the recent stock market pullback and how does it relate to gold? Jeff Clark: Generally speaking, gold has an inverse relationship to the stock market, meaning when one goes up the other tends to fall. One of the strongest inverse relationships gold has is with the Dollar; gold has about an 80% inverse relationship to the direction of the US Dollar. And for the stock market, it's about 60 to 70%, depending on what time frame you're looking at. So if the stock market is trending down, gold has about a 60 to 70% chance of trending up. And that makes sense when you think about it: A lower stock market usually means trouble in some part of the economy or the world, which is supportive for the gold price. The relationship doesn't work every time, but it does tell us that gold investors don't necessarily need to fear a decline in the stock market. The exception to that would be if the broader stock market experienced a big crash. If we were to see another 2008 or another 1929, gold is going to get hit. Gold stocks will take it on the chin as well. The way to look at it is this: The sharper or more sudden the sell-off in the stock market, the more likely gold will fall as well. At this point, most news going forward will probably be negative for the stock market, which would be good for the gold price. But if the market surprises and goes higher, that means the economy is actually getting better – and that would lead to higher inflation, sooner or later. That, of course, would be good for gold as well. In the big picture, though, investors shouldn't base their decisions on whether or not to buy or sell gold on what they think the stock market might do. Gold is an alternate currency – it's hard money, a hedge against the massive currency abuse that's still ongoing after six years. That makes gold a must-own asset right now, regardless of your outlook for the stock market. HAI: The situation between Russia and Ukraine is still tense. Is that a factor that investors in precious metals should pay attention to? Jeff Clark: If you're a buyer of bullion and you're holding gold for all the fundamental reasons that one should be holding it for, then no. This is probably a short-term phenomenon, and if the situation resolves, we could even see a pullback in the gold price. Obviously, if the situation worsens – if someone fires a shot or a bomb is dropped, that would be a major escalation and would definitely push gold higher. But again, that's not why we buy it. We buy gold for personal crisis protection. We buy it because inflation may hit; or deflation, or the Dollar loses its reserve currency status, or because all that printed money comes home to roost, or because our staggering debt levels finally break the system. All these things could impact our personal standard of living, and that's why we buy gold, not because of how the conflict between Russia and Ukraine may or may not resolve. HAI: I know you have a lot to say about inflation, but according to the official government statistics, inflation isn't something we've had to worry about over the last couple of years. Do you see that changing this year or any time in the near future? Jeff Clark: Yes. First of all, inflation is higher than what the consumer price index [CPI] reports. Most people know that the calculation for the CPI has been changed dozens of times since 1980, and if you used that 1980 formula to calculate inflation today, it would be much higher than the current rate. That said, I do think the CPI, as it's currently configured, will measure higher inflation rates some time in the near future. I wish I knew the timing, but when it happens, the fallout could be ugly. It could be potentially catastrophic for people who aren't prepared for it. The losers in that environment will be bondholders, and the winners will be gold holders. Many people have been lulled into a sense that money printing doesn't lead to inflation. But I don't believe in free lunches, and so I think there will be consequences to the government's interventions. And when those consequences pick up steam, I want to be holding gold. HAI: Do you see any parallels between what's going in gold today and what happened in the '70s and '80s? Jeff Clark: There are some similarities and there are some differences, but the price comparison is very interesting. Gold bottomed in 1976 after selling off for about two years. Today we declined for a little over two years – not quite as much percentagewise, but the time span has been longer. From its 1976 low to its 1980 high, silver gained almost 1,200%, and gold gained over 720% in the same time frame. If you were to apply the same percentage gains and the same time frames to the 2013 lows, silver would hit $240 by the summer of 2017, and gold would hit over $9,700 in November 2016. Now I'm not saying we'll see those exact prices in those exact time frames. My point is that that is the kind of reaction gold and silver had after a big bear market and in a similar environment to today where there's concern about currencies and inflation. If inflation does hit, it would catch a lot of people off guard, and I would thus not be surprised to see that kind of movement in the gold price. HAI: So just because gold has moved down over the last two years doesn't mean the bull market is over... Jeff Clark: You can measure bull markets and bear markets however you want. Some say we're in a bear market and that's fine, though I would call it more of a down cycle. And the reason I say that is because the fundamental reasons to buy gold simply haven't gone away. They've actually gotten stronger. Regardless of the terminology, the fact remains that all the catalysts and reasons to hold gold are still there. And in fact, they're greater today than when gold hit $1921 an ounce in 2011. HAI: You recently wrote a very interesting piece about seasonality in the gold market and when it might be the best time to buy. Can you tell us a little bit about that? Jeff Clark: We found some interesting things about seasonality. We looked at all the monthly data on the gold price going back to 1975 – when it was made legal again in the US – and there was one month where gold was historically, on average, down every time regardless of the environment – bull market, bear market, flat market or even a mania. And that month was March. In every environment, March was the only month the gold price fell consistently. The other months that gold typically falls – and I say "typically" meaning roughly two-thirds of the time – are June and October. The best month historically has been September. And the best seasonal time of the year has been September to February. So we've been advising our readers to gain full exposure by this August. But regardless of seasonality, I think by this time next year, prices will be sustainably higher. So whether seasonality applies this year or not, now is the time to buy while prices are low. This applies to silver as well. HAI: Speaking of that, what is your price outlook for gold and silver for this year or into next year? Jeff Clark: We don't make short- or even long-term price predictions. As an organization, we really like to play the fundamental factors we see working in our favor. But let's look at it this way… if you glanced at annual charts of the gold price since 1975, what becomes clear is that 2013 was an anomaly. The only other time we saw that kind of dramatic sell-off was in the 1975-1976 period. We didn't even do that in 1980, when gold sold off dramatically after the mania, as the price ended the year higher than where it started. So to me, 2013 was an anomaly in terms of what happened to the price from the beginning of the year to the end. On one hand, that means the odds are very low that we'd see a second-consecutive anomaly this year. On the other hand, given the size of that decline, it will take some time to recover. So I see 2014 as the year of recovery, meaning I don't expect big gains this year. But neither do I expect another crash, as it's my opinion the bottom is in. By 2015, I think we'll clearly see the formation of a new bull market, one that will draw the attention of the mainstream again. And by 2016, you could see some dramatic gains, and maybe even a mania by 2017. So my outlook is not to buy gold because it's going higher in 10 years; my view is to buy gold because it's going much higher in the two- to four-year timeframe. | ||||||||||||||||||||||||||||||||||||||||||||||||||||
| Gold Is Personal, Not Geopolitical Posted: 24 Apr 2014 10:05 AM PDT Why the Ukraine crisis shouldn't lead your gold investment thinking... JEFF CLARK is senior precious metals analyst at Casey Research. Son of an award-winning gold panner, Clark also works his family's placer claims in California, Nevada and Arizona. Here he speaks with Hard Assets Investor's managing editor Sumit Roy about the latest developments in the gold market... HardAssetsInvestor: What's your view on the recent stock market pullback and how does it relate to gold? Jeff Clark: Generally speaking, gold has an inverse relationship to the stock market, meaning when one goes up the other tends to fall. One of the strongest inverse relationships gold has is with the Dollar; gold has about an 80% inverse relationship to the direction of the US Dollar. And for the stock market, it's about 60 to 70%, depending on what time frame you're looking at. So if the stock market is trending down, gold has about a 60 to 70% chance of trending up. And that makes sense when you think about it: A lower stock market usually means trouble in some part of the economy or the world, which is supportive for the gold price. The relationship doesn't work every time, but it does tell us that gold investors don't necessarily need to fear a decline in the stock market. The exception to that would be if the broader stock market experienced a big crash. If we were to see another 2008 or another 1929, gold is going to get hit. Gold stocks will take it on the chin as well. The way to look at it is this: The sharper or more sudden the sell-off in the stock market, the more likely gold will fall as well. At this point, most news going forward will probably be negative for the stock market, which would be good for the gold price. But if the market surprises and goes higher, that means the economy is actually getting better – and that would lead to higher inflation, sooner or later. That, of course, would be good for gold as well. In the big picture, though, investors shouldn't base their decisions on whether or not to buy or sell gold on what they think the stock market might do. Gold is an alternate currency – it's hard money, a hedge against the massive currency abuse that's still ongoing after six years. That makes gold a must-own asset right now, regardless of your outlook for the stock market. HAI: The situation between Russia and Ukraine is still tense. Is that a factor that investors in precious metals should pay attention to? Jeff Clark: If you're a buyer of bullion and you're holding gold for all the fundamental reasons that one should be holding it for, then no. This is probably a short-term phenomenon, and if the situation resolves, we could even see a pullback in the gold price. Obviously, if the situation worsens – if someone fires a shot or a bomb is dropped, that would be a major escalation and would definitely push gold higher. But again, that's not why we buy it. We buy gold for personal crisis protection. We buy it because inflation may hit; or deflation, or the Dollar loses its reserve currency status, or because all that printed money comes home to roost, or because our staggering debt levels finally break the system. All these things could impact our personal standard of living, and that's why we buy gold, not because of how the conflict between Russia and Ukraine may or may not resolve. HAI: I know you have a lot to say about inflation, but according to the official government statistics, inflation isn't something we've had to worry about over the last couple of years. Do you see that changing this year or any time in the near future? Jeff Clark: Yes. First of all, inflation is higher than what the consumer price index [CPI] reports. Most people know that the calculation for the CPI has been changed dozens of times since 1980, and if you used that 1980 formula to calculate inflation today, it would be much higher than the current rate. That said, I do think the CPI, as it's currently configured, will measure higher inflation rates some time in the near future. I wish I knew the timing, but when it happens, the fallout could be ugly. It could be potentially catastrophic for people who aren't prepared for it. The losers in that environment will be bondholders, and the winners will be gold holders. Many people have been lulled into a sense that money printing doesn't lead to inflation. But I don't believe in free lunches, and so I think there will be consequences to the government's interventions. And when those consequences pick up steam, I want to be holding gold. HAI: Do you see any parallels between what's going in gold today and what happened in the '70s and '80s? Jeff Clark: There are some similarities and there are some differences, but the price comparison is very interesting. Gold bottomed in 1976 after selling off for about two years. Today we declined for a little over two years – not quite as much percentagewise, but the time span has been longer. From its 1976 low to its 1980 high, silver gained almost 1,200%, and gold gained over 720% in the same time frame. If you were to apply the same percentage gains and the same time frames to the 2013 lows, silver would hit $240 by the summer of 2017, and gold would hit over $9,700 in November 2016. Now I'm not saying we'll see those exact prices in those exact time frames. My point is that that is the kind of reaction gold and silver had after a big bear market and in a similar environment to today where there's concern about currencies and inflation. If inflation does hit, it would catch a lot of people off guard, and I would thus not be surprised to see that kind of movement in the gold price. HAI: So just because gold has moved down over the last two years doesn't mean the bull market is over... Jeff Clark: You can measure bull markets and bear markets however you want. Some say we're in a bear market and that's fine, though I would call it more of a down cycle. And the reason I say that is because the fundamental reasons to buy gold simply haven't gone away. They've actually gotten stronger. Regardless of the terminology, the fact remains that all the catalysts and reasons to hold gold are still there. And in fact, they're greater today than when gold hit $1921 an ounce in 2011. HAI: You recently wrote a very interesting piece about seasonality in the gold market and when it might be the best time to buy. Can you tell us a little bit about that? Jeff Clark: We found some interesting things about seasonality. We looked at all the monthly data on the gold price going back to 1975 – when it was made legal again in the US – and there was one month where gold was historically, on average, down every time regardless of the environment – bull market, bear market, flat market or even a mania. And that month was March. In every environment, March was the only month the gold price fell consistently. The other months that gold typically falls – and I say "typically" meaning roughly two-thirds of the time – are June and October. The best month historically has been September. And the best seasonal time of the year has been September to February. So we've been advising our readers to gain full exposure by this August. But regardless of seasonality, I think by this time next year, prices will be sustainably higher. So whether seasonality applies this year or not, now is the time to buy while prices are low. This applies to silver as well. HAI: Speaking of that, what is your price outlook for gold and silver for this year or into next year? Jeff Clark: We don't make short- or even long-term price predictions. As an organization, we really like to play the fundamental factors we see working in our favor. But let's look at it this way… if you glanced at annual charts of the gold price since 1975, what becomes clear is that 2013 was an anomaly. The only other time we saw that kind of dramatic sell-off was in the 1975-1976 period. We didn't even do that in 1980, when gold sold off dramatically after the mania, as the price ended the year higher than where it started. So to me, 2013 was an anomaly in terms of what happened to the price from the beginning of the year to the end. On one hand, that means the odds are very low that we'd see a second-consecutive anomaly this year. On the other hand, given the size of that decline, it will take some time to recover. So I see 2014 as the year of recovery, meaning I don't expect big gains this year. But neither do I expect another crash, as it's my opinion the bottom is in. By 2015, I think we'll clearly see the formation of a new bull market, one that will draw the attention of the mainstream again. And by 2016, you could see some dramatic gains, and maybe even a mania by 2017. So my outlook is not to buy gold because it's going higher in 10 years; my view is to buy gold because it's going much higher in the two- to four-year timeframe. | ||||||||||||||||||||||||||||||||||||||||||||||||||||
| Police State Rising To Control The People During The Economic Collapse Posted: 24 Apr 2014 08:23 AM PDT Spanish, Italian and Greek debt rising to record highs. Caterpillar world wide sales declines again which is an indicator the economies of the world are slowing. New home sales have just imploded, the cause is not the weather. DHS and its agencies are using technology to predict crimes and to seek... [[ This is a content summary only. Visit http://www.GoldSilverNewsBlog.com or http://www.newsbooze.com or http://www.figanews.com for full links, other content, and more! ]] | ||||||||||||||||||||||||||||||||||||||||||||||||||||
| Silver $50: Three Years After the "Shortage" Posted: 24 Apr 2014 08:09 AM PDT Bullion Vault | ||||||||||||||||||||||||||||||||||||||||||||||||||||
| CME plans to launch physically settled Asia gold futures – sources Posted: 24 Apr 2014 08:02 AM PDT Sources familiar with the matter say CME Group plans to launch a physically deliverable gold futures contract in Asia. | ||||||||||||||||||||||||||||||||||||||||||||||||||||
| Two-faced Goldman appears to hedge bets on gold stocks and bullion Posted: 24 Apr 2014 08:02 AM PDT Goldman Sachs equities analysts seem to be at odds over gold and silver from their colleagues covering the commodities sector. | ||||||||||||||||||||||||||||||||||||||||||||||||||||
| ‘Avoid the bears’ driving gold below fundamentals – Roth Cap Posted: 24 Apr 2014 08:02 AM PDT Roth Capital’s Joe Reagor argues for a higher gold price in 2015 and weighs in on gold shorts down to $1,200. | ||||||||||||||||||||||||||||||||||||||||||||||||||||
| Illegal mining booms below South Africa’s city of gold Posted: 24 Apr 2014 08:02 AM PDT The government estimates there are 6,000 illegal miners underground and 8,000 on the surface, equivalent to about 10% of the number of legal employees. | ||||||||||||||||||||||||||||||||||||||||||||||||||||
| Gold Prices Surge, Reverse Sharp Drop on Russia-Ukraine News & Comex Options Expiry Posted: 24 Apr 2014 07:51 AM PDT GOLD PRICES surged 1.7% in 12 minutes Thursday afternoon in London, reversing all the week's previous 2.0% drop on frantic trade in US Comex derivatives as news spread of Russian troops mobilizing near the Ukraine border. European stock markets sank, turning an earlier 1% rise in Germany's Dax into a 1% drop for the day, as rumors hit trading-rooms that Russian president Putin had also called an emergency press conference. The US State Department overnight dismissed Russian foreign minister Lavrov's claim that it is behind the unrest in eastern Ukraine as "ludicrous". Thursday also saw the expiry of US Comex May options in gold, with strong selling interest at $1300 and below. Comex gold futures and options trading via the Globex platform had earlier spiked as prices sank to 12-week lows for Euro and Sterling investors, and fell hard against all major currencies. Sliding 1.1% inside an hour, Dollar gold prices were headed for their worst AM to PM London Fix drop of 2014 so far. But with sellers taking profits on Comex options, gold then rebounded from $1269 per ounce, holding steady in the mid-70s before jumping almost $30 above that level as the Russia-Ukraine rumors broke. Silver extended the drop and bounce in gold prices, surging almost $1 per ounce from its first sub-$19 print since December 2013. "Gold received some support [Weds] from the escalation of the crisis in Ukraine," reckons Lv Jie, analyst in Hangzhou, China for Cinda Futures Co., "[plus] US home sales data" which were much weaker than forecast. "[But] we still think the US is on the road to economic recovery, which will pressure gold lower in the longer term." New US data on Thursday showed orders for durable goods rising well ahead of analyst forecasts in March, but jobless benefits claims for last week were also higher than expected. Next week will still find the US Federal Reserve "highly likely to slow its [QE] asset purchases by another $10bn," says the Financial Times, pointing to strong retail sales, industrial output and monthly jobs data. The Eurozone's central bank, in contrast, will move the other way and "increase meaningfully the degree of monetary accommodation" should inflation across the 18-nation currency union slip further, ECB chief Mario Draghi said in a speech in Amsterdam today. The Euro fell sharply on today's US durable goods release, dropping back towards 2-week lows before rising to unchanged on the day at $1.3820. Crude oil rose 0.7%, and US Treasury bond prices also reversed earlier falls. | ||||||||||||||||||||||||||||||||||||||||||||||||||||
| Posted: 24 Apr 2014 07:40 AM PDT That was quite a rebound for gold, just in the time it took yours truly to get in a morning workout. From down $10+ an ounce to up $5+ an ounce, the current Bloomberg story about the disastrous knock-on effects of (what else?) China gold demand and technical levels being breached to the downside are [...] This posting includes an audio/video/photo media file: Download Now | ||||||||||||||||||||||||||||||||||||||||||||||||||||
| Putin’s Secret Weapon – How Russia Could Take Down America Without Firing a Single Shot - Video Posted: 24 Apr 2014 06:46 AM PDT Here’s a startling fact most investors have never heard: During the last financial meltdown in 2008, when the U.S. economy was on the brink, Russian leaders met with China to persuade them to dump the dollar â€" and destroy the world’s reserve currency. Before they could act, the Fed pumped over $700 billion into the economy and delayed their day of reckoning. Still, the threat remains. China holds over $1.2 trillion in U.S. debt today. And with their Russian allies, they could drop the dollar at any moment. This excerpt from our eye-opening documentary called “Meltdown America†explains the severity of this imminent threat: | ||||||||||||||||||||||||||||||||||||||||||||||||||||
| Fastest Drop in Gold Prices of 2014 on Spike in US Comex Trade as "Tech Energy" Boosts Stocks Posted: 24 Apr 2014 06:21 AM PDT GOLD PRICES dropped to 12-week lows for Euro and Sterling investors on Thursday, falling hard against all major currencies on a spike in US Comex derivatives trade. In US Dollar terms, the London AM Gold Fix came in at $1283.50 per ounce, unchanged from Wednesday's 10.30am level. But then sliding 1.1% inside an hour, Dollar gold prices were headed for their worst AM to PM Fix drop of 2014 so far, briefly falling to the lowest level since 10 February beneath $1270 per ounce. Today sees the expiry of US Comex May options in gold, with strong selling interest set to expire worthless at prices above $1250. Silver bullion, which hit peak of $50 three years ago tomorrow, extended the drop and bounce in gold prices, falling below $19 per ounce for the first time since December 2013 but then halving that 2.7% plunge by the start of New York trade. European stock markets meantime rose, pushing this week's rise in London's FTSE-100 index to 1.5%, as major government bond prices eased lower. "The tech news from Apple and Facebook has given a lot of energy to markets," says one London spread-betting broker's strategist, pointing to Wednesday's analyst-beating results. "Gold received some support [Weds] from the escalation of the crisis in Ukraine," reckons Lv Jie, analyst in Hangzhou, China for Cinda Futures Co., "[plus] US home sales data" which were much weaker than forecast. "[But] we still think the US is on the road to economic recovery, which will pressure gold lower in the longer term." New US data on Thursday showed orders for durable goods rising well ahead of analyst forecasts in March, but jobless benefits claims for last week were also higher than expected. Next week will still find the US Federal Reserve "highly likely to slow its [QE] asset purchases by another $10bn," says the Financial Times, pointing to strong retail sales, industrial output and monthly jobs data. The Eurozone's central bank, in contrast, may move the other way and "increase meaningfully the degree of monetary accommodation" should inflation across the 18-nation currency union slip further, ECB chief Mario Draghi said in a speech in Amsterdam today. The Euro fell sharply on today's US durable goods release, dropping back towards 2-week lows at $1.3790. Asian stockmarkets closed lower, and the Shanghai Gold Exchange's most actively traded contract slipped to end Thursday 60¢ per ounce below London quotes. "There's not much gold buying from China," Reuters quotes a dealer in Hong Kong – the major point of entry for gold imports to the world's No.1 consumer nation. After 2013's record private demand and imports, "People are just waiting for the price to fall," the dealer says, forcing some wholesalers to offer gold at only 80¢ premiums per ounce to London prices, the global benchmark. Here in London on Wednesday, the amount of gold bullion held at HSBC's vaults to back shares in the giant SPDR Gold Trust was unchanged at 3-month lows for the third day running. Reversing the rise in gold ETF holdings of February and March, "That ETF selling has unnerved the market," says Swiss bank and bullion market-maker UBS, "and undoubtedly is one factor dragging on gold in April." | ||||||||||||||||||||||||||||||||||||||||||||||||||||
| Commodities Investing "Back to Normal" as Another Bank Quits Posted: 24 Apr 2014 03:33 AM PDT Barclays exits commodities, clients face rising costs, just as investing returns "diversify portfolio risk" again... COMMODITIES INVESTING is "returning to normal" according to a new report, losing the strong correlation with world stockmarkets seen during and after the global financial crisis just as major banks pull out of the natural resources market. Barclays this week became the fourth global bank to announce it's closing its commodities division, following J.P.Morgan, Morgan Stanley and Deutsche Bank in refocusing activity away from natural resources. Yet for investors, "Commodities are [now] generating stable returns amidst turbulent global capital markets with lower volatility compared to equities and bonds," says a new report from Citigroup Research, a division of the global bank. "This appears to represent a return to normal," Citi's report concludes, with commodities and stockmarket investments moving in different directions, rather than being strongly tied to one another as became the case "especially in the lead up to the financial crisis in 2007-09 and even more so in the immediate aftermath." The exit of major banks from commodities investing was last week cited as a key reason for that falling correlation with stock markets by United Nations' analysts. "The influence of banks and hedge funds on commodities is at its lowest since 2008," said an update from the the UN Conference on Trade and Development (UNCTAD), quoted by Reuters. "As financial investors including banks and hedge funds have reduced their activity in commodities markets in the last two years," it explained, "we've seen a marked drop in the correlation between the returns on the equity markets and the returns on oil and other commodities futures markets." Currently the second-biggest retail bank in the UK, Barclays will retain its precious metals activities, moving its market-making bullion team to its foreign exchange division. But other commodities will go "electronic", with clients offered derivatives and exchange-traded index products. Fellow London bullion market makers Deutsche Bank and J.P.Morgan have also retained their gold and silver trading businesses, although Deutsche is looking to sell its membership of the London Gold Fixing Limited. Barclays currently chairs the twice-daily London Gold Fix. Its 2013 annual report shows that, amongst £588.7 billion of assets held at fair value ($957bn), it ended the year holding assets of £10.2bn ($16.8bn) in commodities derivatives and £4.2bn ($6.8bn) in physical commodities. "The retrenchment [by major banks] may leave rich opportunities for commodity merchants," says the New York Times, citing Switzerland's Mercuria – now buying J.P.Morgan's commodities investing business for $3.5bn – and Glencore Xstrata, neither of whom "face the same stringent regulations and capital requirements as banks." "The more banks that exit commodities trading," Bloomberg quotes analyst Jeffery Harte at Sandler O'Neill & Partners, "the less competitive it becomes for the banks which stick with it." With Barclays, Deutsche, J.P.Morgan and Morgan Stanley quitting or reducing their commodities business, US investment bank Goldman Sachs "now has a much bigger piece of a much smaller pie," he says. Notes to Barclays' 2013 accounts point out that the European Commission's proposed Liikanen directive would, amongst other things, ban globally significant banks from trading financial instruments and commodities for their own profit/loss account (known as proprietary or "prop" trading). The United States' Dodd-Frank Act meantime seeks to impose position limits on banks and other entities trading derivatives on physical commodities, Barclays' annual report also adds. "These rules could restrict trading activity, reducing trading opportunities and market liquidity and potentially increasing the cost of hedging transactions and the volatility of the relevant markets," it says. | ||||||||||||||||||||||||||||||||||||||||||||||||||||
| Commodities Investing "Back to Normal" as Another Bank Quits Posted: 24 Apr 2014 03:33 AM PDT Barclays exits commodities, clients face rising costs, just as investing returns "diversify portfolio risk" again... COMMODITIES INVESTING is "returning to normal" according to a new report, losing the strong correlation with world stockmarkets seen during and after the global financial crisis just as major banks pull out of the natural resources market. Barclays this week became the fourth global bank to announce it's closing its commodities division, following J.P.Morgan, Morgan Stanley and Deutsche Bank in refocusing activity away from natural resources. Yet for investors, "Commodities are [now] generating stable returns amidst turbulent global capital markets with lower volatility compared to equities and bonds," says a new report from Citigroup Research, a division of the global bank. "This appears to represent a return to normal," Citi's report concludes, with commodities and stockmarket investments moving in different directions, rather than being strongly tied to one another as became the case "especially in the lead up to the financial crisis in 2007-09 and even more so in the immediate aftermath." The exit of major banks from commodities investing was last week cited as a key reason for that falling correlation with stock markets by United Nations' analysts. "The influence of banks and hedge funds on commodities is at its lowest since 2008," said an update from the the UN Conference on Trade and Development (UNCTAD), quoted by Reuters. "As financial investors including banks and hedge funds have reduced their activity in commodities markets in the last two years," it explained, "we've seen a marked drop in the correlation between the returns on the equity markets and the returns on oil and other commodities futures markets." Currently the second-biggest retail bank in the UK, Barclays will retain its precious metals activities, moving its market-making bullion team to its foreign exchange division. But other commodities will go "electronic", with clients offered derivatives and exchange-traded index products. Fellow London bullion market makers Deutsche Bank and J.P.Morgan have also retained their gold and silver trading businesses, although Deutsche – which took 200-tonnes of gold vaulting space in Singapore's Freeport facilities last June – is looking to sell its membership of the London Gold Fixing Limited. Barclays currently chairs the twice-daily London Gold Fix. It opened a dedicated London gold and silver vault in 2012, becoming only the third of London's 11 market-making bullion banks to operate its own facilities. The bank's 2013 annual report shows that, amongst £588.7 billion of assets held at fair value ($957bn), it ended the year holding assets of £10.2bn ($16.8bn) in commodities derivatives and £4.2bn ($6.8bn) in physical commodities. "The retrenchment [by major banks] may leave rich opportunities for commodity merchants," says the New York Times, citing Switzerland's Mercuria – now buying J.P.Morgan's commodities investing business for $3.5bn – and Glencore Xstrata, neither of whom "face the same stringent regulations and capital requirements as banks." "The more banks that exit commodities trading," Bloomberg quotes analyst Jeffery Harte at Sandler O'Neill & Partners, "the less competitive it becomes for the banks which stick with it." With Barclays, Deutsche, J.P.Morgan and Morgan Stanley quitting or reducing their commodities business, US investment bank Goldman Sachs "now has a much bigger piece of a much smaller pie," he says. Notes to Barclays' 2013 accounts point out that the European Commission's proposed Liikanen directive would, amongst other things, ban globally significant banks from trading financial instruments and commodities for their own profit/loss account (known as proprietary or "prop" trading). The United States' Dodd-Frank Act meantime seeks to impose position limits on banks and other entities trading derivatives on physical commodities, Barclays' annual report also adds. "These rules could restrict trading activity, reducing trading opportunities and market liquidity and potentially increasing the cost of hedging transactions and the volatility of the relevant markets," it says. |

 Several Russian News outlets have reported that Russia, Kazakhstan and Belarus, that currently form the Eurasian customs union, will sign an agreement in May to accelerate the formation of an economic union and a joint currency: the Altyn.
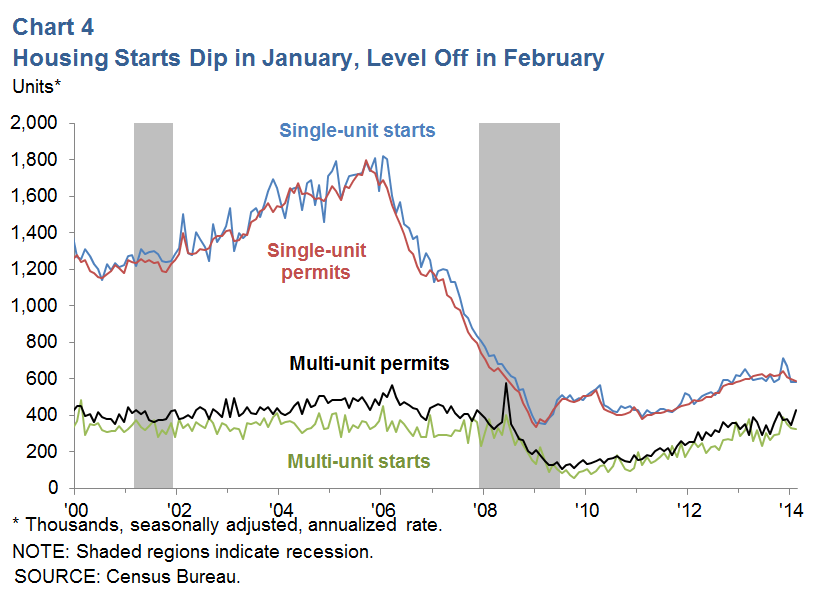
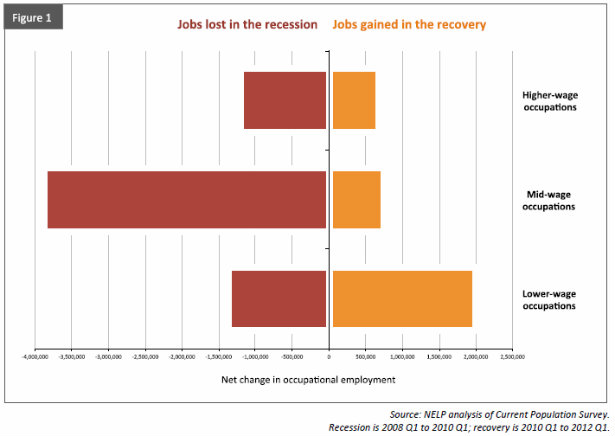
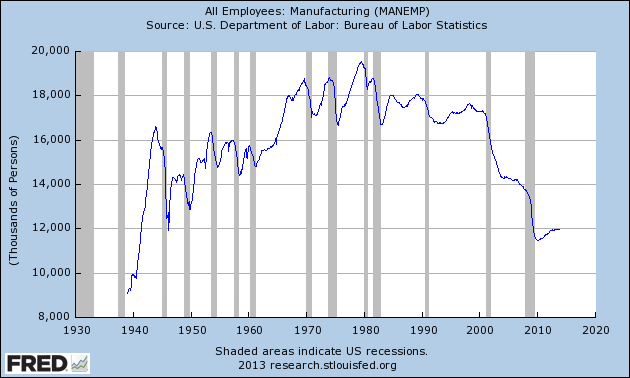


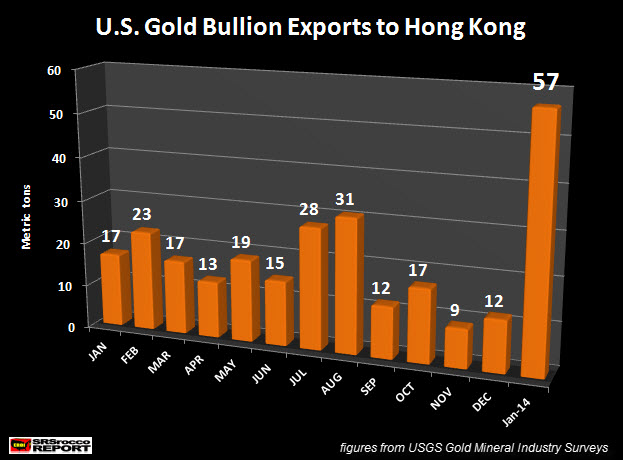


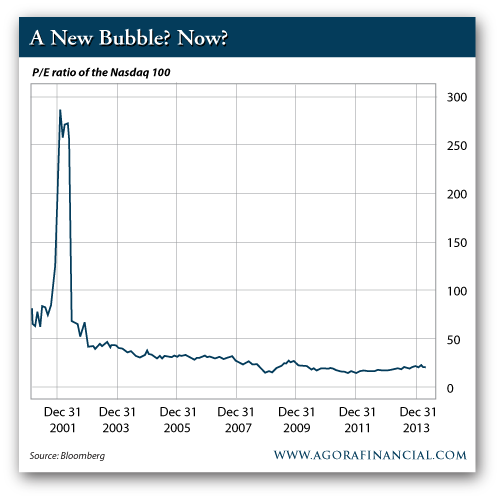

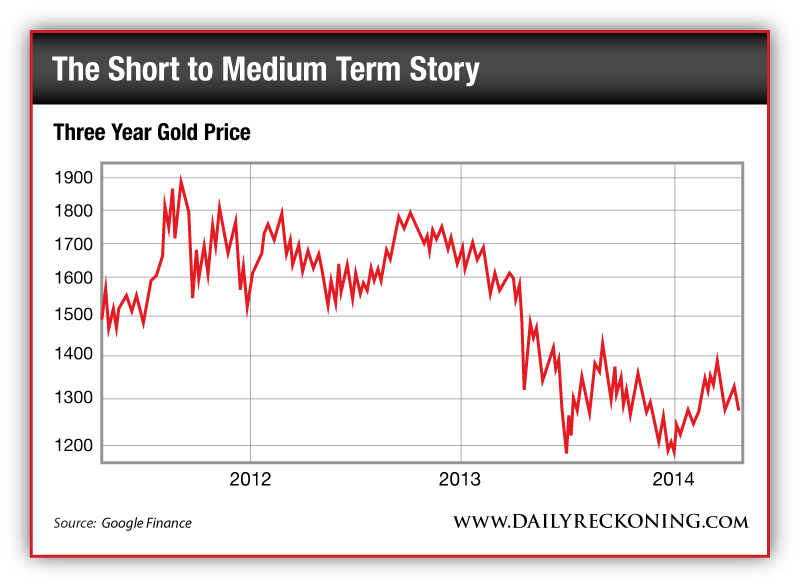


| You are subscribed to email updates from Save Your ASSets First To stop receiving these emails, you may unsubscribe now. | Email delivery powered by Google |
| Google Inc., 20 West Kinzie, Chicago IL USA 60610 | |
No comments:
Post a Comment