


Gold World News Flash |
- Why the 40-year cycle is bad news for stocks
- Celente Warns Of Coming Riots: “The Collapse Is Engulfing The World”
- 9/11 and the gold in the NY Federal Reserve – Flashback
- Zero Hedge: Morgan corners gold with 60% of all U.S. gold derivatives
- China's Epic Skyscraper Construction Spree: A Harbinger Of The Crash?
- Nine Event Risks
- This Is The Beginning Of The 3rd Round Of A Currency War
- Current Economic Collapse News Brief
- No Containing The Energy Subprime Rout
- BitCoin & Other Cryptocurrency Explained
- Gold And Silver – Calls For Explosive Upside In Precious Metals Misplaced
- How Central Banks Cause Income Inequality
- GERALD CELENTE - We Are In A GREAT GLOBAL DEPRESSION.
- Is the Next Great Bear Market Collapse Just Around the Corner?
- Former US Treasury Official – US Engineering Financial Chaos
- Market Cornered: JPMorgan Owns Over 60% Notional Of All Gold Derivatives
- Adrian Day: Ditch the Risk and Embrace the Upside
- And still they impute crime to gold and bitcoin
- This Is The Beginning Of The 3rd Round Of A Currency War
- Market Monitor – February 1st
- Gold Investors Weekly Review – January 31st
- Calls For Explosive Upside In Precious Metals Misplaced
- Global Chaos In 2014 Will Rival That Of The 2008 Collapse
- Will Market Returns Be Dismal Over Next 10 Years? Likely! Here’s Why
- 7 Pointers for Janet Yellen
- Jeff Lewis: Price manipulation awareness may keep the mainstream away
- U.S. Treasury Bonds Defying Dire Forecasts
- Gold Stocks Ditch the Risk and Embrace the Upside
- Turning Point in Junior Gold Mining Stocks?
- Tapering Blues for Gold and Silver
- Central Bank gold reserves transparency
- Silver and Gold Prices - Rangebound Before the Storm
- Gold-shorting orders were filed just before Fed communique, Maguire says
- 78% of NFL Players Go Bankrupt Within 5 Years & NBA Players In…
- Former US Treasury Official - US Engineering Financial Chaos
- Gold Lost $2.10 Today to Close at $1,240.10
- Gold Lost $2.10 Today to Close at $1,240.10
- The Triffin Dilemma
- Credit Suisse Sees Gold Price At $1,000
- Gold Daily and Silver Weekly Charts - Next Stop, February
- Gold Daily and Silver Weekly Charts - Next Stop, February
- Silver Shines at the Super Bowl
- Silver Junior Stocks Struggles
- Koos Jansen: January's gold offtake in Shanghai likely to set record
- Maguire: Desperate BIS & Fed Wage War On Gold As China Buys
- Iran, Pakistan, Malaysia Pathways to Increase Indian Rupee Value
- Silver Money's Historic Problem
- Silver Money's Historic Problem
- Silver Money's Historic Problem
- Gold Investing a Safe Haven Again. Like, Surprise!
| Why the 40-year cycle is bad news for stocks Posted: 02 Feb 2014 08:00 AM PST by Clif Droke, Gold Seek:
Just how powerful is the 40-year cycle? Well consider that in the previous 120 years the 40-year cycle bottom has never failed to produce a major market decline. From the decline in late 1894 to the corrective pullback of 1934 to the devastating decline of 1974, the 40-year cycle has always made its presence felt in the stock market. It's worth examining the 40-year cycle since its influence is already being felt as we enter the first month of the new year. The Kress 40-year cycle belongs to the category of yearly cycles of the first magnitude and is described by Mr. Kress as the Primary Bias Cycle for equities. The 40-year cycle is arguably the most powerful of the long-term cycles which composite the Grand Super Cycle of 120 years. |
| Celente Warns Of Coming Riots: “The Collapse Is Engulfing The World” Posted: 02 Feb 2014 07:40 AM PST by Mac Slavo, SHTFPlan:
His foresight was 20/20. Now, renowned trend forecaster Gerald Celente warns that, despite establishment claims of recovery and growth, things are about to get a whole lot worse. |
| 9/11 and the gold in the NY Federal Reserve – Flashback Posted: 02 Feb 2014 07:20 AM PST by Jon Rappoport, NoMoreFakeNews:
Here are a few quotes. Most are from my posts on 9/11 and 9/12, 2001: http://www.buildfreedom.com/news/archive.php?id=231 http://www.buildfreedom.com/news/archive.php?id=230 http://www.buildfreedom.com/news/archive.php?id=221 "Still no word on the condition of the NY Federal Reserve Bank, which is 2.5 blocks away from the destroyed WTC. This bank, underground, holds $75 billion in gold from [about five] dozen countries." |
| Zero Hedge: Morgan corners gold with 60% of all U.S. gold derivatives Posted: 02 Feb 2014 07:17 AM PST 12:15p SRT Sunday, February 2, 2014 Dear Friend of GATA and Gold: Zero Hedge reports today that JPMorganChase has cornered the gold market in part by owning more than 60 percent of the value of all gold derivatives in the United States, and questions why the U.S. Commodity Futures Trading Commission allows such a corner. Of course there's an easy explanation: Morgan's position is actually the U.S. government's position, as the Gold Reserve Act establishing the Exchange Stabilization Fund authorizes the U.S. government to rig not just the gold market but every market in secret. The Zero Hedge commentary is here: http://www.zerohedge.com/news/2014-02-01/market-cornered-jpmorgan-owns-o... CHRIS POWELL, Secretary/Treasurer ADVERTISEMENT A Personal Touch in Buying Precious Metals If you've not secured your allocation of precious metals and numismatic coins, 2014 may be the last year to get them at affordable and undervalued prices. With huge amounts of gold leaving the West for Asia, the future availability of precious metals is very much in doubt. All Pro Gold has competitive pricing on all bullion and numismatic products -- and offers prompt delivery too. Long-time GATA supporters Fred Goldstein and Tim Murphy are glad to answer any questions or concerns about acquiring the monetary metals. All Pro Gold has an extensive electronic library of articles from the world's top market analysts. Learn more at www.allprogold.com or write to Fred and Tim at info@allprogold.com or telephone them at 1-855-377-4653. Join GATA here: Mines and Money Hong Kong http://www.minesandmoney.com/hongkong/ * * * Support GATA by purchasing DVDs of our London conference in August 2011 or our Dawson City conference in August 2006: http://www.goldrush21.com/order.html Or by purchasing a colorful GATA T-shirt: Or a colorful poster of GATA's full-page ad in The Wall Street Journal on January 31, 2009: http://gata.org/node/wallstreetjournal Help keep GATA going GATA is a civil rights and educational organization based in the United States and tax-exempt under the U.S. Internal Revenue Code. Its e-mail dispatches are free, and you can subscribe at: To contribute to GATA, please visit: ADVERTISEMENT Jim Sinclair plans seminar in Austin Gold advocate and mining entrepreneur Jim Sinclair will hold his next market seminar from 2 to 6 p.m. Saturday, February 8, at the Austin, Texas, Airport Hilton. Advance registration is required. Details for the Austin seminar are posted at JSMineSet.com here: http://www.jsmineset.com/2014/01/02/austin-texas-qa-session-confirmed/ |
| China's Epic Skyscraper Construction Spree: A Harbinger Of The Crash? Posted: 02 Feb 2014 06:37 AM PST If the Barclays Skyscraper Index, which posits bursts of skyscraper construction are a harbinger of great economic collapse and market crashes, is accurate, then the world is in for a, well, world of pain. And nowhere more so than in China. While for nearly a century the undisputed leader in the constuction of massive, phallic-looking, mega-buildings that reach for the skies was the US, over the past decade the baton has undpisutedly shifted to the middle east, and specifically the Arab Emirates and Saudi Arabia, which currently house the top and second tallest skyscrapers in the world. The visual progression of the title holder for world's tallest building is shown on the chart below.
The complete list of the Top 100 currently completed skyscrapers, courtesy of Skyscraper Center, is shown below.
However, as the following summary from Vizual-Statistix indicates, one country that is embarrassingly "only" in fifth place when it comes to tallest buildings is China.
Which is why the centrally-planned communist country with a penchant for issuing trillions of dollars in loans each year then bailing out all insolvent financial institutions and shadow banks, and an even greater penchant for creating excess capacity, has taken it upon itself to catch up. And as the following list of projected skyscrapers, over the next several years China will be host of 5 of the world's top 10 tallest buildings, and 14 of the top 20!
That's ok though - China is obviously suffering from a case of Skyscraper envy. However, the true scale of the problem only emerges when one expands the list of buildings either already in construction or already proposed. The list below shows only the skyscrapers proposed or currently in construction just in China!
Which is why if the Barclays Skysraper Index is indeed correct, then China - ignoring all other sirens of an imminent credit bubble implosion - better watch out below. Source: Skyscraper Center |
| Posted: 02 Feb 2014 06:35 AM PST The investment climate has proven extremely difficult for investors to navigate. Fed tapering and better world growth was to lead to higher interest rates. Yet interest rates for the developed world have fallen sharply in recent weeks. Aggressive quantitative easing by the Bank of Japan was widely understood to be yen negative, yet the yen is the only currency to have been stronger than the dollar in January. Toward the emerging markets, investors were to take a more differentiated approach. Countries with large current account deficit were particularly vulnerable, yet it appears that the entire asset class was tarred with the same brush. Reports suggest that ETF for Mexican equities (EWW) showed the largest outflow, which seems counter-intuitive, especially since the higher wages and economic slowdown in China appear to work to its benefit.
We identify, discuss and assess nine event risks of global investors in the week ahead.
Emerging Markets (High Risk): The MSCI Emerging Market equity index peaked in 2011 and is off a little more than 20% since then. Last month, it fell 6%. Investors' post-2009 love affair with emerging markets is over. The fact of the matter is that most were emerging markets 20 years ago and are likely to be emerging markets 20 years from now. There were two attractors—liquidity and structural reforms and we suspect, as is their wont, investors have tended to emphasis the latter and under appreciate the former. One clear implication is that real interest rates will have to rise through most of the emerging market universe. And this will have negative knock-on effects for growth.
However, due to some structural reforms, including more flexible currency regimes, somewhat deeper capital markets, and the accumulation of reserves, which can be understood as a type of self-insurance, many emerging market countries are better able to cope with a capital outflows. The key to whether investor panic leads to a crisis seems to be largely a function of the response by policy makers. The IMF/World Bank and the US Treasury have urged developing countries to take advantage of the signals to strengthen their own policy reaction. They might as well be shouting in the wind.
Portfolio Allocation (High Risk): In addition to sizeable outflows from emerging market funds that have been widely reported, there have been three other notable portfolio adjustments. First, anecdotal reports indicate that in recent weeks, several large asset managers have shifted from stocks to bonds. In this context, we note that US Treasuries had their single best month in January since the middle of 2012. To the extent there is foreign investment component, we note that due to relative volatilities, foreign fixed income investment tends to carry a higher hedge ratio than foreign equity investments. Second, after strong foreign interests in recent months that has helped drive Spain and Italian rates to record lows, some large asset managers have reportedly begun adjusting positions on valuation grounds. Third, Japanese investor appetite for foreign bonds that was evident in the second half of 2013 appears to have waned in January, as they turned net sellers again. For their part, foreign investors have slowed their purchases of Japanese shares.
Trade Promotion Authority (Low Risk): Within 24-hours of President Obama's State of the Union Speech in which he called on Congress to grant him Trade Promotion Authority to complete the negotiations for Trans-Pacific Partnership and the Trans-Atlantic Trade and Investment Partnership, Senate Majority Leader Reid underscored his opposition. Even though the risk that TPP, which was initially to be completed last year, is further delayed is high, the risk to investors appears minimal. Yet, it speaks volumes about the outlook for fresh initiatives ahead of the November election and the consequence of the erosion of support for President Obama. Note that this follows the recent refusal by Congress to ratify the long planned increase in the IMF's quota. Some observers talk about a new wave of isolationism in the US, but sometimes in the past, isolationism was a shroud to cover unilateralism.
China (Near-term Low Risk): The Lunar New Year celebration will keep China out of the spotlight in the coming week. It will report the service sector PMI reading first thing Monday in Beijing, but other than that, it will likely be out of the news in the coming days. The official manufacturing PMI was reported at 50.5, which was in line with expectations, but is the lowest reading since last July. Output hit a four month low and new orders slipped to six month lows, though both are still above the 50 boom/bust level. Employment and export orders were below 50.
Reserve Bank of Australia (Medium Risk): The RBA is the first of the three central bank meetings from the high income countries. There is little doubt that policy is on hold with the cash rate at a record low 2.5%. The credit expansion, the somewhat higher than expected CPI inflation figures, and the roughly 8% decline in a trade-weighted measure of the Australian dollar over the last four months remove the sense of urgency to cut rate further. At the same time, the weakness of the labor market, the softness in producer prices (pipeline inflation?) and the erosion of the terms of trade, means the RBA is unlikely to close the door completely on another rate cut, which now seems more likely in Q2 than Q1. We attribute a medium risk to the prospect of a more neutral sounding RBA statement. We note that central bank officials have cited $0.8500 and $0.8000 as targets for the exchange rate.
Bank of England (Low Risk): The Bank of England is securely on the sidelines. BOE Governor Carney has already indicated that the next step in the evolution of forward guidance will be announced with the quarterly inflation report on February 12. Contrary to claims that Carney is jettisoning the forward guidance, we expect the BOE to drive home the point that the 7.0% unemployment rate was a threshold not a trigger for tighter policy. In effect, the BOE will say, we re-examined the economic conditions in light of the threshold being approached and we continue to judge the economy as recovering but still in need to very low interest rates. The September short sterling futures contract rallied in January and the implied yield is 16 bp lower than it was in late-December at an implied yield of about 64 bp. It can fall toward 50 bp bank rate on dovish comments and data that suggest the economic activity is leveling off, which is expected to be seen in the PMI reports in the coming days.
Euro Area PMI (Low Risk): The flash readings steal much of the thunder from the final reports that are out in week ahead. The focus will be on Spain and Italy for signs of continued recovery. The manufacturing PMI for the euro area is at its best level since 2011, which has lifted the composite as well. The service sector has lagged, though the flash reading put it at four month highs. We note that the criticism of the lack of progress reform in the German service sector appears to be on the rise.
ECB Meeting (High Risk): The two pillars of ECB monetary policy, money supply and inflation, disappointed on the downside. This has spurred speculation that the ECB will take action at its meeting on February 6. A large German bank has forecast a small cut in the 25 bp repo rate and, more important, a move to a negative deposit rate. Others have predicted an end to the efforts to sterilize the SMP purchases. Since EONIA has traded above the repo rate, we think a repo rate cut is largely immaterial. Cutting the 75 bp lending rate would be more significant in capping the increase in EONIA. A negative deposit rate could be potentially very disruptive as it puts the ECB in unprecedented territory. Even Japan through its deflationary years never adopted a negative deposit rate.
The ECB does not need to open the can of worms by formally ending its sterilization of the SMP sovereign bond purchases. It would likely be highly controversial as some (read Germany and its creditor allies) may see it is an illegal monetization of sovereign debt. It can take a stay with its more passive of failing to attract enough interest in its sterilization operations. This would be less controversial but effective in providing more liquidity on a weekly basis. We see ECB officials more concerned about lending to the SME sector. In one of the more important discussions at Davos, Draghi indicated a willingness to consider buying bank bonds, backed by loans to households and SMEs. Though it does not appear imminent, development along these lines seem more promising.
US Jobs Data (High Risk): The market generally anticipates a dramatic recovery in non-farm payrolls in January after the disappointing 74k increase in December. However, there is substantial risk that the frigid temperatures in the Midwest, South and Northeast will make for another disappointing report. Last month, we noted how well the ADP estimates had anticipated the official data, just in time for the large miss (ADP Jan estimates was 238k, while the private sector NFP grew by only 87k). Having been burned last month, investors will likely put less weight on it this time. The market will quickly look at the weather distortions and make adjustment accordingly. Before the Fed meets again (mid-March), it will see another jobs report, so the policy implications of a disappointing report may not be that great. Most investors and observers see the bar relatively high against the Fed deviating from the tapering strategy outlined by the FOMC in December. There is also substantial risk that without emergency unemployment benefits being extended there may be an unusually large decline in the unemployment rate as more people leave the labor market. Arguably the Fed's forward guidance anticipates this possibility by saying rates will remain low even after unemployment falls through the 6.5% threshold.
While the employment report is the last major event of the week, at the start of the week, the US reports January auto sales. The consensus calls for a 15.7 mln unit selling pace after the disappointing 15.3 mln unit pace in December. If true this would put the January sales about the average in H2 13. However, there is risk of disappointment due to weather disruptions and this would weigh on the retail sales report (January 13), which already are looking soft even excluding auto sales. Lastly, the debt ceiling debt poses headline risk, though distortions to the short-dated T-bills appears to have eased somewhat.  |
| This Is The Beginning Of The 3rd Round Of A Currency War Posted: 02 Feb 2014 06:00 AM PST from KingWorldNews:
"The emerging market turmoil has accelerated and increased as tapering has come into effect. We saw Argentina devalue their peso, which automatically caused a rush into gold. Gold has soared in peso terms and it's a reminder that all of this means the onset of even more risk. The classic shelter during this turmoil has historically always been gold. The last time we spoke I suggested a major bottom had been made at $1,180. Gold then moved up into resistance in the $1,270 area, and now we are just backing and filling. But I think the next target after $1,270 is $1,325, and then there is a big gap to $1,600. So despite the pullback in gold, people need to fasten their seat belts." |
| Current Economic Collapse News Brief Posted: 02 Feb 2014 04:00 AM PST from X22Report: |
| No Containing The Energy Subprime Rout Posted: 02 Feb 2014 03:05 AM PST The Financial Subprime Model The 2008 global financial crisis was “contained”, or at least plausibly denied for over 2 years before it went critical and caused a global stock market, financial, banking and economic crisis – the effects of which we are still living with, today. As Doug Short wrote this week on Market Oracle: “Contained” was the buzz word used to describe the U.S. subprime crisis in 2006-2007 until it was undeniable in 2008 that it was most certainly not contained. So then, the trillion dollar question is, how does one determine when a crisis is contained or developing into a contagion?” Incredible or unexpected price and production swings by double-digit percentage leaps, is one indicator |
| BitCoin & Other Cryptocurrency Explained Posted: 02 Feb 2014 12:51 AM PST Leo explains what Cryptocurrency is, including BitCoin and Dogecoin, and whether or not it holds any real value. Bitcoin is backed by a network of hundreds of thousands of computers constantly updating the blockchain, unlike the dollar. Bitcoin has value not just because we decided so. It's... [[ This is a content summary only. Visit http://www.GoldSilverNewsBlog.com or http://www.newsbooze.com or http://www.figanews.com for full links, other content, and more! ]] |
| Gold And Silver – Calls For Explosive Upside In Precious Metals Misplaced Posted: 01 Feb 2014 07:12 PM PST So far, January 2014 has become a part of the failed rally for gold and silver that was so widely expected in 2013. That has not stopped the renewed enthusiasm for 2014 being THE year for the long awaited rally-to-the-sky. Anyone who reads our commentaries on a regular basis knows that the most reliable source for what the market will do comes from the market itself. The contention here is that almost everyone's focus is misplaced, and the reasons why gold and silver remain at low levels are not being given their proper due. It has to do more with the battle for world supremacy than anything else, a topic for another time. |
| How Central Banks Cause Income Inequality Posted: 01 Feb 2014 07:03 PM PST Submitted by Frank Hollenbeck via the Ludwig von Mises Institute, The gap between the rich and poor continues to grow. The wealthiest 1 percent held 8 percent of the economic pie in 1975 but now hold over 20 percent. This is a striking change from the 1950s and 1960s when their share of all incomes was slightly over 10 percent. A study by Emmanuel Saez found that between 2009 and 2012 the real incomes of the top 1 percent jumped 31.4 percent. The richest 10 percent now receive 50.5 percent of all incomes, the largest share since data was first recorded in 1917. The wealthiest are becoming disproportionally wealthier at an ever increasing rate.
Most of the literature on income inequalities is written by professors from the sociology departments of universities. They have identified factors such as technology, the reduced role of labor unions, the decline in the real value of the minimum wage, and, everyone’s favorite scapegoat, the growing importance of China. Those factors may have played a role, but there are really two overriding factors that are the real cause of income differentials. One is desirable and justified while the other is the exact opposite.
In a capitalist economy, prices and profit play a critical role in ensuring resources are allocated where they are most needed and used to produce goods and services that best meets society’s needs. When Apple took the risk of producing the iPad, many commentators expected it to flop. Its success brought profits while at the same time sent a signal to all other producers that society wanted more of this product. The profits were a reward for the risks taken. It is the profit motive that has given us a multitude of new products and an ever-increasing standard of living. Yet, profits and income inequalities go hand in hand. We cannot have one without the other, and if we try to eliminate one, we will eliminate, or significantly reduce, the other. Income inequalities are an integral outcome of the profit-and-loss characteristic of capitalism; they cannot be divorced. Prime Minister Margaret Thatcher understood this inseparability well. She once said it is better to have large income inequalities and have everyone near the top of the ladder, than have little income differences and have everyone closer to the bottom of the ladder. Yet, the middle class has been sinking toward poverty: that is not climbing the ladder. Over the period between 1979 and 2007, incomes for the middle 60 percent increased less than 40 percent while inflation was 186 percent. According to the Saez study, the remaining 99 percent saw their real incomes increase a mere .4 percent between 2009 and 2012. However, this does not come close to recovering the loss of 11.6 percent suffered between 2007 and 2009, the largest two-year decline since the Great Depression. When adjusted for inflation, low-wage workers are actually making less now than they did 50 years ago.
This brings us to the second undesirable and unjustified source of income inequalities, i.e., the creation of money out of thin air, or legal counterfeiting, by central banks. It should be no surprise the growing gap in income inequalities has coincided with the adoption of fiat currencies worldwide. Every dollar the central bank creates benefits the early recipients of the money—the government and the banking sector — at the expense of the late recipients of the money, the wage earners, and the poor. Since the creation of a fiat currency system in 1971, the dollar has lost 82 percent of its value while the banking sector has gone from 4 percent of GDP to well over 10 percent today. The central bank does not create anything real; neither resources nor goods and services. When it creates money it causes the price of transactions to increase. The original quantity theory of money clearly related money to the price of anything money can buy, including assets. When the central bank creates money, traders, hedge funds and banks — being first in line — benefit from the increased variability and upward trend in asset prices. Also, future contracts and other derivative products on exchange rates or interest rates were unnecessary prior to 1971, since hedging activity was mostly unnecessary. The central bank is responsible for this added risk, variability, and surge in asset prices unjustified by fundamentals. The banking sector has been able to significantly increase its profits or claims on goods and services. However, more claims held by one sector, which essentially does not create anything of real value, means less claims on real goods and services for everyone else. This is why counterfeiting is illegal. Hence, the central bank has been playing a central role as a “reverse Robin Hood” by increasing the economic pie going to the rich and by slowly sinking the middle class toward poverty. Janet Yellen recently said “I am hopeful that … inflation will move back toward our longer-run goal of 2 percent, demonstrating her commitment to an institutionalized policy of theft and wealth redistribution.” The European central bank is no better. Its LTRO strategy was to give longer term loans to banks on dodgy collateral to buy government bonds which they promptly turned around and deposited with the central bank for more cheap loans for more government bonds. This has nothing to do with liquidity and everything to do with boosting bank profits. Yet, every euro the central bank creates is a tax on everyone that uses the euro. It is a tax on cash balances. It is taking from the working man to give to the rich European bankers. This is clearly a back door monetization of the debt with the banking sector acting as a middle man and taking a nice juicy cut. The same logic applies to the redistribution created by paying interest on reserves to U.S. banks. Concerned with income inequalities, President Obama and democrats have suggested even higher taxes on the rich and boosting the minimum wage. They are wrongly focusing on the results instead of the causes of income inequalities. If they succeed, they will be throwing the baby out with the bathwater. If they are serious about reducing income inequalities, they should focus on its main cause, the central bank. In 1923, Germany returned to its pre-war currency and the gold standard with essentially no gold. It did it by pledging never to print again. We should do the same. |
| GERALD CELENTE - We Are In A GREAT GLOBAL DEPRESSION. Posted: 01 Feb 2014 07:00 PM PST GERALD CELENTE - Elite Bankers Are MANIPULATING The GOLD PRICE. We Are In A GLOBAL DEPRESSION If there's one thing that should be clear, it's that nothing the government or their banking partners have done to solve the economic crisis has been for your benefit. They've enriched themselves, yet... [[ This is a content summary only. Visit http://www.GoldSilverNewsBlog.com or http://www.newsbooze.com or http://www.figanews.com for full links, other content, and more! ]] |
| Is the Next Great Bear Market Collapse Just Around the Corner? Posted: 01 Feb 2014 05:39 PM PST The financial markets hit yet another series of bumps a week ago.
Those bumps are:
1) Turkey’s financial meltdown. 2) China’s shadow banking issues. 3) Argentina veering towards default.
While these economies are all markedly different, the common theme behind their current financial woes pertains to one dreaded word:
DEFAULT.
The biggest problem with the epic Central Bank rig of the last five years is that propping up a bankrupt financial system by printing money only works for so long.
The reason for this is that no one, whether it be a country, company, or person, can defy mathematics.
A loan can be extended, it can be restructured, or it can be finagled in countless financial ways. But at the end of the day, if your creditors lost faith in your ability to repay it… it’s GAME OVER.
This issue is now beginning to ripple throughout the emerging market space.
Moreover, the US equity market has entered a kind of mania a may in fact be topping.
Take note of the following:
1) Investors piling into stock-based mutual funds at a pace not seen since the Tech Bubble. 2) Margin debt (debt investors take on to buy stocks) at a record high. 3) Market leaders (Tesla, Netflix, Amazon, etc.) showing clear signals of investor rotation. 4) Corporate profit margins at record highs and primed to fall. 5) Market breadth shrinking (meaning fewer stocks participating in the rally). 6) The VIX (a measure of investor sentiment) dropping to levels of complacency not seen since 2007. 7) Investor bullishness hitting record highs and investor bearishness hitting record lows. 8) Investment legends either returning capital to investors (Icahn, Klarman) or sitting on mountains of cash (Buffett).
In simple terms, the bull market of the last five years finally went into mania mode as retail investors stopped worrying about income (investing in bonds) and drank the Fed’s Kool-Aid: bought stocks.
The blow off/ mania component of the rally occurred when retail investors began to pile into stocks (as is always the case with tops) around the end of 2012/ early 2013. Whenever this period ends, the chart of the DOW shows where we’re likely going:
Be smart… prepare in advance.
For a FREE Special Report on how to prepare your portfolio for a bear market collapse, visit us at:
http://phoenixcapitalmarketing.com/special-reports.html
Best Regards
|
| Former US Treasury Official – US Engineering Financial Chaos Posted: 01 Feb 2014 05:20 PM PST Dear CIGAs, Today a former US Treasury official told King World News that the United States government is purposefully creating financial chaos all over the world in order to destabilize enemy countries and create a flight into the US dollar. This is an incredibly important interview, where the former US Treasury official lays out exactly... Read more » The post Former US Treasury Official – US Engineering Financial Chaos appeared first on Jim Sinclair's Mineset. |
| Market Cornered: JPMorgan Owns Over 60% Notional Of All Gold Derivatives Posted: 01 Feb 2014 05:03 PM PST Perhaps the only question we have after seeing the attached table, which shows that as of Q3, 2013 JPMorgan owned $65.4 billion, or just over 60% of the total notional ($108.2 billion) of all gold derivatives in the US, is whether the CFTC will pull the "our budget was too small" excuse to justify why it allowed Jamie Dimon to ignore any and all position limits and corner the gold market?
And purely as a reference point, the chart below compares the total value of gold held in JPM's vault (registered and eligible) as of Friday's closing price with its reported gold derivative notional holdings.
Finally, for the purists out there, we realize that gross is not net... until there is a breach in the derivative counterparty collateral chain, and gross becomes net. |
| Adrian Day: Ditch the Risk and Embrace the Upside Posted: 01 Feb 2014 04:00 PM PST The Gold Report |
| And still they impute crime to gold and bitcoin Posted: 01 Feb 2014 03:52 PM PST Why Criminals' Currency of Choice is the U.S. Dollar By Sara Ledwith It seems counterintuitive but cash-hoarding criminals can be depended upon to uphold the international monetary order, or so a new book maintains. The vast quantity of hundred-dollar bills in hard currency held by drug dealers outside the United States is a key to America's global dominance, according to economist John Williamson. The criminals' currency of choice is both a vote of confidence -- because they choose dollars over euros, yen, or Swiss francs -- and an interest-free loan to the United States. It's a point Williamson and others bring home in "The Power of Currencies and Currencies of Power," a collection of essays edited by former Reuters global economics correspondent Alan Wheatley that shows how the world's currencies work to reinforce the geopolitical pecking order. ... ... For the full story: http://www.reuters.com/article/2014/01/30/books-wheatley-idUSL3N0KQ4F320... ADVERTISEMENT Buy metals at GoldMoney and enjoy international storage GoldMoney was established in 2001 by James and Geoff Turk and is safeguarding more than $1.7 billion in metals and currencies. Buy gold, silver, platinum, and palladium from GoldMoney over the Internet and store them in vaults in Canada, Hong Kong, Singapore, Switzerland, and the United Kingdom, taking advantage of GoldMoney's low storage rates, among the most competitive in the industry. GoldMoney also offers delivery of 100-gram and 1-kilogram gold bars and 1-kilogram silver bars. To learn more, please visit: http://www.goldmoney.com/?gmrefcode=gata Join GATA here: Mines and Money Hong Kong http://www.minesandmoney.com/hongkong/ * * * Support GATA by purchasing DVDs of our London conference in August 2011 or our Dawson City conference in August 2006: http://www.goldrush21.com/order.html Or by purchasing a colorful GATA T-shirt: Or a colorful poster of GATA's full-page ad in The Wall Street Journal on January 31, 2009: http://gata.org/node/wallstreetjournal Help keep GATA going GATA is a civil rights and educational organization based in the United States and tax-exempt under the U.S. Internal Revenue Code. Its e-mail dispatches are free, and you can subscribe at: To contribute to GATA, please visit: ADVERTISEMENT How to profit with silver -- Future Money Trends is offering a special 16-page silver report with profiles of nine companies and technical analysis of their stock performance. Six of the companies have market capitalizations of less than $800 million and one company has a market cap of only $30 million. The most exciting of these companies will begin production in a few weeks and has a market cap of just $150 million. Half of all proceeds from the sale of this report will be donated to the Gold Anti-Trust Action Committee to support its efforts exposing manipulation and fraud in the gold and silver markets. To learn about this report, please visit: http://www.futuremoneytrends.com/index.php?option=com_content&id=376&tmp... |
| This Is The Beginning Of The 3rd Round Of A Currency War Posted: 01 Feb 2014 01:58 PM PST  With continued turmoil and volatility in global markets, today Canadian legend John Ing told King World News we are just at the beginning of the third round of a worldwide currency war. Ing, who has been in the business for 43 years, also spoke with KWN about what investors should expect to see in major markets, including gold. Below is what Ing had to say in his fascinating interview. With continued turmoil and volatility in global markets, today Canadian legend John Ing told King World News we are just at the beginning of the third round of a worldwide currency war. Ing, who has been in the business for 43 years, also spoke with KWN about what investors should expect to see in major markets, including gold. Below is what Ing had to say in his fascinating interview.This posting includes an audio/video/photo media file: Download Now |
| Posted: 01 Feb 2014 12:45 PM PST Top Market Stories For February 1st, 2014: Renewed Calls From China For a Global Super-Currency To Replace “Bretton Woods II” - Jesse's Café New gold and diamond buyers emerge at Dubai Shopping festival - Mineweb Doug Casey: "Gold Stocks Are About to Create a Whole New Class of Millionaires" - GoldSeek Fed Responsible for EM Crisis? - GoldSeek Japan [...] |
| Gold Investors Weekly Review – January 31st Posted: 01 Feb 2014 11:30 AM PST In his weekly market review, Frank Holmes of the USFunds.com nicely summarizes for gold investors this week's strengths, weaknesses, opportunities and threats in the gold market. The price of the yellow metal went lower after two consecutive weeks of gains. Gold closed the week at $1,244.23, up $25.84 per ounce (2.03%). The NYSE Arca Gold Miners Index went 0.87% higher on the week. This was the gold investors review of past week. Gold Market StrengthsPhysical sales for gold rose 51% in China during the month of December, ahead of the gift-giving season of the Lunar New Year on January 31. Similarly, Austria's mint is running 24-hour shifts as global mints from the U.S. to Australia report climbing demand for the metal. Meanwhile, the global security services company Brinks, is getting ready to open its fifth gold vault in Singapore to profit from gold's movement from the West to the East. Three bought deals in the junior gold space were announced this week, a sign that insiders are confident that the current cycle will continue to strengthen. True Gold Mining is raising C$36.6 million (Canadian dollars) for development and construction of the recently permitted Karma deposit in Burkina Faso. Similarly, Lydian International is raising C$15 million to advance its Amulsar project in Armenia, while Dalradian Resources is raising approximately C$12 million to advance its high-grade Curraghinalt deposit in Northern Ireland. Gold Market WeaknessesOn January 30, gold futures tumbled the most in six weeks after a report showed the U.S. economy expanded 3.2 percent in the fourth quarter. This boosted speculation that the Fed will continue to scale back monetary stimulus. German inflation continues to surprise to the downside, this time slowing in January. The surprise is partly explained by a decrease in Euro-denominated oil prices that drove both fuel and heating prices lower-than-expected. The situation in the rest of the eurozone is similar, which in effect reduced both retail and institutional appetite for gold. Gold Market OpportuntiesComex gold stocks eligible for delivery are at virtually all-time lows, continuing to fall rapidly. JP Morgan withdrew a massive 321,500 ounces from its vaults last week, the largest withdrawal of physical gold ever. Comex's last report shows that delivery-eligible inventories are currently sitting at a very modest 70,000 ounces, or 2.2 tonnes. At the rate of current outflows, there will be no physical gold left to back the paper contracts. Gold Market ThreatsAccording to the commentary from David Rosenberg at Gluskin Sheff, when comparing the reported U.S. inflation reading to the implicit inflation in owner's-equivalent rent, the inflation would be 5.3 percent today, not 1.7 percent as per the "official" government number. The author obtains that figure by replacing the imputed rent measure of the consumer price index (CPI) with the actual transaction price measure of owner's-equivalent rent. The research team at Deutsche Bank believes that the gold price could face a tug-of-war between macro headwinds from Fed tapering on one hand, and robust physical buying and safe-haven demand on the other. On balance, the analysts at Deutsche Bank argue that the end of central bank balance sheet expansion, and a broad-based rally of the U.S. dollar, is likely to resume downward pressure on gold prices. |
| Calls For Explosive Upside In Precious Metals Misplaced Posted: 01 Feb 2014 11:15 AM PST So far, January 2014 has become a part of the failed rally for gold and silver that was so widely expected in 2013. That has not stopped the renewed enthusiasm for 2014 being THE year for the long awaited rally-to-the-sky. Anyone who reads our commentaries on a regular basis knows that the most reliable source for what the market will do comes from the market itself. The contention here is that almost everyone's focus is misplaced, and the reasons why gold and silver remain at low levels are not being given their proper due. It has to do more with the battle for world supremacy than anything else, a topic for another time.
Not everyone is interested in charts, we accept that and can understand why, given the way many charts are presented, more for sensationalism to back up a catchy headline for an article than for realistic content. People who make predictions are blowing smoke in the readers face. All the "predictions" for 2013 should be sufficient proof, yet the pattern has already started to be repeated for 2014. Not everyone can properly read a chart. It takes years of concerted effort, and most people want easy answers in a few brief sentences. What almost everyone has is common sense, and the markets are replete with logic that makes sense. It can often take an art form for analysis, but if you are willing to put aside any predisposition about looking at charts as a waste or too foreign to understand, then try to follow the logic of what is presented, and you will have a more realistic understanding of what to expect, moving forward. We have 8 charts, 4 for gold and 4 for silver. At no time will there be any discussion of any fundamentals, severe shortages, calls for much higher prices, etc. The charts do not show any of that, at the moment. In fact, they tell a story that makes sense. The story may not appease the need for hearing how gold and silver are going to be X amount higher, sometime soon. History is on the side of failed paper fiat currency, while gold and silver being among, if not the best assets to succeed in a big way in the wake of paper asset demise. The two down sloping TLs, [trend lines] show market direction, or trend, and we know logically that trends perpetuate and only change gradually, for the most part. There is a 50% line shown on the chart. Generally, when a market cannot regain above the half way mark within a trend, it tells you that the trend will continue, directionally. Wide range bars and stand out volume bars are important market tools. Very often, a wide range bar will contain future price development for some period of time. Last June was a wide range bar, shown on the chart. All of the past six months have been trading within the high and low of June's range. The point is, when you see a wide range bar on a chart, the probability is for price to be range-bound by it for several periods into the future. Another way charts inform is by observing how many bars in a rally, and how may bars it takes to correct the rally. From the June low, there was a 2 bar, [2 months] rally. The correction, or retracement of the rally took 4 bars, or twice as long. This tells us that it was easier for buyers to rally the market than it was for sellers to force it down, taking twice as long. This piece of logic tells us buyers are stronger than sellers, at that point in time. The opposite of a wide range, which shows ease of movement, is a small range bar, one that makes very little directional progress. The last bar in the decline had the smallest range. What that tells us is that buyers were more than meeting the effort of sellers, and that effort on the part of buyers prevented the range from going lower. From that, we know demand is in greater control. If demand is in control, the market should rally. Essentially, what we are doing is putting little pieces of a puzzle together that should tell some kind of story. No matter what you hear or read about gold and the prospects for substantially higher price levels, the trend is down, exactly opposite of what you know. When you compare what you know, an opinion, with what the market is telling you, the market is a more accurate measure, however counter-intuitive it may be to your opinion[s].
We can see from the weekly charts that gold remains in a relatively weak status. It is both under the TLs and the 50% mark. However, there was an interesting development in the weekly range just ended. We said sharp increases in volume can be important. Last week was the highest volume since the June 2013 low. There is not a substantial difference in the two volume levels, yet compare the range for last June with the range for last week. Last week was about 1/3 the size of the June bar. Here is where logic come in. If there was almost as much volume last week as last June, but the size of the bar was so much smaller, then we can gain an insight into the character of the market. The same volume effort produced less downside results, and not a wide range lower as occurred in June. This is a red flag. Why was the range smaller? Because buyers were much stronger than sellers and this prevented the range from extending lower. We are getting information from the market that says sellers were unable to push price lower, as they did last June. If buyers can sustain that caliber of effort, it will lead to a rally, and eventually, a change in trend.
Changes in trend appear on the smaller time frames first. Price is under the TLs on the monthly and weekly charts. On the daily chart, below, price has broken the TL down and is now moving sideways. The lead month for gold futures is now April, so the previous volume activity was stronger in the February contract, and the volume prior to last week is not reliable, as viewed on the April chart. There was a wide range bar to the upside, [arrow 1], and that indicates ease of movement to the upside. It started a 3 bar rally, followed by a 5 bar decline. In other words, it takes more time and effort for sellers to correct the last rally. Look at the high volume for the bar [at arrow 2], and it is a relatively wide range bar lower. What would be expected is for the downside momentum to continue, but that did not happen, as we see in bar 3. This is also a red flag, alerting us to a market imbalance. In fact, we took a small long position near the close on Friday, for reasons just cited, and also from looking at an intra day chart, not shown here, but we do have one for silver.
NUGT is a 3X bullish gold ETF. We took a look to see what the market sentiment was in that more leveraged arena. When we last looked at it, several months ago, it had flat- lined. There appears to be some change in sentiment over the recent few months. What stood out in price was how the market hugged the lows, and held, for December. January turned into the opposite, as price was now hugging the resistance area. The long price holds, without backing away lower, the odds favor an upside breakout as buyers are absorbing the sellers. The volume backs up the price activity. During span "A," while price was in decline, volume was relatively lower than when price subsequently rallied during span "C." This tells us that demand has been greater as price rallied, a bullish development. During span "B," volume was at the relative highest, and this tells us smart money was accumulating long positions, in preparation for a mark-up phase. The stage is being prepared for some kind of rally in gold. We do not know how much of a rally, in advance. Instead, we look for signs of buying activity, like the absorption in NUGT. Once price breaks out to the upside, that would be the trigger to be long ETFs and futures. Anyone buying paper futures, based on the very bullish fundamentals for the physical, has been taking a beating, as it were. By simply paying attention to the trend and other pieces of market information, there has been no reason to be buying futures. A read of what the charts have been saying has kept one from taking unnecessary risk exposure and losses in trading.
The same market logic prevails in silver as we just saw in gold. The very small range for December was a red flag bar, a warning to sellers that buyers were stronger, evidenced by an inability for sellers to extend price lower in a down trend. This is a clear market message. January, last bar, failed to continue lower as it formed a higher high and a higher low. We take that information to see how it translates on the next lower time frame.
By itself, last week's performance suggests price should go lower. A look at the next lower time frame, a daily chart, should be more informative.
Clearly, silver has been locked on a TR since mid-November. A question that arises is, why have not sellers been able to push price lower? Activity for the last half of January shows a labored effort by sellers. It is taking twice as long to decline as it took to rally, and that suggests buyers are in greater control down here than sellers. We do not often show intra day charts, even though we watch them closely every day. A long position was recommended at the end of the day. The intra day chart better shows why.
You already now know that wide range bars and high volume bars are important to watch. At number 1, there is both, combined. The reason high volume bars are so important is because the volume is generated by smart money usually seeking to establish a position. Smart money buys low and sells high, and it is the public that is always on the other side of the trade. The analysis is labeled and explained on the chart. We leaned on the high volume and wide range bar as a reason to take a long position. With price so near the bottom, we are able to keep risk low, in the process. A rally above 19.20 – 19.30 will confirm the analysis, which is nothing more than a process of applying logic to developing market activity. |
| Global Chaos In 2014 Will Rival That Of The 2008 Collapse Posted: 01 Feb 2014 09:59 AM PST  Today one of the top economists in the world warned King World News that global chaos in 2014 will rival that of the 2008 collapse. This is one of Michael Pento's, founder of Pento Portfolio Strategies, most important pieces he has ever written. Today one of the top economists in the world warned King World News that global chaos in 2014 will rival that of the 2008 collapse. This is one of Michael Pento's, founder of Pento Portfolio Strategies, most important pieces he has ever written. This posting includes an audio/video/photo media file: Download Now |
| Will Market Returns Be Dismal Over Next 10 Years? Likely! Here’s Why Posted: 01 Feb 2014 09:00 AM PST If you have 401k assets, are a financial professional or individual investors looking to construct portfolios and So says Chris Kimble (blog.kimblechartingsolutions.com) in his latest post* entitled Long lasting bull markets start from here? Ave 10-year returns are 2%! [The following is presented by Lorimer Wilson, editor of www.FinancialArticleSummariesToday.com and www.munKNEE.com and may have been edited ([ ]), abridged (…) and/or reformatted (some sub-titles and bold/italics emphases) for the sake of clarity and brevity to ensure a fast and easy read. This paragraph must be included in any article re-posting to avoid copyright infringement.]Kimble goes on to say in further edited excerpts: The chart below, created by Doug Short, reflects the average of four market valuation indicators over the past 100 years.
|
| Posted: 01 Feb 2014 07:00 AM PST The "global economy" has a new manager — Janet Louise Yellen. For various reasons, the previous 14 Fed chairmen failed to solve all the world's problems. In some cases, new problems arose. But maybe now that a woman has been appointed… the world's problems will be solved once and for all. Here's hoping Ms. Yellen starts off the Fed's second century with an omniscient bang, eh? Yellen is the QE candidate… keeper of the status quo… proud poster lady of the Ph.D. standard. [L]ocate your "good side" before you accept Time magazine's Person of the Year award. You're going to want to frame that issue. According to The Wall Street Journal, Yellen has consistently been a more accurate forecaster of doom than all her colleagues. After reviewing over 700 statements, the Journal ranked the current Fed's 14 board members by how well they forecasted growth, inflation and labor markets. Yellen was No. 1 overall. The hapless Ben Bernanke? Well, he came in 10th. If we've done our math correctly, Yellen should be 10 times more effective manning the spigot. Even so, we'd like to give the soon-to-be chairwoman some friendly advice… [Sound of desk drawer sliding open... your editor shamelessly pulls out a copy of 7 Habits for Highly Successful Central Bankers, by The Daily Reckoning.] Ahem. Janet, you're in a hairier situation than some of your predecessors who took their place at the helm of the committee… [Thumbs through a few pages.] Accordingly, since you're inheriting a pent-up crisis, you might have to go through these motions faster than others before you. Maybe even duck out before your first term ends. But let's start from the beginning: First, ride the wave in the good times. Take direct credit for all positive economic developments. At the same time, when faced with low growth or high unemployment, claim that monetary policy's not a panacea. It's important to keep a straight face while doing this (it might be hard at first, but keep trying. It gets easier. Practicing in front of a mirror helps). Next, endear yourself to the media by holding too many press conferences. That way, they'll give you a nifty nickname like "The Maestro" or "The Hero." (Here, we make our own forecast…yours will be the ever imaginative "Wonder Woman"… or some reference to The Rocky Horror Picture Show… depending, of course, on how the economy fares early under your direction.) Third, locate your "good side" before you accept Time magazine's Person of the Year award. You're going to want to frame that issue. All the while, mind you, you should be keeping one eye on the warning light. That's step four. After all, the economy will only go downhill the week after Time hits newsstands. You don't want to stick around for any of that. The fifth step, then, is to realize exactly when your policies are about to backfire (i.e., your cue to jump ship). Announce that you think the Fed is best served by someone else. Make it about "the economy," not you. Then, once you're free and clear, lay low for a year. When it feels right, follow step six: Begin writing the book about all the ways your successors should fix the problems that arose under your guidance. [Flips the book closed... and looks up.] Once you finish steps one through six, step seven is easy: Collect the multimillion-dollar advance from your publisher, pop open a glass of bubbly and… (Bonus, step eight: crack a wry smile and wink at yourself in the mirror)… toast the world to a job well done. Oh, and one more thing, Janet. Remember your Shania Twain… "The best part of being a woman is the prerogative to have a little fun." If the Fed needs any institutional change right now, it's to loosen the tie a little bit… Bonne chance Janet, Peter Coyne P.S. In case you missed it, we recently received an exclusive inside look at the oath Ms. Yellen had to recite before she could officially take over as head of Federal Reserve. At the very least, we think it's worth a chuckle. Be sure to check it out here. |
| Jeff Lewis: Price manipulation awareness may keep the mainstream away Posted: 01 Feb 2014 05:59 AM PST 10:53a SRT Saturday, February 1, 2014 Dear Friend of GATA and Gold: While the recent acknowledgment by the Financial Times of the likely fraud of "paper gold" was remarkable, Jeff Lewis of Silver Coin Investor writes, the mainstream financial news media probably won't recognize what it means any more than they have recognized what the scandal of LIBOR rigging meant. His commentary is headlined "Price Manipulation Awareness May Keep the Mainstream Away" and it's posted at Silver Coin Investor here: http://www.silver-coin-investor.com/Price-Manipulation-Awareness-May-Kee... CHRIS POWELL, Secretary/Treasurer ADVERTISEMENT How to profit with silver -- Future Money Trends is offering a special 16-page silver report with our forecast for 2013 that includes profiles of nine companies and technical analysis of their stock performance. Six of the companies have market capitalizations of less than $800 million and one company has a market cap of only $30 million. The most exciting of these companies will begin production in a few weeks and has a market cap of just $150 million. Half of all proceeds from the sale of this report will be donated to the Gold Anti-Trust Action Committee to support its efforts exposing manipulation and fraud in the gold and silver markets. To learn about this report, please visit: http://www.futuremoneytrends.com/index.php?option=com_content&id=376&tmp... Join GATA here: Mines and Money Hong Kong http://www.minesandmoney.com/hongkong/ * * * Support GATA by purchasing DVDs of our London conference in August 2011 or our Dawson City conference in August 2006: http://www.goldrush21.com/order.html Or by purchasing a colorful GATA T-shirt: Or a colorful poster of GATA's full-page ad in The Wall Street Journal on January 31, 2009: http://gata.org/node/wallstreetjournal Help keep GATA going GATA is a civil rights and educational organization based in the United States and tax-exempt under the U.S. Internal Revenue Code. Its e-mail dispatches are free, and you can subscribe at: To contribute to GATA, please visit: ADVERTISEMENT Buy metals at GoldMoney and enjoy international storage GoldMoney was established in 2001 by James and Geoff Turk and safeguards more than $1.7 billion in metals and currencies. Buy gold, silver, platinum, and palladium from GoldMoney over the Internet and store them in vaults in Canada, Hong Kong, Singapore, Switzerland, and the United Kingdom, taking advantage of GoldMoney's low storage rates, among the most competitive in the industry. GoldMoney also offers delivery of 100-gram and 1-kilogram gold bars and 1-kilogram silver bars. To learn more, please visit: http://www.goldmoney.com/?gmrefcode=gata |
| U.S. Treasury Bonds Defying Dire Forecasts Posted: 01 Feb 2014 03:36 AM PST There was no doubt about it in 2013. If the Fed were ever to cut back on its five years of massive QE bond-buying, bond prices would collapse. It made sense. Of the $85 billion a month of QE, $40 billion was in mortgage-backed securities, and $45 billion in Treasury bonds. |
| Gold Stocks Ditch the Risk and Embrace the Upside Posted: 01 Feb 2014 03:18 AM PST Adrian Day likes to think long term, and historical trends persuade him that the bull market in gold should continue for years to come. In this interview with The Gold Report, the founder of Adrian Day Asset Management explains why he expects a significant gold price recovery in the near future. In the short term, he counsels investors to choose companies that minimize risk through royalty agreements, joint ventures and robust balance sheets. In other words, companies with the means to seize profit-making opportunities, and Day shares the names of a handful that fit the bill. |
| Turning Point in Junior Gold Mining Stocks? Posted: 01 Feb 2014 03:14 AM PST It's not exactly news that gold mining stocks have been in a slump for more than two years. Many investors who owned them have thrown in the towel by now, or are holding simply because a paper loss isn't a realized loss until you sell. For contrarian speculators like Doug Casey and Rick Rule, though, it's the best of all scenarios. "Buy when blood is in the streets," investor Nathan Rothschild allegedly said. And buy they do, with both handsâ€"because, they assert, there are definitive signs that things may be turning around. |
| Tapering Blues for Gold and Silver Posted: 01 Feb 2014 03:02 AM PST The second tapering reduction, a further $10bn per month, was announced this week. It was we are told by the news channels fully expected. This is probably the initial reason why US Treasury prices rose on the news, because bears would have bought back their positions. However, weakness in emerging market currencies indicates that there is a safe-haven element developing in US Treasury bond prices. |
| Central Bank gold reserves transparency Posted: 01 Feb 2014 01:50 AM PST Perth Mint |
| Silver and Gold Prices - Rangebound Before the Storm Posted: 31 Jan 2014 09:50 PM PST Jeffrey Lewis |
| Gold-shorting orders were filed just before Fed communique, Maguire says Posted: 31 Jan 2014 09:15 PM PST 2:10a SRT Saturday, February 1, 2014 Dear Friend of GATA and Gold: London metals trader and market-rigging whistleblower Andrew Maguire tells King World News that central banks, likely the Federal Reserve and Bank for International Settlements, put their big shorting orders into the gold market just before the Fed's communique this week: http://kingworldnews.com/kingworldnews/KWN_DailyWeb/Entries/2014/1/31_Ma... CHRIS POWELL, Secretary/Treasurer ADVERTISEMENT Jim Sinclair plans seminar in Austin Gold advocate and mining entrepreneur Jim Sinclair will hold his next market seminar from 2 to 6 p.m. Saturday, February 8, at the Austin, Texas, Airport Hilton. Advance registration is required. Details are posted at JSMineSet.com here: http://www.jsmineset.com/2014/01/02/austin-texas-qa-session-confirmed/ Join GATA here: Mines and Money Hong Kong http://www.minesandmoney.com/hongkong/ * * * Support GATA by purchasing DVDs of our London conference in August 2011 or our Dawson City conference in August 2006: http://www.goldrush21.com/order.html Or by purchasing a colorful GATA T-shirt: Or a colorful poster of GATA's full-page ad in The Wall Street Journal on January 31, 2009: http://gata.org/node/wallstreetjournal Help keep GATA going GATA is a civil rights and educational organization based in the United States and tax-exempt under the U.S. Internal Revenue Code. Its e-mail dispatches are free, and you can subscribe at: To contribute to GATA, please visit: ADVERTISEMENT A Personal Touch in Buying Precious Metals If you've not secured your allocation of precious metals and numismatic coins, 2014 may be the last year to get them at affordable and undervalued prices. With huge amounts of gold leaving the West for Asia, the future availability of precious metals is very much in doubt. All Pro Gold has competitive pricing on all bullion and numismatic products -- and offers prompt delivery too. Long-time GATA supporters Fred Goldstein and Tim Murphy are glad to answer any questions or concerns about acquiring the monetary metals. All Pro Gold has an extensive electronic library of articles from the world's top market analysts. Learn more at www.allprogold.com or write to Fred and Tim at info@allprogold.com or telephone them at 1-855-377-4653. |
| 78% of NFL Players Go Bankrupt Within 5 Years & NBA Players In… Posted: 31 Jan 2014 08:45 PM PST The average professional athlete in the U.S. will make more in one season than most So writes Jason Cimpl (www.wyattresearch.com) in edited excerpts from his original article* entitled Five Reasons Professional Athletes Go Broke. This post is presented compliments of Lorimer Wilson, editor of www.munKNEE.com and www.FinancialArticleSummariesToday.com and may have been edited ([ ]), abridged (…) and/or reformatted (some sub-titles and bold/italics emphases) for the sake of clarity and brevity to ensure a fast and easy read. Please note that this paragraph must be included in any article re-posting to avoid copyright infringement.Cimpl goes on to say in further edited excerpts: If data from Mint.com is accurate, the average athlete is destined to go (quickly) from fame to shame. Here are five possible reasons why: 1 – Overspending 2 – Career duration We all have read analysis after analysis that just doesn't make the cut but those of Dr. Nu Yu do. If you only have the money to subscribe to one investment newsletter then Nu Yu's MarketSectorTA report is the one! Check it out.
3 – A lack of finance knowledge Athletes see prominent people spending money, and they believe that their spending pattern should be the same. However, athletes fail to take into account that those prominent members have spent a lifetime learning about financial responsibility and budget strategies. “Follow the munKNEE” and get every article posted:viahttps://twitter.com/munknee or @munknee or #munknee orhttps://www.facebook.com/lorimer.wilson (Click on Timeline) orour FREE newsletter oran RSS feedDon’t forget to “tweet” or “like” those articles you wish to share with others4 – Poor investment decisions 5 – Hangin' with a bad crowd A few quick thoughts of my own [It is very disconcerting] if the NFL and NBA data is correct. That’s a high rate of bankruptcy, and the leagues should provide better guidance for its atheletes….[Unfortunately,] professional athletes are easy targets. They are highly visible, have lots of money and limited experience.Though I find it hard to imagine losing millions of dollars in savings in such a short span of time, I also have a solid financial background, applicable work experience and a family that educated me on personal finance issues. Before pointing the finger at athletes, it may be wise to step into their shoes (cleats) for a minute … maybe their financial woes aren't entirely their fault or a result of reckless spending. My colleague Ian Wyatt recently launched a new website aimed at helping young adults (and older ones, too) learn more about financial basics. His site, Investor Bistro, is a great resource for those just getting started – or who need a quick refresher – in their journey of saving toward retirement. Maybe an athlete or two should check it out as well. Editor's Note: The author's views and conclusions in the above article are unaltered and no personal comments have been included to maintain the integrity of the original post. Furthermore, the views, conclusions and any recommendations offered in this article are not to be construed as an endorsement of such by the editor. *http://www.wyattresearch.com/article/five-reasons-professional-athletes-go-broke/29606; ©2013 Wyatt Investment Research & Business Financial Publishing LLC (If you would like to learn how you can bank steady gains with well-timed investments in stocks that are ready to run… then consider taking a free, 30-day trial to our growth stock service, Top Stock Insights. You’ll discover exactly how we’re earning exceptional returns and get instant access to every special report and investment recommendation. Click here to try Top Stock Insights, free.) Related Articles: 1. Stop Denying the Reality of Your Life Situation & Start Dealing With It – Here Are 14 Things to Do Let's Stop Fooling Ourselves!…The American experience of rising standards of living and general prosperity have always rested upon a deep and healthy middle class….[one] of earnings and savings, not credit and borrowing… Simply continuing along the status quo is a vote for digging ourselves deeper as the constraints of the future arrive. Behavior change is necessary in order to improve our chances. [This article presents 14] prudent behaviors to adopt…as we start trending back towards more historic baselines. Words: 1340 2. In Debt? Kick it to the Curb, Get Rich, and Start Living Life to the Fullest! Here's How If you're among those struggling with debt and just want to be rid of it and move on with your life, it can be helpful to find some information and inspiration from others who are financial experts or people working to pay off substantial amounts of debt. You'll find all of that, and more, in these inspirational personal finance blogs that can offer you advice, motivation, and guidance in paying down your debts so you can start putting that money to other uses. Words: 1010 3. Guess What % of Americans STILL Have More Credit Card Debt Than Savings The economy is slowly hobbling back to health but for many Americans the rainy day fund is still looking a little dry, the credit card bill is still looking a little scary [Unfortunately, the liklihood is that,] as the economy strengthens further, many Americans will…spend their new found extra cash rather than save it. Words: 474 4. New Consumer Earnings & Spending Data Show U.S. & E.U. Citizens Living Way Beyond Their Means The west is living far beyond its means and is struggling with pitifully anemic growth. This is a long-term trend, and one that is only going to accelerate. Nevertheless, as obvious as the indicators may be, few people will actually do anything about it. A lifetime of propaganda will plant many heads in the sand, ignoring the dangers and opportunities all around. [Let's take a close look at just what these indicators are.] Words: 311 5. Addiction to Credit Card Debt Remains Excessive Albeit Declining – Here are the Facts Households with credit card debt carry $16,000 at an average rate of 15% and, given that some households have little credit card debt, you can imagine how high the debt is for others.. Imagine, $16,000, but that is actually down by 17% as the grand American household deleveraging continues. [Be that as it may, credit card debt is still excessive with all ages and all income groups. Here are the facts.] Words: 760 6. 75% of Americans are in Deep _ _ _t! Rising education and medical costs, on-going credit card interest payments, well used personal lines of credit and large mortgage debt and home equity loans – most a penchant for living beyond their means – is keeping 75% of American households in some degree of debt. Take a look and then pass it on to your friends, neighbors and co-workers. 7. And You Wonder Where Your Money Goes! Here're the Costs of Living in the USA The median household income in the U.S. is $51,914, according to U.S. Census Bureau data. To find out just where that cash is going, we've trolled through the latest data in employment, transportation, and common consumer expenditures. [Here it is.] 8. How the Poor, Middle Class and Rich Spend Their Money How do Americans spend their money and how do budgets change across the income spectrum? The graph below answers these questions. Words: 240 9. The True Cost of Car Ownership is….OUCH! We all know that the true cost of a car doesn't end at it's purchase price but most people don't really know what the annual cost will actually amount to. The next time you are shopping for a car consider these additional costs. More than 25% of American workers (33% of those in their 40s) with 401(k) and other retirement savings accounts use them to pay current expenses, new data show, [which is] undermining already shaky retirement security for millions of Americans. With federal policymakers eyeing cuts to Social Security benefits and Medicare to rein in soaring federal deficits, and traditional pensions in a long decline, retirement savings experts say the drain from the accounts has dire implications for future retirees. Words: 890 11. Don't Even Think About It – Touching Your 401(k) That Is! Look, if you're absolutely stuck right now, then you've got to do what's necessary but, in my opinion, you should avoid 401(k) hardship withdrawals at all costs … and think long and hard before you consider borrowing against your future retirement. With so many people nearing retirement already grossly underfunded [such actions are] going to prove catastrophic down the line. Words: 1043 12. Life Insurance: a Pot of Gold or Ready Cash? A life insurance policy is intended to provide your family with a sizable amount of money should you meet an untimely death and, as such, can be said to be a something of a an ultimate bonanza – a pot of gold, if you will. Most people, however, think the only way to get money from a life insurance policy is to die but there is another way should your circumstances change and that is called a life settlement. In this article I provide you with some insider insights on how to go about negotiating the maximize payout on such a settlement. Words: 851 13. Is Your Household One of the 51% Projected to be at Risk in Retirement? Many Americans are reacting to the economic downturn not by resolving to save more but by no longer actively planning for retirement. "That's exactly the opposite of what they should be doing,'' said Paul Ballew, senior vice president at Nationwide Insurance. Words: 369 Visit wsj.com – HERE – to find their calculator which shows where your household income stands compared to others in the U.S.. $506,000 puts you in the top 1%; the much talked about $250,00 in the top 6%; $200,000 in the top 10% while an annual salary of $43,000 puts you in the top/bottom 50%. Where do you stand? 15. Home "Owners": Here Are 10 Advantages to Paying Off Your Mortgage Early Paying off the mortgage early is an idea with obvious appeal, but not one that many middle-class home "owners" pursue. If your interest rate is so good that the bank just made a bad bet in giving you that low rate, you might want to continue enjoying the benefits as long as possible. In many other circumstances, however, paying off the mortgage can be a fine money management move indeed. [Below are 10 sound reasons to do so.] Words: 1588 16. Is $1,000,000 Enough to Provide for a Successful 30-year Retirement? Withdrawing from a $1,000,000 nest egg upon retirement using the familiar 4% rule to generate a successful 30-year inflation-adjusted (3% per annum) retirement proved to be totally inadequate as per the retirement withdrawal strategy that I put forth in a previous article (1). In fact, it crashed and burned in year 25 of the 30-year plan! In fact, as I show in this article, it will only succeed if your portfolio outperforms the S&P 500 by 5% every year for 30 straight years – and what is the likelihood of that? Words: 1533 17. Don't be Cheap, be Frugal! Here are 10 Ways to Get More for Your Money Frugality often gets a bad rap. Many people misunderstand frugality and assume that it's nothing more than being "cheap" when, in reality, frugality is making sure that you get the most from the money and resources you have, even if they are limited. [Here are 10 ways to do just that.] Words: 1132 |
| Former US Treasury Official - US Engineering Financial Chaos Posted: 31 Jan 2014 03:54 PM PST  Today a former US Treasury official told King World News that the United States government is purposefully creating financial chaos all over the world in order to destabilize enemy countries and create a flight into the US dollar. This is an incredibly important interview, where the former US Treasury official lays out exactly what Washington and the US Fed are intentionally doing to the world in this powerful interview. Today a former US Treasury official told King World News that the United States government is purposefully creating financial chaos all over the world in order to destabilize enemy countries and create a flight into the US dollar. This is an incredibly important interview, where the former US Treasury official lays out exactly what Washington and the US Fed are intentionally doing to the world in this powerful interview.This posting includes an audio/video/photo media file: Download Now |
| Gold Lost $2.10 Today to Close at $1,240.10 Posted: 31 Jan 2014 02:55 PM PST Gold Price Close Today : 1,240.10 Gold Price Close 24-Jan-14 : 1,264.50 Change : -24.40 or -1.9% Silver Price Close Today : 19.105 Silver Price Close 24-Jan-14 : 19.473 Change : -36.80 or -1.9% Gold Silver Ratio Today : 64.910 Gold Silver Ratio 24-Jan-14 : 64.936 Change : -0.026 or 0.0% Silver Gold Ratio : 0.01541 Silver Gold Ratio 24-Jan-14 : 0.01540 Change : 0.00001 or 0.0% Dow in Gold Dollars : $ 261.69 Dow in Gold Dollars 24-Jan-14 : $ 260.29 Change : 1.40 or 0.5% Dow in Gold Ounces : 12.659 Dow in Gold Ounces 24-Jan-14 : 12.592 Change : 0.07 or 0.5% Dow in Silver Ounces : 821.71 Dow in Silver Ounces 24-Jan-14 : 817.66 Change : 4.06 or 0.5% Dow Industrial : 15,698.85 Dow Industrial 24-Jan-14 : 15,922.27 Change : -223.42 or -1.4% S&P 500 : 1,782.59 S&P 500 24-Jan-14 : 1,794.23 Change : -11.64 or -0.6% US Dollar Index : 81.370 US Dollar Index 24-Jan-14 : 80.455 Change : 0.92 or 1.1% Platinum Price Close Today : 1,374.10 Platinum Price Close 24-Jan-14 : 1,427.10 Change : -53.00 or -3.7% Palladium Price Close Today : 703.00 Palladium Price Close 24-Jan-14 : 733.90 Change : -30.90 or -4.2% The GOLD PRICE lost $2.10 today to close at $1,240.10. Silver lost 6/10 cent to end on Comex at 1910.5c. The gold price closed lower this week than last, breaking a five week winning streak. Also stopped short of the 20 week moving average. Best I can say is that on the daily chart gold remains above its 50 DMA ($1,235.41). Frankly, I can't parse this divergence between silver and GOLD PRICES. Which is right, the stronger gold price or the weaker silver price? Gold's MACD is about to flash a sell signal, so maybe gold will catch up with silver. The SILVER PRICE also closed lower on a weekly basis, down three of the last six weeks, and the last two weeks running. Today's silver low came at 1907c, and really doesn't tell us much after yesterday's close. Any break below 1897c will carry silver lower. Next week gold needs to hold on above $1,210.00. Platinum and palladium are tying an anchor around gold's ankles so they need to turn up, too, before gold can rally. Looking at the weekly scorecard forces me to ask whether the stock market's dive means that the peak we have seen is the final one, marking a 300 year top. I'm thinking. I'll let y'all know. Picture in precious metals has not yet cleared. US dollar index has resumed rising. Let's talk hard and fast today. Stocks bounce yesterday was probably engineered by the NGM, since they lost yesterday's gains and then some today. Milestone comes when the Dow crosses below its 200 DMA (15,466) -- and stays there. Same marker for the S&P500 is 1706.44. Today the Dow scraped off another 149.76 (0.94%) to end at 15,698.85. S&P500 gave back 11.6 (0.65%) to 1,782.59. Both silver and gold prices fell today but stocks fell more, pulling down the Dow measured in metals. Dow in gold ended the day at 12.66 oz, down 0.67% Dow in silver lost 7.62 oz (0.92%) to 821.07%. Still above 20 and 50 DMA, reflecting silver's weakness against gold. US dollar index jumped 53 basis points yesterday, and another 18 (0.22%) to 81.37 today. This brings it back to the 200 DMA at 81.51. Indicators have turned up, so maybe the dollar can breach that 200 DMA this time. Euro looks puking sick. Gapped down two days running, lost another 0.49% today to $1.3489. Yen resumed its rise, up 0.68% to 98.01 cents/Y100. Y'all enjoy your weekend! Argentum et aurum comparenda sunt -- -- Gold and silver must be bought. - Franklin Sanders, The Moneychanger The-MoneyChanger.com © 2014, The Moneychanger. May not be republished in any form, including electronically, without our express permission. To avoid confusion, please remember that the comments above have a very short time horizon. Always invest with the primary trend. Gold's primary trend is up, targeting at least $3,130.00; silver's primary is up targeting 16:1 gold/silver ratio or $195.66; stocks' primary trend is down, targeting Dow under 2,900 and worth only one ounce of gold or 18 ounces of silver. or 18 ounces of silver. US $ and US$-denominated assets, primary trend down; real estate bubble has burst, primary trend down. WARNING AND DISCLAIMER. Be advised and warned: Do NOT use these commentaries to trade futures contracts. I don't intend them for that or write them with that short term trading outlook. I write them for long-term investors in physical metals. Take them as entertainment, but not as a timing service for futures. NOR do I recommend investing in gold or silver Exchange Trade Funds (ETFs). Those are NOT physical metal and I fear one day one or another may go up in smoke. Unless you can breathe smoke, stay away. Call me paranoid, but the surviving rabbit is wary of traps. NOR do I recommend trading futures options or other leveraged paper gold and silver products. These are not for the inexperienced. NOR do I recommend buying gold and silver on margin or with debt. What DO I recommend? Physical gold and silver coins and bars in your own hands. One final warning: NEVER insert a 747 Jumbo Jet up your nose. |
| Gold Lost $2.10 Today to Close at $1,240.10 Posted: 31 Jan 2014 02:55 PM PST Gold Price Close Today : 1,240.10 Gold Price Close 24-Jan-14 : 1,264.50 Change : -24.40 or -1.9% Silver Price Close Today : 19.105 Silver Price Close 24-Jan-14 : 19.473 Change : -36.80 or -1.9% Gold Silver Ratio Today : 64.910 Gold Silver Ratio 24-Jan-14 : 64.936 Change : -0.026 or 0.0% Silver Gold Ratio : 0.01541 Silver Gold Ratio 24-Jan-14 : 0.01540 Change : 0.00001 or 0.0% Dow in Gold Dollars : $ 261.69 Dow in Gold Dollars 24-Jan-14 : $ 260.29 Change : 1.40 or 0.5% Dow in Gold Ounces : 12.659 Dow in Gold Ounces 24-Jan-14 : 12.592 Change : 0.07 or 0.5% Dow in Silver Ounces : 821.71 Dow in Silver Ounces 24-Jan-14 : 817.66 Change : 4.06 or 0.5% Dow Industrial : 15,698.85 Dow Industrial 24-Jan-14 : 15,922.27 Change : -223.42 or -1.4% S&P 500 : 1,782.59 S&P 500 24-Jan-14 : 1,794.23 Change : -11.64 or -0.6% US Dollar Index : 81.370 US Dollar Index 24-Jan-14 : 80.455 Change : 0.92 or 1.1% Platinum Price Close Today : 1,374.10 Platinum Price Close 24-Jan-14 : 1,427.10 Change : -53.00 or -3.7% Palladium Price Close Today : 703.00 Palladium Price Close 24-Jan-14 : 733.90 Change : -30.90 or -4.2% The GOLD PRICE lost $2.10 today to close at $1,240.10. Silver lost 6/10 cent to end on Comex at 1910.5c. The gold price closed lower this week than last, breaking a five week winning streak. Also stopped short of the 20 week moving average. Best I can say is that on the daily chart gold remains above its 50 DMA ($1,235.41). Frankly, I can't parse this divergence between silver and GOLD PRICES. Which is right, the stronger gold price or the weaker silver price? Gold's MACD is about to flash a sell signal, so maybe gold will catch up with silver. The SILVER PRICE also closed lower on a weekly basis, down three of the last six weeks, and the last two weeks running. Today's silver low came at 1907c, and really doesn't tell us much after yesterday's close. Any break below 1897c will carry silver lower. Next week gold needs to hold on above $1,210.00. Platinum and palladium are tying an anchor around gold's ankles so they need to turn up, too, before gold can rally. Looking at the weekly scorecard forces me to ask whether the stock market's dive means that the peak we have seen is the final one, marking a 300 year top. I'm thinking. I'll let y'all know. Picture in precious metals has not yet cleared. US dollar index has resumed rising. Let's talk hard and fast today. Stocks bounce yesterday was probably engineered by the NGM, since they lost yesterday's gains and then some today. Milestone comes when the Dow crosses below its 200 DMA (15,466) -- and stays there. Same marker for the S&P500 is 1706.44. Today the Dow scraped off another 149.76 (0.94%) to end at 15,698.85. S&P500 gave back 11.6 (0.65%) to 1,782.59. Both silver and gold prices fell today but stocks fell more, pulling down the Dow measured in metals. Dow in gold ended the day at 12.66 oz, down 0.67% Dow in silver lost 7.62 oz (0.92%) to 821.07%. Still above 20 and 50 DMA, reflecting silver's weakness against gold. US dollar index jumped 53 basis points yesterday, and another 18 (0.22%) to 81.37 today. This brings it back to the 200 DMA at 81.51. Indicators have turned up, so maybe the dollar can breach that 200 DMA this time. Euro looks puking sick. Gapped down two days running, lost another 0.49% today to $1.3489. Yen resumed its rise, up 0.68% to 98.01 cents/Y100. Y'all enjoy your weekend! Argentum et aurum comparenda sunt -- -- Gold and silver must be bought. - Franklin Sanders, The Moneychanger The-MoneyChanger.com © 2014, The Moneychanger. May not be republished in any form, including electronically, without our express permission. To avoid confusion, please remember that the comments above have a very short time horizon. Always invest with the primary trend. Gold's primary trend is up, targeting at least $3,130.00; silver's primary is up targeting 16:1 gold/silver ratio or $195.66; stocks' primary trend is down, targeting Dow under 2,900 and worth only one ounce of gold or 18 ounces of silver. or 18 ounces of silver. US $ and US$-denominated assets, primary trend down; real estate bubble has burst, primary trend down. WARNING AND DISCLAIMER. Be advised and warned: Do NOT use these commentaries to trade futures contracts. I don't intend them for that or write them with that short term trading outlook. I write them for long-term investors in physical metals. Take them as entertainment, but not as a timing service for futures. NOR do I recommend investing in gold or silver Exchange Trade Funds (ETFs). Those are NOT physical metal and I fear one day one or another may go up in smoke. Unless you can breathe smoke, stay away. Call me paranoid, but the surviving rabbit is wary of traps. NOR do I recommend trading futures options or other leveraged paper gold and silver products. These are not for the inexperienced. NOR do I recommend buying gold and silver on margin or with debt. What DO I recommend? Physical gold and silver coins and bars in your own hands. One final warning: NEVER insert a 747 Jumbo Jet up your nose. |
| Posted: 31 Jan 2014 02:34 PM PST There is a fundamental incompatibility between the attainment of global economic stability and having a single national currency perform the role of the world’s reserve currency. This is hardly a new revelation. But events of the past few months have brought this topic back into the spotlight. Belgian born American economist Robert Triffin first highlighted this incompatibility in the 1960s. He observed that having the US dollar perform the role of the world’s reserve currency created fundamental conflicts of interest between domestic and international economic objectives. On the one hand, the international economy needed dollars for liquidity purposes and to satisfy demand for reserve assets. But this forced, or at least made it easy, for the US to run consistently large current account deficits. Triffin argued that such persistent deficits would eventually put pressure on the dollar and lead to the demise of the Bretton Woods system of international exchange. The Triffin Dilemma, therefore, argued that the demands on an international currency meant that excess supply would undermine its value. After WWII the Bretton Woods international monetary system came into being. This was a fixed rate currency regime with the dollar as the global reserve currency. But to ensure stability and financial discipline, the major currencies were fixed to the dollar and the dollar was fixed to gold at the rate of US$35 an ounce. This is where the Triffin Dilemma kicked in. The US soon understood that reserve currency status allowed them to run large deficits. The deficits were ‘paid’ for by issuing dollars. When the excess dollars began showing up in global central banks, they began converting their dollars into gold. This lowered the value of the US dollar in relation to gold. At first the authorities tried to manage the Dilemma. In 1961 they established the ‘London Gold Pool’ in an attempt to keep the dollar price of gold to $35 an ounce. This system worked for a while but fell apart by 1968 when France withdrew from the Pool. The various nations then attempted to preserve the Bretton Woods system by maintaining a two-tiered gold market; one operating at the official $35 an ounce price while another traded gold at the market price, which was well above $35. Of course such a policy was completely unsustainable and it too failed. Bretton Woods was on its last legs. President Nixon ended the system once and for all when in August 1971 he suspended the convertibility of dollars into gold. From that point on, the dollar was without an anchor and the global monetary system went from a fixed to floating regime. What followed was a decade of monetary instability and record high inflation. Perhaps surprisingly, the dollar maintained its role as the world’s reserve currency throughout the decade. Due to its economic and military might, the reserve currency status of the dollar actually grew in acceptance throughout the next few decades. But Triffin’s Dilemma never went away. It did remain out of sight though as parties on both sides of the equation enjoyed the mutual benefits of the dollar’s reserve status. The US benefitted by paying for imports with essentially costless dollars. In turn, the US’ main trading partners enjoyed robust demand for their products, creating employment and income growth. The huge deficits brought about by excess US consumption produced a massive amount of liquidity throughout the global economy. While Triffin’s Dilemma would have predicted a collapse of the dollar because of the glut of dollars in the system, such an outcome didn’t eventuate. This was primarily because the beneficiaries of US consumption didn’t want it to end. So they reinvested their excess dollars back into US asset markets, notably US Government debt. Such actions supported the dollar, kept interest rates low, and perpetuated the imbalances. Some commentators called this apparent happy state of affairs ‘Bretton Woods II.’ As the saying goes, markets make opinions and this was a flawed opinion born out of an ignorance of what brought the first Bretton Woods system undone. The underlying conflicts identified by the Triffin Dilemma always remained. The ease with which the US could borrow and create debt was tolerated for decades. No doubt such tolerance was due to gold no longer being a monetary anchor. But in 2007 it reached a point where it could no longer be tolerated. Not because investors decided to be prudent, but because the market structure could no longer cope with more debt. At this point, the end of the decades long US driven credit expansion turned abruptly into a contraction and asset markets collapsed. Amongst the carnage, the dollar was about the only asset to increase in value relative to everything else. This was because previously abundant global liquidity rapidly evaporated and returned to the source, pushing up the value of the dollar. The point here is that in times of crisis, the US dollar trades as the world’s reserve currency, not based on its domestic fundamentals, which are just as bad as other countries. That’s what you saw in late 2008 early 2009. So the Triffin Dilemma is beginning to rear its head again. The US domestic political preference is for a weaker dollar to stimulate exports and create employment. But the international situation, being market driven, is more powerful. The dollar is therefore strengthening relative to other currencies while the U.S. economy is still weak. In the past the US response to this currency strength would have been to lower interest rates and turn on the liquidity taps. This would have increased credit growth domestically and liquidity internationally (think of all those US treasuries piling up in foreign central banks when US economic growth is strong). But the interest rate ammunition has been spent. Like every other country, the US needs a weaker currency. However a global reserve currency operates under different rules to ordinary currencies. In times of global uncertainty, like now, the US dollar will be strong regardless of its fundamentals. With the Euro-zone under pressure, the reserve asset of choice remains the US dollar. Perversely, this will allow the US authorities to pursue even more reckless policies in their attempts to provide global liquidity. The inherent conflicts in the global monetary system that led to the great financial crisis have not been addressed. The dollar has served as the world’s reserve currency, without being linked to gold, since 1971. While on the surface the experiment has been a success, the legacy is a huge buildup of debt. The need for global liquidity creates an incentive for the US to live beyond its means and run up debt levels. Perversely, the debts sit in the vaults of foreign central banks and masquerade as assets. (It is from this asset base that domestic banking systems generate their own credit growth). But debt levels have reached a point where this system no longer works properly. The crisis of 2008 has quickly given way to the European sovereign debt crisis of 2010. They were just a sign of things to come. The implications for you as an investor are many. Expect continued uncertainty and volatility as the world increasingly recognises the current financial system has reached its use by date. This is a gradual and subtle process. You won’t see this recognition splashed across the front pages anytime soon. But it is happening now. In the short term you should expect continuing loose monetary policy out of the US and a lack of fiscal discipline. Of course, the big picture investment implication here is that the US dollar will eventually lose its role as the world’s sole reserve currency. This is a multi year event and certainly difficult to assess in terms of the effect on markets. The IMF is already holding discussions about making changes to the financial architecture. Very few people understand the magnitude of what is going on, but it hasn’t been lost on the gold market. Gold will be one of the major beneficiaries of change. Back in the 1960s Robert Triffin warned about the dollar glut and the fact that it would bring the Bretton Woods system undone. He was right. The rising gold price was the first warning sign of the system’s weakness. So the best way to profit from this instability is to own physical bullion (not ETF’s or gold certificates). For a longer term bet on forthcoming changes to the financial system, you should be looking to buy gold on weakness. Regards, Greg Canavan Ed. Note: If the excessive money printing of various central banks around the world has taught us anything, it’s that there is no substitute for sound money. And as to that, gold is historically proven to be the best example of that. Readers of The Daily Reckoning email edition know that fact better than most. And they receive regular commentary on that and a variety of topics. If you’d like to join them, you can sign up for FREE right here. |
| Credit Suisse Sees Gold Price At $1,000 Posted: 31 Jan 2014 01:41 PM PST This is an infographic which represents the view of the Credit Suisse commodities research team. It shows the bearish case for gold in 2014. While our view is that some of the elements are correct, in particular chart 1, 2 and 4, we believe that exploding Chinese demand (chart is missing on the infographic) and the brewing systemic risk (chart 3) do represent solid counter arguments. From Credit Suisse:
|
| Gold Daily and Silver Weekly Charts - Next Stop, February Posted: 31 Jan 2014 01:12 PM PST |
| Gold Daily and Silver Weekly Charts - Next Stop, February Posted: 31 Jan 2014 01:12 PM PST |
| Silver Shines at the Super Bowl Posted: 31 Jan 2014 12:48 PM PST When the Seattle Seahawks battle the Denver Broncos in Super Bowl XLVIII on Sunday, the teams will be in a struggle for the honor of hoisting the National Football League's most sought after prize, the championship Vince Lombardi Trophy. The 7-pound silver trophy, created by the silversmiths at Tiffany & Co., brings with it its own beauty, the result of talented design and dedicated craftsmanship. During what promises to be one of the coldest Super Bowls ever, the 80,000 fans in attendance may be looking for another silver lining, courtesy of the NFL. Along with a commemorative seat cushion, each attendee will receive a Warm Welcome Kit, including hand and foot warmers, a hand muffler like the ones used by NFL quarterbacks, ear muffs, lip balm, and texting gloves. Most effective texting gloves have silver elements, such as conductive threads woven into the fingertips, enabling wearers to use their smart phone screens without exposing their hands to the cold weather. Touch screens found in smart phones and tablets are activated by a low level of electricity — a person's skin, for example, or the silver threads in the glove. Silver, among its many valuable properties, is highly conductive of electricity. As such, silver has proven virtually indispensable in almost all electronic devices, including smart phones, laptops, and tablets. "While the fans are using their texting gloves to contact friends back home, much of the equipment and electronic systems used to broadcast the Super Bowl around the world will rely on silver components," according to Michael DiRienzo, Executive Director of the Silver Institute. This is a news release by The Silver Institute, a nonprofit international industry association advocating the value and many uses of silver. Its members include leading silver producers, prominent silver refiners, manufacturers and dealers. For more info: www.silverinstitute.org |
| Silver Junior Stocks Struggles Posted: 31 Jan 2014 10:59 AM PST It’s been an incredibly tough last couple years for the miners. Not only have they had to endure sharply falling metals prices, they’ve had to battle continually rising operating costs. For the producer companies this combination has been a margin killer. And for the non-producers it’s been flat-out devastating. Mining companies that are non-producers obviously don’t generate any revenue. They are junior-level companies in various stages of exploration and/or development. And they primarily rely on investor capital to fund their operations. In some cases they are able to procure bank loans, but this is the exception. |
| Koos Jansen: January's gold offtake in Shanghai likely to set record Posted: 31 Jan 2014 10:54 AM PST 1:50p ET Friday, January 31, 2014 Dear Friend of GATA and Gold: Gold researcher and GATA consultant Koos Jansen reports today that offtake on the Shanghai Gold Exchange has exceeded weekly world mine production for the third straight week and that it seems likely that January's gold demand in China will be the largest monthly offtake ever. Jansen's report is headlined "Chinese Gold Rush Heating Up" and it's posted at his Internet site, In Gold We Trust, here: http://www.ingoldwetrust.ch/chinese-gold-rush-heating-up CHRIS POWELL, Secretary/Treasurer ADVERTISEMENT A Personal Touch in Buying Precious Metals If you've not secured your allocation of precious metals and numismatic coins, 2014 may be the last year to get them at affordable and undervalued prices. With huge amounts of gold leaving the West for Asia, the future availability of precious metals is very much in doubt. All Pro Gold has competitive pricing on all bullion and numismatic products -- and offers prompt delivery too. Long-time GATA supporters Fred Goldstein and Tim Murphy are glad to answer any questions or concerns about acquiring the monetary metals. All Pro Gold has an extensive electronic library of articles from the world's top market analysts. Learn more at www.allprogold.com or write to Fred and Tim at info@allprogold.com or telephone them at 1-855-377-4653. Join GATA here: Mines and Money Hong Kong http://www.minesandmoney.com/hongkong/ * * * Support GATA by purchasing DVDs of our London conference in August 2011 or our Dawson City conference in August 2006: http://www.goldrush21.com/order.html Or by purchasing a colorful GATA T-shirt: Or a colorful poster of GATA's full-page ad in The Wall Street Journal on January 31, 2009: http://gata.org/node/wallstreetjournal Help keep GATA going GATA is a civil rights and educational organization based in the United States and tax-exempt under the U.S. Internal Revenue Code. Its e-mail dispatches are free, and you can subscribe at: To contribute to GATA, please visit: ADVERTISEMENT Jim Sinclair plans seminar in Austin Gold advocate and mining entrepreneur Jim Sinclair will hold his next market seminar from 2 to 6 p.m. Saturday, February 8, at the Austin, Texas, Airport Hilton. Advance registration is required. Details for the Austin seminar are posted at JSMineSet.com here: http://www.jsmineset.com/2014/01/02/austin-texas-qa-session-confirmed/ |
| Maguire: Desperate BIS & Fed Wage War On Gold As China Buys Posted: 31 Jan 2014 10:30 AM PST  Today London metals trader Andrew Maguire told King World News that an increasingly desperate BIS and Fed are accelerating their war on gold, even though The PBOC (People's Bank of China) is aggressively buying while supposedly on holiday. He also spoke about what is going on behind the scenes in his powerful interview. Today London metals trader Andrew Maguire told King World News that an increasingly desperate BIS and Fed are accelerating their war on gold, even though The PBOC (People's Bank of China) is aggressively buying while supposedly on holiday. He also spoke about what is going on behind the scenes in his powerful interview.This posting includes an audio/video/photo media file: Download Now |
| Iran, Pakistan, Malaysia Pathways to Increase Indian Rupee Value Posted: 31 Jan 2014 09:43 AM PST Rangaraj Srinivasan writes: The value of the rupee hit an all time low of 68.85 on August 2013. The government and Reserve Bank of India mulled over about currency swap arrangements with its trade link countries during September 2013.Usually, India is using US dollar as its medium of exchange for its exports and imports of its goods and services like most of the other countries in the world. Currency swap arrangements refer to exchanging of their own currencies of countries for their trades instead of universally accepted currency like USD. Suppose India has export and import arrangements with Malaysia. India will receive ringgit for its exports to Malaysia and remit rupee for its imports from Malaysia. |
| Silver Money's Historic Problem Posted: 31 Jan 2014 09:42 AM PST How silver investing's money motive got hamstrung 150 years ago in the US and India... I'M CONSTANTLY reading books on the history of both gold and silver as money, writes Miguel Perez-Santalla at BullionVault. A book I recently picked up on the history of silver currency in India relates more the actual operational use of money in their marketplace. The Indian peoples in the 19th century had no confidence in paper money. Though it was in use, it was not readily acceptable outside of the larger cities. Because of this silver was prominent in India. Gold of course was of higher value than silver. Yet silver was the metal used more commonly for regular day-to-day business transactions than any other method in that time. The Indian people did love gold and esteemed it highly, but their preference to use silver for transactions outweighed the demand for gold. Gold still came into the marketplace, just not at the same pace. Between 1836-1891 there would be 2.21 times mores silver than gold imported into India by value. Back then, in the 19th century, the Indian subcontinent was still under British colonial control. In essence they did most of their business through Great Britain. The technology shared and developed by the British helped the country modernize, notably with the addition of train lines which would support India's economic growth into the future. But the one complication in modernization was the country's greater use of silver over gold. This caused trade deficits moving forward. Why? Great Britain had been on a Gold Standard legally since 1816 and effectively since Sir Isaac Newton got his sums wrong 100 years earlier and cut the price of silver to 15.5 from 12 ounces per ounce of gold. So all accounts for Pounds in reality were denominated in gold. Invoices for the services provided by the rail developments were of course in Sterling, which although its name came from silver now meant being payable in gold, or gold-backed paper Pounds. Hence the Indians suffered when the value of silver fell versus gold. Because any debts to the colonial mother country were due in kind. Oddly, India's silver money trade balance problems really began with big trade surpluses. During the Civil War of the United States of America between 1861 and 1865, the Indian sub-continent – which was rich in natural resources – filled the gap of need for many of the products that traditionally were imported from the US into the United Kingdom. India enjoyed a tremendous boom in exports, and so its balance of currency, received in gold and silver, grew. But the traditionally greater demand for silver to use as money for domestic commerce would soon affect them negatively. Because silver money was slowly being devalued and then rejected by the world's rising power, the United States of America. Already, on 3 March 1849, Congress authorized America's first $1 gold coin, and launched the $20 gold coin, making both "legal tender for all sum whatsoever". This bill effectively de-monetized silver, but many people in the US were unaware of this change, and continued to use silver coins concurrently with paper money. There is no doubt however that the Bank of England in London had held sway over John Sherman, the politician behind the bill, in its goal of bringing other countries onto Great Britain's mono-metallic standard. Even though this bill had been passed, the next half-century would see new bills attempt to reintroduce silver as an acceptable form of payment and currency in the US. Firstly, because it was then (as now) a major producer of silver, the US had a big "silver lobby" active in Washington DC. Secondly, silver money continued in wide use amongst ordinary people. In the year 1873 however, another currency law – the Fourth Coinage Act – reaffirmed gold's place as the monetary standard, by ending the ability of silver owners to have their metal turned into coins by the Mint. Again, John Sherman was closely involved. Major uproar followed from the silver lobbyists, who called it the "Crime of 73". A bill finally passed in 1891 was again unsuccessful in reintroducing silver as the main money standard, but the Sherman Silver Act (yes, him again) did add government support for the silver industry. Because it set the official price of silver at 15.988 ounces per ounce of gold, and confirmed that the US government would continue to buy silver at that ratio to use for payment of debts. Five years later, however, the US would officially and irrevocably join the gold standard. By government order, silver perpetually lost its place as money on the books of the United States in 1896. Since the US was a still a major silver mining producer, a surplus of silver developed, as it was no longer needed for payment of government debts. This lowered the price of silver against gold, and back in India – as US manufacturers and commodity producers also rejoined the international markets after the Civil War – traders suffered losses in exchanging their silver for gold. Looking back, it's interesting to note that, time and again, as European and then the US nations came to stop using gold as their monetary standards in the 20th century, their central banks continued to hold large quantities in reserve. But silver had already been demonetized a century earlier, while gold ruled as money. And just as central banks coordinated to end the use of silver money in the late 19th century, so they have since coordinated to use only gold as their reserve commodity today, reflecting ideals which have now become permanent in our modern monetary structure.  Because of this deep history and practice, there will always be a monetary uptake on gold that is missing in the silver market. Currently central banks hold over a trillion dollars in gold reserves basis today's $1250 per ounce price. None holds any sizeable or strategic silver reserves. This missing volume of official purchases in silver precipitates the much higher gold-to-silver price ratios we are now accustomed to in this modern age. Currently around 64 ounces of silver per ounce of gold, over the last twenty years the ratio has traded primarily between the ratio of 30 to 90, a wide berth with opportunities to profit from short term imbalances in price moves. Can silver once again regain a place in the fabric of the global monetary system? Is there any mechanism even remotely considered to put such an action in place? At this time it does not appear to be in the cards for silver. Though many in the Western world still view silver as having a quasi-monetary value, its core value right now lies in its demand for industry and personal consumption as jewelry. Yet on the continent of India, where people today continue to have a high regard for both gold and silver over paper money, the question is not even viewed as a concern. Just because the central banks don't hold any investment silver bars does not mean it is not a good vehicle as an alternative asset. Indeed, from my vantage point, it may be beneficial. Because unlike gold, which suffered from heavy central-bank selling in the late 1990s, silver cannot face the same concerns about government's interfering in price action by reducing stockpiles. |
| Silver Money's Historic Problem Posted: 31 Jan 2014 09:42 AM PST How silver investing's money motive got hamstrung 150 years ago in the US and India... I'M CONSTANTLY reading books on the history of both gold and silver as money, writes Miguel Perez-Santalla at BullionVault. A book I recently picked up on the history of silver currency in India relates more the actual operational use of money in their marketplace. The Indian peoples in the 19th century had no confidence in paper money. Though it was in use, it was not readily acceptable outside of the larger cities. Because of this silver was prominent in India. Gold of course was of higher value than silver. Yet silver was the metal used more commonly for regular day-to-day business transactions than any other method in that time. The Indian people did love gold and esteemed it highly, but their preference to use silver for transactions outweighed the demand for gold. Gold still came into the marketplace, just not at the same pace. Between 1836-1891 there would be 2.21 times mores silver than gold imported into India by value. Back then, in the 19th century, the Indian subcontinent was still under British colonial control. In essence they did most of their business through Great Britain. The technology shared and developed by the British helped the country modernize, notably with the addition of train lines which would support India's economic growth into the future. But the one complication in modernization was the country's greater use of silver over gold. This caused trade deficits moving forward. Why? Great Britain had been on a Gold Standard legally since 1816 and effectively since Sir Isaac Newton got his sums wrong 100 years earlier and cut the price of silver to 15.5 from 12 ounces per ounce of gold. So all accounts for Pounds in reality were denominated in gold. Invoices for the services provided by the rail developments were of course in Sterling, which although its name came from silver now meant being payable in gold, or gold-backed paper Pounds. Hence the Indians suffered when the value of silver fell versus gold. Because any debts to the colonial mother country were due in kind. Oddly, India's silver money trade balance problems really began with big trade surpluses. During the Civil War of the United States of America between 1861 and 1865, the Indian sub-continent – which was rich in natural resources – filled the gap of need for many of the products that traditionally were imported from the US into the United Kingdom. India enjoyed a tremendous boom in exports, and so its balance of currency, received in gold and silver, grew. But the traditionally greater demand for silver to use as money for domestic commerce would soon affect them negatively. Because silver money was slowly being devalued and then rejected by the world's rising power, the United States of America. Already, on 3 March 1849, Congress authorized America's first $1 gold coin, and launched the $20 gold coin, making both "legal tender for all sum whatsoever". This bill effectively de-monetized silver, but many people in the US were unaware of this change, and continued to use silver coins concurrently with paper money. There is no doubt however that the Bank of England in London had held sway over John Sherman, the politician behind the bill, in its goal of bringing other countries onto Great Britain's mono-metallic standard. Even though this bill had been passed, the next half-century would see new bills attempt to reintroduce silver as an acceptable form of payment and currency in the US. Firstly, because it was then (as now) a major producer of silver, the US had a big "silver lobby" active in Washington DC. Secondly, silver money continued in wide use amongst ordinary people. In the year 1873 however, another currency law – the Fourth Coinage Act – reaffirmed gold's place as the monetary standard, by ending the ability of silver owners to have their metal turned into coins by the Mint. Again, John Sherman was closely involved. Major uproar followed from the silver lobbyists, who called it the "Crime of 73". A bill finally passed in 1891 was again unsuccessful in reintroducing silver as the main money standard, but the Sherman Silver Act (yes, him again) did add government support for the silver industry. Because it set the official price of silver at 15.988 ounces per ounce of gold, and confirmed that the US government would continue to buy silver at that ratio to use for payment of debts. Five years later, however, the US would officially and irrevocably join the gold standard. By government order, silver perpetually lost its place as money on the books of the United States in 1896. Since the US was a still a major silver mining producer, a surplus of silver developed, as it was no longer needed for payment of government debts. This lowered the price of silver against gold, and back in India – as US manufacturers and commodity producers also rejoined the international markets after the Civil War – traders suffered losses in exchanging their silver for gold. Looking back, it's interesting to note that, time and again, as European and then the US nations came to stop using gold as their monetary standards in the 20th century, their central banks continued to hold large quantities in reserve. But silver had already been demonetized a century earlier, while gold ruled as money. And just as central banks coordinated to end the use of silver money in the late 19th century, so they have since coordinated to use only gold as their reserve commodity today, reflecting ideals which have now become permanent in our modern monetary structure. Because of this deep history and practice, there will always be a monetary uptake on gold that is missing in the silver market. Currently central banks hold over a trillion dollars in gold reserves basis today's $1250 per ounce price. None holds any sizeable or strategic silver reserves. This missing volume of official purchases in silver precipitates the much higher gold-to-silver price ratios we are now accustomed to in this modern age. Currently around 64 ounces of silver per ounce of gold, over the last twenty years the ratio has traded primarily between the ratio of 30 to 90, a wide berth with opportunities to profit from short term imbalances in price moves. Can silver once again regain a place in the fabric of the global monetary system? Is there any mechanism even remotely considered to put such an action in place? At this time it does not appear to be in the cards for silver. Though many in the Western world still view silver as having a quasi-monetary value, its core value right now lies in its demand for industry and personal consumption as jewelry. Yet on the continent of India, where people today continue to have a high regard for both gold and silver over paper money, the question is not even viewed as a concern. Just because the central banks don't hold any investment silver bars does not mean it is not a good vehicle as an alternative asset. Indeed, from my vantage point, it may be beneficial. Because unlike gold, which suffered from heavy central-bank selling in the late 1990s, silver cannot face the same concerns about government's interfering in price action by reducing stockpiles. |
| Silver Money's Historic Problem Posted: 31 Jan 2014 09:42 AM PST How silver investing's money motive got hamstrung 150 years ago in the US and India... I'M CONSTANTLY reading books on the history of both gold and silver as money, writes Miguel Perez-Santalla at BullionVault. A book I recently picked up on the history of silver currency in India relates more the actual operational use of money in their marketplace. The Indian peoples in the 19th century had no confidence in paper money. Though it was in use, it was not readily acceptable outside of the larger cities. Because of this silver was prominent in India. Gold of course was of higher value than silver. Yet silver was the metal used more commonly for regular day-to-day business transactions than any other method in that time. The Indian people did love gold and esteemed it highly, but their preference to use silver for transactions outweighed the demand for gold. Gold still came into the marketplace, just not at the same pace. Between 1836-1891 there would be 2.21 times mores silver than gold imported into India by value. Back then, in the 19th century, the Indian subcontinent was still under British colonial control. In essence they did most of their business through Great Britain. The technology shared and developed by the British helped the country modernize, notably with the addition of train lines which would support India's economic growth into the future. But the one complication in modernization was the country's greater use of silver over gold. This caused trade deficits moving forward. Why? Great Britain had been on a Gold Standard legally since 1816 and effectively since Sir Isaac Newton got his sums wrong 100 years earlier and cut the price of silver to 15.5 from 12 ounces per ounce of gold. So all accounts for Pounds in reality were denominated in gold. Invoices for the services provided by the rail developments were of course in Sterling, which although its name came from silver now meant being payable in gold, or gold-backed paper Pounds. Hence the Indians suffered when the value of silver fell versus gold. Because any debts to the colonial mother country were due in kind. Oddly, India's silver money trade balance problems really began with big trade surpluses. During the Civil War of the United States of America between 1861 and 1865, the Indian sub-continent – which was rich in natural resources – filled the gap of need for many of the products that traditionally were imported from the US into the United Kingdom. India enjoyed a tremendous boom in exports, and so its balance of currency, received in gold and silver, grew. But the traditionally greater demand for silver to use as money for domestic commerce would soon affect them negatively. Because silver money was slowly being devalued and then rejected by the world's rising power, the United States of America. Already, on 3 March 1849, Congress authorized America's first $1 gold coin, and launched the $20 gold coin, making both "legal tender for all sum whatsoever". This bill effectively de-monetized silver, but many people in the US were unaware of this change, and continued to use silver coins concurrently with paper money. There is no doubt however that the Bank of England in London had held sway over John Sherman, the politician behind the bill, in its goal of bringing other countries onto Great Britain's mono-metallic standard. Even though this bill had been passed, the next half-century would see new bills attempt to reintroduce silver as an acceptable form of payment and currency in the US. Firstly, because it was then (as now) a major producer of silver, the US had a big "silver lobby" active in Washington DC. Secondly, silver money continued in wide use amongst ordinary people. In the year 1873 however, another currency law – the Fourth Coinage Act – reaffirmed gold's place as the monetary standard, by ending the ability of silver owners to have their metal turned into coins by the Mint. Again, John Sherman was closely involved. Major uproar followed from the silver lobbyists, who called it the "Crime of 73". A bill finally passed in 1891 was again unsuccessful in reintroducing silver as the main money standard, but the Sherman Silver Act (yes, him again) did add government support for the silver industry. Because it set the official price of silver at 15.988 ounces per ounce of gold, and confirmed that the US government would continue to buy silver at that ratio to use for payment of debts. Five years later, however, the US would officially and irrevocably join the gold standard. By government order, silver perpetually lost its place as money on the books of the United States in 1896. Since the US was a still a major silver mining producer, a surplus of silver developed, as it was no longer needed for payment of government debts. This lowered the price of silver against gold, and back in India – as US manufacturers and commodity producers also rejoined the international markets after the Civil War – traders suffered losses in exchanging their silver for gold. Looking back, it's interesting to note that, time and again, as European and then the US nations came to stop using gold as their monetary standards in the 20th century, their central banks continued to hold large quantities in reserve. But silver had already been demonetized a century earlier, while gold ruled as money. And just as central banks coordinated to end the use of silver money in the late 19th century, so they have since coordinated to use only gold as their reserve commodity today, reflecting ideals which have now become permanent in our modern monetary structure. Because of this deep history and practice, there will always be a monetary uptake on gold that is missing in the silver market. Currently central banks hold over a trillion dollars in gold reserves basis today's $1250 per ounce price. None holds any sizeable or strategic silver reserves. This missing volume of official purchases in silver precipitates the much higher gold-to-silver price ratios we are now accustomed to in this modern age. Currently around 64 ounces of silver per ounce of gold, over the last twenty years the ratio has traded primarily between the ratio of 30 to 90, a wide berth with opportunities to profit from short term imbalances in price moves. Can silver once again regain a place in the fabric of the global monetary system? Is there any mechanism even remotely considered to put such an action in place? At this time it does not appear to be in the cards for silver. Though many in the Western world still view silver as having a quasi-monetary value, its core value right now lies in its demand for industry and personal consumption as jewelry. Yet on the continent of India, where people today continue to have a high regard for both gold and silver over paper money, the question is not even viewed as a concern. Just because the central banks don't hold any investment silver bars does not mean it is not a good vehicle as an alternative asset. Indeed, from my vantage point, it may be beneficial. Because unlike gold, which suffered from heavy central-bank selling in the late 1990s, silver cannot face the same concerns about government's interfering in price action by reducing stockpiles. |
| Gold Investing a Safe Haven Again. Like, Surprise! Posted: 31 Jan 2014 09:39 AM PST Risk off, gold investing on for Western funds and Asia's rich... GOLD INVESTING died last year, right? Y'know, back when "Gold loses safe haven status" was the only headline gold got, says Adrian Ash at BullionVault. Yet 2013 in fact proved that claim wrong, even as it was being splashed everywhere. Because gold investing prices fell hard as world stock markets and other "risk" investments rose. Meaning that safe havens were less urgent...but not undoing one jot of the "anti-crisis" tendency in gold prices. Here now in 2014, gold has risen some 4% this month in Dollars, and better again in Sterling and Euros, never mind emerging-market currencies like the Turkish Lira. 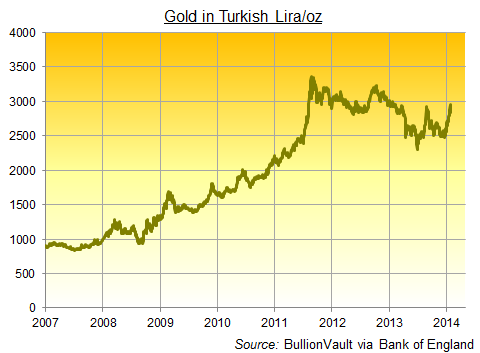 World stock markets, in contrast, have gone the other way. So have "risk" assets led by emerging-market bonds and currencies. Shades of 1997 perhaps? So the financial media say, clawing around for a narrative. And it's true that emerging-markets (especially Asia) account for the lion's share of world gold demand. That was also true during the Asian Crisis of 16 years ago. And back then, when a rise in the returns offered by US Dollar investments sucked foreign cash out of Asia, it dented first their stock markets and currencies, and then their economic growth. Yet gold didn't rise. It lost 20% across the year. Because with Western investor interest still missing (as it had been for a decade and more by the late 1990s) all that Asian demand could do was support prices. And that support weakened as Asian economies shrank. The US stock market, in contrast, rose 22% as if it didn't have a care in the world. Two big differences today. First, Western investor interest has only recently gone AWOL from gold. So buying bullion remains front-of-mind for anxious money managers. Second, emerging Asia is now plumbed into rich world economies far deeper. Yes, as we keep saying...and like specialist analyst Philip Newman notes in this great new interview...it's investor allocations that drive gold prices. Household coin or jewellery demand doesn't count, no matter how large in sum. People who buy gold because it is gold don't move the needle. What matters is new demand (or selling) from people who buy gold (or sell it) because it isn't anything else. So looking at the money that counts, Western hedge funds today are now positioned for range-bound gold, if not lower prices. The so-called "net spec long" of money managers betting on gold futures and options started 2014 at just 30% of its size at New Year's 2013. So where it took ever-more new betting on gold to move prices higher as the weight of money-managers' cash built up during the bull-market's peak in 2011, a much smaller amount would shift the balance dramatically today. More than that, Asia's richest investors are now very much richer than in 1997. There are many more of them, too. Nearly matching the US with almost 3.7 millionaires by end-2012 according to one PR puff-piece, Asia is also the fastest-growing region for new billionaires in 2013, says another. And they all have very much more to lose if other, so-called "risk" asset classes fall hard. So rather than pulling the rug from beneath gold investing prices, Asian crisis alone may spark a surprise rally in bullion. Contagion to Western assets would only add to that rise. Because it never stopped being the ultimate "safe haven" for money fleeing trouble elsewhere. It's simply that, in 2013 at least, that trouble ended. Or maybe just took a pause. |
 Lost among all the bullish predictions for the 2014 market outlook is a salient fact that few Wall Street analysts are aware of. What they fail to realize is that the powerful 40-year cycle bottoms later this year.
 He accurately predicted the trends that have shaped the last decade. Ahead of the collapse of 2008 his Trends Journal newsletter issued a forecast that stock markets, which had just hit all time highs, would buckle in the first quarter of the year and that an unprecedented recession would blanket the global economy. He said the decline in financial markets would then be followed by disillusionment in America's political and economic systems, leading to the rise of a third-party and widespread protests across America. And while officials the country over tried to assuage fears in the populace, he cautioned that the middle class would continue to be destroyed through taxation, regulation and fiscal incompetence.
 With reports that Germany can't get back much of its gold stored in the NY Federal Reserve, I remembered what I was writing just after 9/11.


 Ing: "Gold is up about 6% since year end, despite all of the mainstream media anti-gold propaganda. This rally in gold has taken place among the much feared taper. This is really just the consequences of the three rounds of quantitative easing and the orgy of money printing and liquidity that's been created by the world's central banks….


| You are subscribed to email updates from Save Your ASSets First To stop receiving these emails, you may unsubscribe now. | Email delivery powered by Google |
| Google Inc., 20 West Kinzie, Chicago IL USA 60610 | |
No comments:
Post a Comment