


Gold World News Flash |
- TDV Week in Review
- Deflation – The Great Equalizer – Now Greece? Was There a Different TESTED Response in History? YES!
- Noonan: When Will Silver Rise to Higher Values? Here’s the Answer
- Record Levels of Currency Reserves Will Hit Hard
- HOW HYPERINFLATION COULD HAPPEN
- New World Order Demands $100 Trillion or Collapse
- Former US Treasury Official - America’s Breathtaking “Crash”
- The Biggest Difference Between QE3 And QE2
- Ray Dalio's Bridgewater On The Fed's Dilemma: "We're Worried That There's No Gas Left In The QE Tank"
- Regulators urged to probe metals markets abuse
- Silver – A Technical Perspective
- Once Again, Retail Investors Are Piling Into a Bubble Near the Top
- Bob Moriarty: Solving Our National Problems Starts With Sound Money: The bedrock for fiscal, legal, education & health systems
- Bob Moriarty: Solving Our National Problems Starts With Sound Money
- Ten Macro Thoughts for the Week Ahead
- Designed Control Collapse into an Elysium on The Planet
- Will Americans Put Up with Americans Being Trained to Attack Them?
- Project Delays + Mining Taxes = Silver Supply Crunch
- Silver Price Technical Perspective
- Large Speculators turn Bullish on US Dollar Bets in Forex Futures data
- Investigating Shanghai’s gold futures
- “LBMA DARK POOL,” THE 90 TON PAPER GOLD SMASH & MORE – John Hathaway
- Silver - A Technical Perspective
- When The World’s Largest Gold Vault Gets Cleaned Out
- Silver Price Technical Perspective
- Gold Daily and Silver Weekly Charts – ‘Claims Per Deliverable Ounce’ Rises to Record High 60.38
- Large Speculators turn Bullish on US Dollar Bets in Forex Futures data
- Silver – A Technical Perspective
- Gold Fever: Coming Global Currency Reset Will Double Gold Overnight!
| Posted: 10 Nov 2013 11:00 PM PST by Gary Gibson, Dollar Vigilante:
Bitcoin seemed a great buy when the thugs at the FBI shook up the black (free) market with their seizure of the first Silk Road which took the price down to around $100. Those who scooped it up then must have been feeling awfully bright as it hit $250 just days later. I was excited to see it heading down to $235 all of a sudden and very publicly cheered on a crash back to $100 (so I could get even more). Instead Bitcoin charged up to about $400 this weekend. As of this writing, my hopes for another nicely priced buy-in are back up as it took a brief plunge below the $300 mark. |
| Deflation – The Great Equalizer – Now Greece? Was There a Different TESTED Response in History? YES! Posted: 10 Nov 2013 09:30 PM PST from Armstrong Economics:
Deflation can emerge from two primary sources – domestic and international. President Grover Cleveland explained his observation during the Panic of 1893 how capital can flee and hoard but labor cannot. Then if taxes rise, capital is consumed by government and that further shrinks the domestic available money supply. |
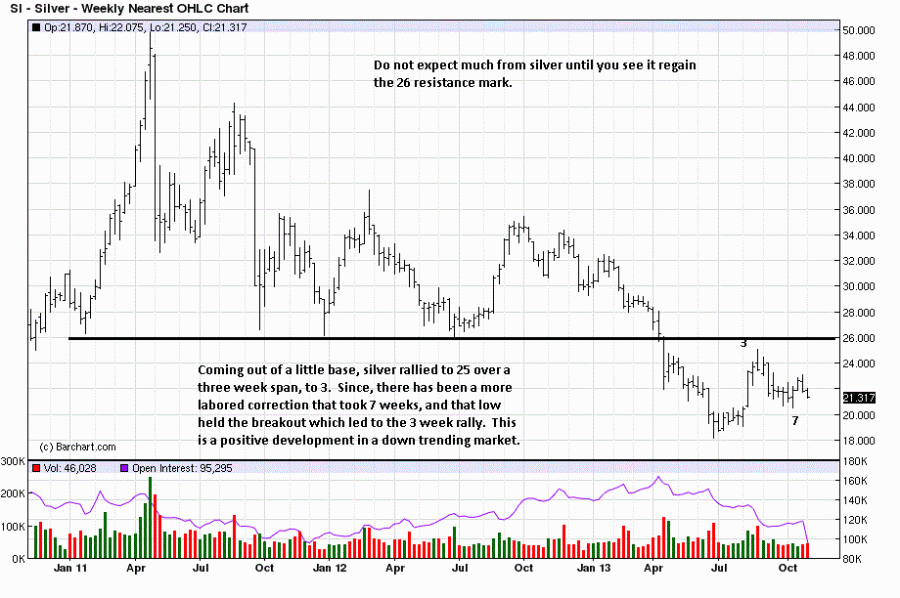
| Noonan: When Will Silver Rise to Higher Values? Here’s the Answer Posted: 10 Nov 2013 06:14 PM PST When will silver rise to higher values? Answer: No one knows. It has taken longer The above are edited excerpts from an article* written by Michael Noonan (edgetraderplus.com) originally entitled Silver – A Technical Perspective. [The following article is presented by Lorimer Wilson, editor of www.FinancialArticleSummariesToday.com and www.munKNEE.com and the FREE Market Intelligence Report newsletter (sample here – register here) and may have been edited ([ ]), abridged (…) and/or reformatted (some sub-titles and bold/italics emphases) for the sake of clarity and brevity to ensure a fast and easy read. This paragraph must be included in any article re-posting to avoid copyright infringement.]Noonan goes on to say in further edited excerpts: Everyone in the world who follows silver knows the importance of $26 for silver. Until price can rally and hold above it, do not expect higher levels. It is that simple While some of you may think it is difficult to read a chart, all that is required is a bit of common sense attached to the explanations we provide with each chart. The charts relate a story of the news/facts/figures, just in bar form. This is what the market is saying, as of last Friday. Silver – Weekly Chart As noted in the chart below, there is a small 8 week base that is currently being retested by another small trading range. Whenever a trading range retests and holds above the previous one, it has a bullish connotation. Because silver is in an overall down trend, upside strength is not a dominate factor, so expect additional time required to develop a more overtly bullish character.
Silver – Daily Chart As noted in the daily chart below, the two bars at rally high "A" showed EDM, (Ease of Downward Movement) on high volume, as price declined. At the current low of the decline, "B," there is another high volume effort, but instead of showing EDM, the two bars overlap one another. When you see overlapping bars, it is indicative of a balance between the efforts of buyers and sellers. The fact that buyers were more responsive at the low of the correction speaks well for the prospects that support may hold.
We do not have to guess which, but instead follow the market's lead, either way. For sure, if price declines, one would not want to be a buyer, based on the message of the market. Silver – 90 Minute Intra-day Chart As illustrated in the chart below, there was a high volume rally on 15 October (left side of chart) that was retested three times at the 21.10 area, and that led to another strong rally. From that kind of market development, we can expect buyers to defend that support area on a retest. That retest is now at hand. There also was a wide range, high volume decline, last Thursday [note 1]. On Friday, there was another sell-off [note 2] on the highest intra day volume in over a month.
It takes time to turn a market around, and silver is in that process. There is no degree of certainty that a bottom has been reached, but there exist at least a probability the recent lows may hold. Whether the lows hold or not, one cannot lose sight of why accumulating silver has been so important. When price finally accelerates higher, the trying of one's patience will quickly be forgotten and all will be well. [Editor's Note: The author's views and conclusions in the above article are unaltered and no personal comments have been included to maintain the integrity of the original post. Furthermore, the views, conclusions and any recommendations offered in this article are not to be construed as an endorsement of such by the editor.]*http://edgetraderplus.com/market-commentaries/silver-a-technical-perspective Other Noonan Articles: 1. Noonan: Charts are Infallible! Here's Why & What They're Saying About Gold & Silver 
Some of the finest and most highly regarded minds in the world of PMs have been saying gold and silver are going higher…[but] the charts have "said" otherwise, and that has been the correct read…The fundamentals may be as bullish as can be [but] the charts are sending a different message. Read More » 2. Noonan: Gold & Silver Could Move Sideways for Another 1-2 Years – Here's Why Using past history of how price responds, it is likely that gold, and silver, could move sideways for another year or two. While this flies in the face of so many current, supposedly "expert", opinions [mine is not based on opinion but, rather, is strictly based on the facts as conveyed by the charts. Take a look and you will see that too!] Read More » 3. Noonan: These Charts Clearly Show What's Happening With Gold & Silver – Take a Look  Below is a perfect example of how the charts timed the movement in the price of gold and silver over the past week. Yes, you CAN time the market as this article clearly demonstrates! When the market "talks," we listen.] Read More » The window of opportunity to buy physical gold and silver continues to narrow. Like the housing market top was known to be coming, when it came, those who waited too long regretted it. When the bottom for the physical PMs is known as a certainty, those who waited for a "better price" may also regret that decision. It is all about choice. Read More » In an election, it does not matter if voter turnout is high or low, the outcome is determined by the actual votes cast. The same holds true for the markets. Only those who make an actual buy or sell decision determine the outcome of the market trend. The market "voters" turn up in charts, recorded in the price range, close, and volume. Collectively, a "story" unfolds, and it usually is an accurate one as it does not include any opinions. Opinions do not matter. Articles written about fundamentals, pundit declarations, etc., all fall under the category of opinions. The market is the best source for information, and that is a fact. Read More » …Fiats have an unbroken track record of failing throughout all of history. Gold also has an unbroken track record of being a store of value for over 5,000 years. Yes, there have been hiccups along the way, and we are in one now. It is what it is, but what it is is also an incredible buying opportunity at "fire sale" prices….[That being said,] a look at the charts of the paper-tracked PM market [beg the question] … "Where's the beef?" Where is the substance of anything? We see none in the charts. Take a look. Words: 610; Charts :4 Read More »  Technical analysis is a measure different from fundamental analysis…and we qualifying our approach with a specialized subset of technical analysis. How so? We read price and volume behavior, over time, in the form of developing market activity. It is what one sees on a chart, price ranges, close locations, volume, time factor[s], but no more. Below are charts that suggest that the weakness in silver may be coming to an end, sooner now rather than later, but that for now, it is what it is – and what is, is reality. Read More »  You will read more and more articles touting how gold and silver have bottomed. They have not, at least according to price behavior as determined by actual buyers and sellers in the market. Read More » Charts speak the loudest…and they never lie…[because they are] the true record of all buy and sell decisions executed, coming from the most informed to the least informed. Most of the problems lie with those who form an opinion, and how they choose to impose it onto what any given chart "says." My understanding of what the quarterly monthly, weekly and daily charts are conveying about the price action of silver is, simply,] "Silver stackers, these lower prices are a gift you should keep on taking. Stay tuned." Read More » 10. Noonan: Charts Suggest NO Ending Price Action In Either Gold or Silver – Take a Look! Not one Precious Metals guru has gotten anything right in the last 18 months. All have been calling for considerably higher prices. Over the past several months none called for sub-$1,300 gold and sub-$20 silver. Crystal balls do not work and never have. When it comes to markets, anything can happen [but the charts convey that] there is no apparent ending action suggesting a selling climax or even a cause for a reaction rally. Take a look. Read More » The post Noonan: When Will Silver Rise to Higher Values? Here’s the Answer appeared first on munKNEE dot.com. |
| Record Levels of Currency Reserves Will Hit Hard Posted: 10 Nov 2013 06:00 PM PST When the US federal government was shutdown, China jumped in on the financial bandwagon and suggested that we build 'a de-Americanized world', which boils down to getting rid of the dollar as the international reserve currency. As the law-makers and the political parties were dragging their feet, the Chinese had their running shoes on to sneakily knock a dead man down again as he was trying to get up. Well, all is fair in love and war and we should expect nothing less. The official Chinese state-run news agency (in mocking tone) stated: "As U.S. politicians of both political parties are still shuffling back and forth between the White House and the Capitol Hill without striking a viable deal to bring normality to the body politic they brag about, it is perhaps a good time for the befuddled world to start considering building a de-Americanized world". But, has that dream come true? Has the shutdown affected the reserve currency of the world and is the dollar on its way out? South KoreaIt may not be on its way out just yet, but if the South Koreans are anything to go by, they are prepared to do quite a lot of damage if they have to in order to prevent their own currency the won.
Reserves and the FedMore than 60% of reserves at central banks around the world are in dollars today and that means that if those central banks need to (and they will!) protect their own currencies, then they will not hesitate for one moment about flooding the financial market when the time comes so that they don't lose out on liquidity in tough times. But, flooding the market with dollars will be bad news for the US. International banks have roughly $850 billion in US dollars at the moment in their vaults and will be able to ride out a future storm. Despite the pig debt oinking over the EU and the troika today meeting with the Greek Finance Minister over the bailout program (there is a fear over the return of the creditor into Greece due to differences regarding the Greek funding gap) there is one big difference today in comparison with the financial crisis of the subprimes.
Large reserves of the dollar around the world are just waiting there to be used when the economies need it. The central banks are stockpiling dollars in a bid to make their currencies go down against the dollar and at the same time make the dollar scarce so that it is in demand and rises. If it comes to the crunch, then they will have liquidity still even if their economies go downhill and it will be all thanks to Quantitative Easing and the Federal Reserve. The US stock market is on a high, the chapagne corks are popping and the fizz is being drunk down. But, the paradise is fool's one and nothing more. It's an unreal one that will run into problems sooner or later. The fact that the USA is the biggets debotor in the history of the world right now means that it will have little recourse to counter any economic trouble lurking around the corner (except continue printing money?). There have been slowdowns in the US economy on cycles of roughly six years. Each time they have got progressively bigger and stronger. The next one will hit then in about 2014-2015, just in time for Quantitative Easing to be a real problem. But, it will have done one thing: allowed foreign central banks to artificially maintain their currencies lower than they should be and to therefore appear to be more competitive. It will also enable those same economies to have greater financial independence than the US when the trouble knocks on the door. The US saved the world after all! Only trouble is: it forgot to save itself!
Originally posted: Record Levels of Currency Reserves Will Hit Hard You might also enjoy: Internet or Splinternet | World Ready to Jump into Bed with China Indian Inflation: Out of Control? | Greenspan Maps a Territory | Gold Rush or Just a Streak? | Obama's Obamacare: Double Jinx | Financial Markets: Negating the Laws of Gravity |Blatant Housing-Bubble: Stating the Obvious | Let's Downgrade S&P, Moody's and Fitch For Once | US Still Living on Borrowed Time | (In)Direct Slavery: We're All Guilty | The Nobel Prize: Do We Have to Agree? | Revolution Costs | Petrol Increase because Traders Can't Read | Darfur: The Land of Gold(s) | Obamacare: I've Started So I'll Finish | USA: Uncle Sam is Dead | Where Washington Should Go for Money: Havens | Sugar Rush is on | Human Capital: Switzerland or Yemen? | Technical Analysis: Bear Expanding Triangle | Bull Expanding Triangle | Bull Falling Wedge | Bear Rising Wedge | High & Tight Flag
|
| HOW HYPERINFLATION COULD HAPPEN Posted: 10 Nov 2013 05:25 PM PST Will we experience a deflationary collapse or a hyper-inflationary collapse? I don’t know. Larry Kotlikoff is a pretty smart dude and he is worried about hyperinflation. Other smart dudes are worried about deflation. The oligarchs are more scared of deflation, so they are pulling out all the stops to avoid it. Hyperinflation is always a mistake. […] |
| New World Order Demands $100 Trillion or Collapse Posted: 10 Nov 2013 05:20 PM PST |
| Former US Treasury Official - America’s Breathtaking “Crash” Posted: 10 Nov 2013 04:25 PM PST  Today a former US Treasury Official spoke with King World News about the disturbing reality of America's ultimate "crash." He also discussed how this will have an enormous impact on the price of gold, the US dollar, and stocks. Below is what Dr. Paul Craig Roberts had to say in part I of this powerful interview series. Today a former US Treasury Official spoke with King World News about the disturbing reality of America's ultimate "crash." He also discussed how this will have an enormous impact on the price of gold, the US dollar, and stocks. Below is what Dr. Paul Craig Roberts had to say in part I of this powerful interview series.This posting includes an audio/video/photo media file: Download Now |
| The Biggest Difference Between QE3 And QE2 Posted: 10 Nov 2013 04:21 PM PST Back in 2011, in an exclusive analysis, Zero Hedge showed how virtually all the reserves created as a result of QE2 ended up as cash on the balance sheets of foreign (mostly European) banks operating in the US. Some suggested that this was due to a change in FDIC rules which was being arbed by foreign banks which were able to engage in a mini carry trade affecting the Fed's excess reserves. We disagreed, and suggested that this was nothing short of yet another way in which foreign banks abused the Fed's "Bernanke Put" to bail themselves out at a time when the Eurozone and its currency seemed like they would implode any second. QE2 came and went, and was replaced by QE3. And, having lasted nearly a year now, it has allowed us to observe the main way in which the Fed's open-ended QE3 has so far differed from the QE2 of 2011. Recall that while the Fed's Quantiative Easing programs are largely determined by what securities the Fed monetizes: i.e. the sources of funds, what is always left unspoken is where the Fed's created reserves end up, or the "uses" of funds, or rather, reserves. Luckily, as the chart below shows and as tracked by the Fed's H.8 statement, there is a perfect correlation, and causation, between the Fed's newly created reserves parked at banks, and the corresponding change in cash held on the books of either domestic (large and small) and foreign commercial banks operating in the US.
What may not be quite visible in the chart above is that during QE 2, virtually all the newly created cash ended up at foreign banks. This is shown far more clearly in the chart below showing the change in cash balances at large domestic commercial banks and foreign banks between the start and end of QE 2.
So while the Fed was explicitly pumping the deposit base of foreign banks in 2011 - and thanks to JPM and the entire deposit collateral pathway we now know that this cash was used to satisfy collateral requirements needed when purchasing risk assets, even if the banks never explicitly used the Fed's cash to buy up risk - what has it been doing so far in 2013? The answer is shown below.
Surprisingly - if only to all those who claimed our assertion that the Fed was bailing out Europe's banks was bunk due to "regulatory arbitrage" - entirely unlike during QE 2, this time around, virtually every dollar newly created by the Fed has landed on an equal basis at both large domestic commercial banks, and foreign banks operating in the US. But... but... whatever happened to the regulatory arbitrage of QE2? To those still confused, here is the best visualization of the cash change in domestic vs foreign banks under the two QE regimes:
Indeed - a pretty clear summary of what the Fed's deisgnated bailout audiences was under QE 2 (European banks) and QE 3 (everyone on an equal, pro rata basis). The above, far more importantly than what the Fed is monetizing in order to build up its reserves, gives us a clear snapshot of the other part of the equation - where the Fed's reserves end up.
All of this should perhaps once again spark the debate over just why has the Fed parked a record $1.3 trillion in cash not with US-based banks, but foreign ones, and just for whose benefit - since by now it is quite clear that QE is solely for the benefit of the 0.1% of the population and, of course, the banks - was QE designed. Because it is one thing to bail out the rich, at least they are America's rich. But when more than half of the proceeds of QE to date...
...have ended up at foreign banks, perhaps at least a theatrical congressional hearing is in order? Source: H.8 |
| Posted: 10 Nov 2013 03:21 PM PST "The Fed's real dilemma is that its policy is creating a financial market bubble that is large relative to the pickup in the economy that it is producing," Bridgewater notes as the relationship between US equity markets and the Fed's balance sheet (here and here for example) and "disconcerting disconnects" (here and here) indicate how the Fed is "trapped." However, as the incoming Yellen faces up to her 'tough' decisions to taper or not, Ray Dalio's team is concerned about something else - "we're not worried about whether the Fed is going to hit or release the gas pedal, we're worried about whether there's much gas left in the tank and what will happen if there isn't."
Via Bridgewater, In the old days central banks moved interest rates to run monetary policy. By watching the flows, we could see how lowering interest rates stimulated the economy by 1) reducing debt service burdens which improved cash flows and spending, 2) making it easier to buy items marked on credit because the monthly payments declined, which raised demand (initially for interest rate sensitive items like durable goods and housing) and 3) producing a positive wealth effect because the lower interest rate would raise the present value of most investment assets (and we saw how raising interest rates has had the opposite effect). All that changed when interest rates hit 0%; "printing money" (QE) replaced interest-rate changes. Because central banks can only buy financial assets, quantitative easing drove up the prices of financial assets and did not have as broad of an effect on the economy. The Fed's ability to stimulate the economy became increasingly reliant on those who experience the increased wealth trickling it down to spending and incomes, which happened in decreasing degrees (for logical reasons, given who owned the assets and their decreasing marginal propensities to consume). As shown in the charts below, the marginal effects of wealth increases on economic activity have been declining significantly. The Fed's dilemma is that its policy is creating a financial market bubble that is large relative to the pickup in the economy that it is producing. If it were targeting asset prices, it would tighten monetary policy to curtail the emerging bubble, whereas if it were targeting economic conditions, it would have a slight easing bias. In other words, 1) the Fed is faced with a difficult choice, and 2) it is losing its effectiveness.
We expect this limit to worsen. As the Fed pushes asset prices higher and prospective asset returns lower, and cash yields can't decline, the spread between the prospective returns of risky assets and those of safe assets (i.e. risk premia) will shrink at the same time as the riskiness of risky assets will not decline, changing the reward-to-risk ratio in a way that will make it more difficult to push asset prices higher and create a wealth effect. Said differently, at higher prices and lower expected returns the compensation for taking risk will be too small to get investors to bid prices up and drive prospective returns down further. If that were to happen, it would become difficult for the Fed to produce much more of a wealth effect. If that were the case at the same time as the trickling down of the wealth effect to spending continues to diminish, which seems likely, the Fed's power to affect the economy would be greatly reduced. ... ...we think that US monetary policy is nearing a new test that will require wisdom and creativity along the lines of that which was required to deal with those problems. The basic issue is that quantitative easing is a much less effective tool when asset prices are high and thus have low expected returns than it is for managing financial crises. That's because QE stimulates the economy by (1) offsetting a panic by providing cash to the financial system when there's a need for cash, and (2) by raising asset prices, and driving money from the assets they buy into demand and investment, creating a higher level of future economic activity. So, the policy was particularly wise and most effective (in the sense of impact per dollar) at the height of the financial crisis when there was both a desperate need for cash and when extremely depressed asset prices were heavily weighing on demand and investment. Now, there is a flood of liquidity and asset prices are high relative to underlying fundamentals. So the impact of additional asset price increases on demand is much less (as high asset prices and low future returns make assets more interchangeable with cash). Quantitative easing today is driving asset prices to unsustainable levels, without stimulating much additional activity. That leaves a much clearer tradeoff between driving up asset prices today and lowering future returns (the price of which will be paid in the future). During the crisis period, that was much less the case, because pulling forward returns from the future (i.e., raising prices) was then also creating future earnings growth (by helping to normalize the economy). The dilemma the Fed faces now is that the tools currently at its disposal are pretty much used up, in that interest rates are at zero and US asset prices have been driven up to levels that imply very low levels of returns relative to the risk, so there is very little ability to stimulate from here if needed. So the Fed will either need to accept that outcome, or come up with new ideas to stimulate conditions. We think the question around the effectiveness of continued QE (and not the tapering, which gets all the headlines) is the big deal. Given the way the Fed has said it will act, any tapering will be in response to changes in US conditions, and any deterioration that occurs because of the Fed pulling back would just be met by a reacceleration of that stimulation. So the degree and pace of tapering will for the most part be a reflection and not a driver of conditions, and won't matter that much. What will matter much more is the efficacy of Fed stimulation going forward. In other words, we're not worried about whether the Fed is going to hit or release the gas pedal, we're worried about whether there's much gas left in the tank and what will happen if there isn't. |
| Regulators urged to probe metals markets abuse Posted: 10 Nov 2013 02:27 PM PST If they were serious, they could start with their own central bank, the Bank of England. * * * By Patrick Jenkins and Jack Farchy http://www.ft.com/intl/cms/s/0/c8c50b88-48a1-11e3-a3ef-00144feabdc0.html Britain's parliamentary financial watchdog has urged regulators to probe potential abuses in metals markets as deeply as they are investigating the ongoing scandals over foreign exchange and Libor benchmark interest rates. Andrew Tyrie, chairman of the Treasury select committee, told the Financial Times that MPs were conscious of growing concerns that the manipulation of rates -- already exposed in the Libor affair, and now under investigation in a mounting regulatory probe into potential forex abuses -- may go well beyond those areas and into metals markets. ... Dispatch continues below ... ADVERTISEMENT Buy metals at GoldMoney and enjoy international storage GoldMoney was established in 2001 by James and Geoff Turk and is safeguarding more than $1.7 billion in metals and currencies. Buy gold, silver, platinum, and palladium from GoldMoney over the Internet and store them in vaults in Canada, Hong Kong, Singapore, Switzerland, and the United Kingdom, taking advantage of GoldMoney's low storage rates, among the most competitive in the industry. GoldMoney also offers delivery of 100-gram and 1-kilogram gold bars and 1-kilogram silver bars. To learn more, please visit: http://www.goldmoney.com/?gmrefcode=gata "It is essential that the regulators do a thorough job to stamp out market fixing," Mr Tyrie said. "By the look of it, there is a great deal for them to do. The Treasury Committee will be looking closely at their conclusions." Other members of the cross-party committee privately echoed Mr Tyrie's concerns about metals markets. The Libor scandal has cost banks and brokers $3.5 billion in regulatory fines and some experts believe a brewing scandal around alleged foreign exchange manipulation could be even costlier, with regulators on three continents now investigating the affair. Aluminium consumers have thrust the clubby metals industry into the glare of the regulatory spotlight in recent months, alleging that the price of the metal has been artificially inflated. In the United States, the Commodity Futures Trading Commission and the Department of Justice have launched probes into metals warehouses, where long queues for delivery have been the subject of heavy criticism. The UK's Financial Conduct Authority has not begun a formal probe of metals pricing, though it appeared obliquely critical of the London Metal Exchange last week. In a statement welcoming an initiative to shorten waiting times at LME-registered warehouses, the regulator said it would continue to monitor the LME's progress in "increasing the transparency of its market." London is the home of global benchmark prices for industrial metals such as copper, aluminium, and zinc, which are traded on the LME, as well as precious metals, such as silver and gold. Like Libor, both sets of benchmarks are set by a small group of banks and brokers. However, the benchmarks are set by thousands of actual transactions, rather than the theoretical price quotes used in Libor calculations. In a system that is comparable with the foreign exchange market, precious metals prices are set during intraday "fixings," while industrial metals prices are decided through the LME's open-outcry ring. Warehouses with long queues have been bidding in the market for additional metal to be deposited in their sheds, an action that aluminium buyers such as MillerCoors, the brewer, allege has restricted supplies and inflated their costs. The LME's warehousing initiative last week, which promised a crackdown on any "abusive" behaviour by warehouses as well as a new rule to shorten queues, was an attempt to restore its reputation. The FCA has stepped up its engagement with the metals exchange in recent months, people familiar with the situation said, as well as hiring external consultants to help it better understand the physical markets. The LME said in a statement that it had a "close and continuous relationship" with its regulator, including close engagement over the warehousing reforms. "There is no investigation of the LME by the FCA of which we are aware," it added. Join GATA here: New Orleans Investment Conference https://jeffersoncompanies.com/landing/speakers?IDPromotion=613011610080... Vancouver Resource Investment Conference http://www.cambridgehouse.com/event/vancouver-resource-investment-confer... * * * Support GATA by purchasing DVDs of our London conference in August 2011 or our Dawson City conference in August 2006: http://www.goldrush21.com/order.html Or by purchasing a colorful GATA T-shirt: Or a colorful poster of GATA's full-page ad in The Wall Street Journal on January 31, 2009: http://gata.org/node/wallstreetjournal Help keep GATA going GATA is a civil rights and educational organization based in the United States and tax-exempt under the U.S. Internal Revenue Code. Its e-mail dispatches are free, and you can subscribe at: To contribute to GATA, please visit: ADVERTISEMENT How to profit with silver -- Future Money Trends is offering a special 16-page silver report with our forecast for 2013 that includes profiles of nine companies and technical analysis of their stock performance. Six of the companies have market capitalizations of less than $800 million and one company has a market cap of only $30 million. The most exciting of these companies will begin production in a few weeks and has a market cap of just $150 million. Half of all proceeds from the sale of this report will be donated to the Gold Anti-Trust Action Committee to support its efforts exposing manipulation and fraud in the gold and silver markets. To learn about this report, please visit: http://www.futuremoneytrends.com/index.php?option=com_content&id=376&tmp... |
| Silver – A Technical Perspective Posted: 10 Nov 2013 01:20 PM PST by Michael Noonan, Edge Trader Plus:
With the onslaught of bullish news/facts/figures about silver over the past year, one need only look at where the price of silver is and ask, "How is that bullish information working out for you?" This applies less to buyers of the physical, but even they need an occasional reminder that even though price has declined, their end game is still in process. |
| Once Again, Retail Investors Are Piling Into a Bubble Near the Top Posted: 10 Nov 2013 12:06 PM PST
One of the primary themes for this letter over the last few months has been the potential of a major market top forming. We now have what I can only call “numerous bells” ringing.
First and foremost, I want to alert you to a disturbing trend in stock mania. That trend pertains to money inflows to stock mutual funds.
One of the best means of gauging investor sentiment for individual investors pertains to how they move their money in and out of mutual funds.
For example, from 2007 until the end of 2012, investors pulled over $405 billion out of stock based mutual funds. Over $90 billion of this was pulled in 2012 alone: the largest withdrawal since 2008.
In contrast, over the same time period, investors put over $1.14 trillion into bond funds. They brought in $317 billion in 2012: again, this was the most since 2008.
This marks quite a reversal of asset class fund flows: before 2008, stock funds usually took in $2 for every $1 investors allocated to bond funds.
However, this trend reversed back to normal in 2013. The Fed finally succeeded in inducing investors to move into stocks again. And they have done so in a big way. Thus far in 2013, investors have put $277 billion into stock mutual funds.
This is the single largest allocation of investor capital to stock based mutual funds since 2000: at the height of the Tech bubble. That year, investors put $324 billion into stocks. We might actually match that inflow this year as we still have two months left in 2013.
Indeed, investors are reaching a type of mania for stocks. They put $45.5 billion into stock based mutual funds in the first five weeks of October. If they maintain even half of that pace ($22.75 billion) for November and December, we’ll virtually tie the all-time record for stock fund inflows in a single year.
That record, again, occurred in 2000. At that time the NASDAQ had just staged a massive bubble rally.
What followed was one of the worst market collapses of all time:
Be forewarned.
For a FREE Special Report outlining how to protect your portfolio a market collapse, swing by: http://phoenixcapitalmarketing.com/special-reports.html
Best Regards,
Phoenix Capital Research
|
| Posted: 10 Nov 2013 11:00 AM PST from ChrisMartensondotcom: At the Casey Research Summit last month, Chris had the opportunity to sit down with longtime precious metals investor and proprietor of 321gold.com, Bob Moriarty. Right before their conversation, Bob had picked up a local Arizona newspaper and read an AP article titled “US Reliability Questioned Overseas” (the government shutdown was in full swing at this time). It discussed, among other concerns voiced by foreigners, whether continuing to rely on the US dollar as the world’s reserve currency is prudent given America’s political dysfunction and its debt levels. Bob took this as one of a growing number of important data points that suggest the world public is beginning to wake up to the fact that the status quo may not be sustainable, or wise. By no means is this awareness mainstream, but it’s notably more prevalent than it was 5+ years ago (to the point where it can be discussed openly in a small US metro newspaper). Bob feels, now more than ever, that sites like his, PeakProsperity.com and their ‘alternative media’ peer set can play a critical role in helping the world get to the “tipping point” of awareness that the system is not just broken, but needs a full reset – and to agitate constructively for it. In his eyes, returning to a sound, fixed currency system is an important place to start: |
| Bob Moriarty: Solving Our National Problems Starts With Sound Money Posted: 10 Nov 2013 11:00 AM PST from ChrisMartensondotcom The bedrock for fiscal, legal, education & health systems At the Casey Research Summit last month, Chris had the opportunity to sit down with longtime precious metals investor and proprietor of 321gold.com, Bob Moriarty. Right before their conversation, Bob had picked up a local Arizona newspaper and read an AP article titled “US Reliability Questioned Overseas” (the government shutdown was in full swing at this time). It discussed, among other concerns voiced by foreigners, whether continuing to rely on the US dollar as the world’s reserve currency is prudent given America’s political dysfunction and its debt levels. Bob took this as one of a growing number of important data points that suggest the world public is beginning to wake up to the fact that the status quo may not be sustainable, or wise. By no means is this awareness mainstream, but it’s notably more prevalent than it was 5+ years ago (to the point where it can be discussed openly in a small US metro newspaper). Bob feels, now more than ever, that sites like his, PeakProsperity.com and their ‘alternative media’ peer set can play a critical role in helping the world get to the “tipping point” of awareness that the system is not just broken, but needs a full reset – and to agitate constructively for it. In his eyes, returning to a sound, fixed currency system is an important place to start: |
| Ten Macro Thoughts for the Week Ahead Posted: 10 Nov 2013 11:00 AM PST 1. The monthly establishment survey of the US employment report was stronger than expected and sufficient to lift the 3-month private sector average (190k) above the 6-month average (175k). Yet it is little different from the 12-month average (196k), which suggests that despite some volatility, the trend is little changed. The household survey, apparently more prone to being skewed by the government closure continues to under-perform. Over the past three months, it has recorded an average loss of 239k jobs.
This coupled with other measures of the labor market, such as hours worked and average earnings do not show a marked improvement in the US labor market. Similarly, the preliminary estimate of Q3 GDP, which is subject to statistically significant revisions, was flattered by inventory accumulation, which will either be revised away or act as a drag on Q4 GDP. The underlying trend in final demand has remains unchanged.
2. With the core PCE deflator not moving toward the Fed's target and fiscal uncertainties looming, the increased speculation of tapering at the December meeting remains premature. On one hand, there are some in the blogsphere who do not think the Fed can ever taper ("QE-infinity") and while many bank economists continue to err on the side of seeing a greater urgency to taper than appears to be the case. We continue to see a more compelling case for tapering in March 2014.
3. Janet Yellen's confirmation hearings begin on Thursday. Appearing before the Senate Banking Committee, which has seen her a few other times in her illustrative career, Yellen is unlikely to be controversial. She is neither dove nor hawk, but an independent thinker, responding to her remarkably prescient understanding of the economy, and this will likely be borne out in her testimony. Yellen is a gradualist. The risk is that she appears more centrist than dovish.
The Senate Banking Committee is not where Yellen will meet her stiffest opposition. That will be on the Senate floor itself, where 60 votes are needed for procedural issues, though a simple majority is needed for approval. This creates some space for obstructionist tactics. Nevertheless, Yellen's confirmation hearings this week may provide the news wires with headlines, but not offer investors much real news or insight into Fed policy under her leadership.
4. The European Central Bank surprised last week with a 25 bp cut in the repo rate and extended the period of full allotment of its regular refi operation for another year. It appears to have a controversial decision as news wires report that nearly a quarter of the Governing Council had preferred to wait at least another month. The ECB persists with the easing bias, as in rates will this low or lower for an extended period. Yet its measures are unlikely to prove effective in the triple threat of deflation, weak money supply growth and lending, and the decline in excess liquidity that may soon pressure money market rates. The key EONIA trades closer to the deposit rate (zero) than the repo rate (now 25 bp). In effect, lowering the ceiling is not really material in the current environment. The ineffectiveness of the ECB's measures means that additional steps will have to be forthcoming. There are no good options (that are also politically realistic). A new LTRO, while mentioned by Draghi, will unlikely be taken up by the strong banks, ahead of the Asset Quality Review and stress tests, which means there will be a stigma of its use and suggest a low take down.
Draghi also mentioned the possibility of additional rate cuts. Another cut in the repo rate (to zero) may improve financial conditions temporarily, but not address the underlying deflationary pressures or the causes of the year and a half contraction in lending to businesses and households. Since the deposit rate was cut to zero, banks have reduced their use of that facility. Pushing the deposit rate below zero could distort money markets and have other unintended and unforeseen consequences, as no other major central bank have offered negative deposit rates. If that is the downside, the upside is even less clear. Lower rates by themselves are unlikely to arrest the deflation and contraction in lending.
5. European finance ministers have a two-day meeting starting Thursday. Although the review of Greek, Portuguese and Irish programs are anticipated, the real interest will be in progress toward the banking union. An agreement between Germany's CDU and SPD over the weekend strengthens Schaeuble's negotiating position. Essentially, Germany will insist that the European finance ministers will decide when to close failing banks, not the European Commission, and that the European Stabilization Mechanism, (ESM) will not be used to wind down troubled institutions. Until the Single Resolution Mechanism is sufficiently financed by financial institutions, national authorities. If national authorities lack resources, Spain's ESM program looks to be the model that Germany wants to follow. While Germany has some allies, most countries seem to prefer greater access to ESM funds to wind down individual problem banks.
6. The UK will report the latest inflation and employment data prior to the Bank of England's Quarterly Inflation Report. While disinflation or deflationary pressures are evident among most of the high income countries, the UK is notable exception. That said, base effects suggest modest easing here in Q4. The core rate is also likely to ease at at 2%, which is the consensus forecast would be match its lowest reading in four years. The claimant count is expected to fall again and this is consistent with a further decline in the unemployment rate to 7.6%. This is the backdrop of the BOE's inflation report.
The pessimistic outlook BOE Governor Carney offered when he took office in July is likely to be substantially revised. The central bank's growth forecast is likely to be revised higher and a faster decline in unemployment is likely to be anticipated. Even if the medium term inflation forecast is lowered, the market appears to be discounting the likelihood a rate hike late next year or arguably early 2015. The implied yield of the December 2014 short-sterling futures contract is currently 80 bp compared with the current base rate of 50 bp. Whereas former Governor King's desire to provide more stimulus was repeatedly out-voted by the MPC, Carney's assessment and forward guidance has been given little credibility by investors. Carney, rather than the market, is likely to change its stance.
7. Standard and Poor's cut France's sovereign rating to AA from AA+ last week and changed the outlook to stable from negative. The euro was under pressure from the ECB's surprise rate cut and the US jobs data, but the reaction in both the bond and the credit default swap supports our general view that the rating agencies views of major industrialized economies, reliant as they are, completely on publicly accessible and available information, are of marginal significance. There appears nothing in S&P decision that has not appeared in numerous economic analysis. There is little confidence among economists (and apparently many officials in Brussels) that the French government has put the economy on a sustainable path. We have argued that fall of the Berlin Wall eventually forced a restructuring of the German economy and the crisis is forcing the periphery to reform (especially the pubic sector). France has had the privilege of neither spurs of reform.
S&P projects French government spending to be 56% in 2015, which is the second highest among developed countries after Denmark. The EU's Economics Commission Rehn warned earlier last week, prior to the S&P action, that contrary to pledges by Hollande, French unemployment would rise until 2015. At the same time, French officials see the low interest rates (benchmark 10-year yield below 2.25%) as investors' vote of confidence in the government's course. The 5-year credit default swap actually slipped slightly before the weekend, and although the 10-year bond yield rose, it increased less than Germany, allowing the premium to narrow by a couple of basis points. The New York Times headline that said that "S.&P. Downgrade Downgrade Deals a Blow to the French Government" must refer more to appearances than substance.
8. The Abe government is struggling to implement its so-called third arrow of structural reforms. The first two arrows, which consisted of fiscal and monetary stimulus were relative easy to enact. In many ways it is the traditional LDP salve, though on steroids, as the quantitative easing is nearly as large as the Federal Reserve's for an economy less than half the size. The foreign exchange market had discounted Abenomics by taking the dollar-yen exchange rate from about JPY75 to a little over JPY100 in roughly the six months through May. The economy itself appears to have peaked in Q2. The economy appears to have slowed significantly in Q3. Indeed when the GDP figures are reported this week, they will likely show the expansion at less than half of the Q2, or around a 1.3%-1.6% at an annualized pace.
With shrinking population and excess capacity in a number of key industries, it is little wonder that Japanese business are reluctant to increase investment at home. At the same time, they are not sharing with the workers the windfall created by the weaker yen. In September regular wages, which exclude overtime and bonuses, fell 0.3% on a year-over-year basis, the 16th consecutive month of declines. While winter and summer bonuses did help spur consumption, the rise in inflation (a five-year high was reached in August at 0.8% before slipping to 0.7% in September) is eroding purchasing power and the real return on savings. In anticipation of the hike in the retail sales tax on April 1 from 5% to 8% may boost the demand for household durable goods, but unless incomes rise, the economy may falter again. Abe's honeymoon is over. Businesses are balking. And just when new efforts are needed for his economic agenda, Abe may be spending his diminishing political capital on a controversial visit to the war shrine, which will do mend fences with its neighbors, not just China.
9. China has reported a slew of data that generally confirm the stabilization of the economy, as officials have directed. The purchasing manager surveys had already indicated the stabilization the October industrial production, investment and retail sales reports confirmed it. Industrial output and retail sales ticked from September, though fixed asset investment eased slightly.
The news that more likely will capture the market's attention is that more than doubling of the October trade surplus to $31.1 bln form $15.2 bln in September. Imports increased slightly to 7.6% (year-over-year) from 7.4%, but the larger surprise was in exports, which jumped to 5.6% from -0.3%. Some feared that the 2.3% rise in the yuan this year would curb exports, but as we have argued, the limited valued-added work done in China (largely assembly) means that exports are unlikely to be very sensitive to small changes in foreign exchange prices. The strength of foreign demand also appears to be more important than the controlled currency changes.
Meanwhile, Chinese inflation did edge higher in October to a 3.2% year-over-year rate, an eight month high. Consumer inflation stood at 3.1% in September. The Reuters polls put the consensus estimate at 3.3%. Food prices remain the main culprit. They were up 6.5% in October from 6.1% in September. Chinese measured inflation appears to be more a case of relative price changes rather than a general price increase. It is the increase in house prices that seems to be of greater concern (~20% in the large urban centers) than consumer inflation. At the same time, producer prices continue to fall. October's 1.5% decline is the 20th consecutive negative print. It follows a 1.3% decline in September. This divergence between falls in producer prices and increases in consumer prices suggests a source of profit-margins. Taken as a whole and at face value, the latest data is unlikely to spur a change in PBOC policy.
10. The much-heralded Third Plenary Session of the Communist Party in China has begun. Direct news has, as expected, been very light. It is widely acknowledged by officials that reform of its growth model is needed. There are three areas in which reform is likely to be concentrated: the government, as in reducing bureaucracy, the market, to provide greater competition and flexibility, and state-owned enterprises, which still dominate key sectors of the economy. The latest reports have tended to focus on the state-owned enterprises. In the financial sector, the new Chinese government has announced a number of reforms that give market forces greater sway, including abolishing the floor for lending rates and developing a market-based prime rate. Continued gradual movement in this direction is expected.
Even after the plenary session ends, it may take observers some time to understand the results. There are two main obstacles to dramatic change in the Chinese model. First, President Xi Jingping continues to consolidate his power, but has been frustrated by continued influence of past presidents Jiang Zemin and Hu Jintao. Second, it is not clear that Xi or Prime Minister Li are as interested in political reform as they are economic reform. Henry Ford once quipped that a customer can have any color Model T as long as it was black. Despite the factions within the Communist Party, Chinese officials seem to agree the government stays Red. That is to say, challenges to the rule of the Communist Party will not be tolerated. In a country of contrasts, economic reform can go hand-in-hand with a crack down on human rights and civil society activists. This includes the Zhi Xian Party (which means Constitution is the Supreme Authority) formed last week by the supporters of Bo Xilai. The contradiction between the modernizing and flexible economy on one hand, and the archaic and rigid political system on the other, is unlikely to be resolved, but rather intensify in the period ahead. |
| Designed Control Collapse into an Elysium on The Planet Posted: 10 Nov 2013 09:00 AM PST from TheAlexJonesChannel: |
| Will Americans Put Up with Americans Being Trained to Attack Them? Posted: 10 Nov 2013 08:30 AM PST by Adan Salazar, The Daily Sheeple:
As evidence mounts that the U.S. military is being trained to engage citizens domestically, the lack of outcry from the American people has been astounding. Exactly why the military is undergoing training in this regard is still unclear. It could be related to a potential welfare state collapse, which could be triggered by cuts to food stamps or social security benefits. According to the Social Security Administration, "9 out of 10 individuals age 65 and older receive Social Security benefits." |
| Project Delays + Mining Taxes = Silver Supply Crunch Posted: 10 Nov 2013 07:40 AM PST from silver investor.com: |
| Silver Price Technical Perspective Posted: 10 Nov 2013 07:11 AM PST All people in the futures markets are there to make money, [hedgers excepted], or they would not subject themselves so unnecessarily to the risks. Even buyers of the physical, Stackers, want to get as low a price as they can. More people are fundamentally inclined than are technically driven. As a consequence, they like to read articles that provide a degree of psychological comfort in support of their own view of the market. With the onslaught of bullish news/facts/figures about silver over the past year, one need only look at where the price of silver is and ask, "How is that bullish information working out for you?" This applies less to buyers of the physical, but even they need an occasional reminder that even though price has declined, their end game is still in process. |
| Large Speculators turn Bullish on US Dollar Bets in Forex Futures data Posted: 10 Nov 2013 06:43 AM PST The latest data for the weekly Commitments of Traders (COT) report was released on Friday by the Commodity Futures Trading Commission (CFTC) and showed that large futures speculators turned bullish on the US dollar last week after four straight weeks of bearish positions. Non-commercial large futures traders, including hedge funds and large International Monetary Market speculators, had an overall US dollar long position totaling $7.02 billion as of Tuesday November 5th. This was a weekly change of $10.17 billion from the total position of $-3.146 billion that was registered on October 29th, according to data from Reuters that calculates this amount by the total of US dollar contracts against the combined contracts of the euro, British pound, Japanese yen, Australian dollar, Canadian dollar and the Swiss franc. |
| Investigating Shanghai’s gold futures Posted: 10 Nov 2013 06:30 AM PST by Jan Skoyles and Koos Jansen, TheRealAsset.co.uk
But the Shanghai Futures Exchange is where we believe the Chinese authorities wish to use their influence on the international gold price. Background to the Shanghai Futures Exchange As we have highlighted in an earlier infographic, China's gold market has undergone radical changes in the last two decades. From preventing gold ownership to publically encouraging it, the State Council is ensuring that China's gold market is the one to watch as the nature of the global economy changes. |
| “LBMA DARK POOL,” THE 90 TON PAPER GOLD SMASH & MORE – John Hathaway Posted: 10 Nov 2013 06:15 AM PST from KingWorldNews:
You are already seeing gold bypassing the LBMA, which is a 'Dark Pool' in London, where nobody understands what's going on except the bullion banks, and miners are dealing directly with China and not clearing that metal through London. And once London loses its grip on the flow of physical gold, which I think is starting to happen, the game will be much tougher for paper gold players. The same thing is true of Comex. That's the direction we are going in." |
| Silver - A Technical Perspective Posted: 10 Nov 2013 05:59 AM PST All people in the futures markets are there to make money, [hedgers excepted], or they would not subject themselves so unnecessarily to the risks. Even buyers of the physical, Stackers, want to get as low a price as they can. Read More... |
| When The World’s Largest Gold Vault Gets Cleaned Out Posted: 10 Nov 2013 03:30 AM PST by Byron King, Daily Reckoning.com:
What's going on? What do these graphs mean? Above you'll see ten years' worth of graphical data concerning gold trades on COMEX, which is an exchange that offers warehouse services for clients who trade metals. That is, COMEX stores gold at designated sites, on behalf of its clients. When you read about "gold trading," this is the gold that gets traded. |
| Silver Price Technical Perspective Posted: 10 Nov 2013 03:11 AM PST All people in the futures markets are there to make money, [hedgers excepted], or they would not subject themselves so unnecessarily to the risks. Even buyers of the physical, Stackers, want to get as low a price as they can. More people are fundamentally inclined than are technically driven. As a consequence, they like to read articles that provide a degree of psychological comfort in support of their own view of the market. With the onslaught of bullish news/facts/figures about silver over the past year, one need only look at where the price of silver is and ask, "How is that bullish information working out for you?" This applies less to buyers of the physical, but even they need an occasional reminder that even though price has declined, their end game is still in process. |
| Gold Daily and Silver Weekly Charts – ‘Claims Per Deliverable Ounce’ Rises to Record High 60.38 Posted: 10 Nov 2013 03:00 AM PST from Jesse’s Café Américain:
That was not to be, not that it didn’t impact jobs, but it did not impact the way in which the government counted jobs in what is the headline, ‘establishment’ report. The ‘Household Report,’ which is based on a direct survey of people, and the Labor Participation Rate which compares people who are working versus those who are available for work, were in the tank. Some other aspects like wages and hours worked were not looking very good either. |
| Large Speculators turn Bullish on US Dollar Bets in Forex Futures data Posted: 10 Nov 2013 02:43 AM PST The latest data for the weekly Commitments of Traders (COT) report was released on Friday by the Commodity Futures Trading Commission (CFTC) and showed that large futures speculators turned bullish on the US dollar last week after four straight weeks of bearish positions. Non-commercial large futures traders, including hedge funds and large International Monetary Market speculators, had an overall US dollar long position totaling $7.02 billion as of Tuesday November 5th. This was a weekly change of $10.17 billion from the total position of $-3.146 billion that was registered on October 29th, according to data from Reuters that calculates this amount by the total of US dollar contracts against the combined contracts of the euro, British pound, Japanese yen, Australian dollar, Canadian dollar and the Swiss franc. |
| Silver – A Technical Perspective Posted: 10 Nov 2013 01:52 AM PST All people in the futures markets are there to make money, [hedgers excepted], or they would not subject themselves so unnecessarily to the risks. Even buyers of the physical, Stackers, want to get as low a price as they can. More people are fundamentally inclined than are technically driven. As a consequence, they like to read articles that provide a degree of psychological comfort in support of their own view of the market. With the onslaught of bullish news/facts/figures about silver over the past year, one need only look at where the price of silver is and ask, "How is that bullish information working out for you?" This applies less to buyers of the physical, but even they need an occasional reminder that even though price has declined, their end game is still in process. It can be helpful to understand the market from a chart perspective because you will have a more accurate read for what to expect in the next week[s] or month[s], or until you see a change in the structure that signals an important move is underway. While some of you may think it is difficult to read a chart, all that is required is a bit of common sense attached to the explanations we provided with each chart. When will silver rise to higher values? Answer: No one knows. It has taken longer than most thought, and it will continue to take longer than most believe, but there is one thing for sure, the price of silver will retest the old high, and then proceed to exceed it, by at least a double. It takes time to turn a market around, and silver is in that process. There is no degree of certainty that a bottom has been reached, but there exist at least a probability the recent lows may hold. Whether the lows hold or not, one cannot lose sight of why accumulating silver has been so important. When price finally accelerates higher, the trying of one's patience will quickly be forgotten and all will be well. The charts relate a story of the news/facts/figures, just in bar form. This is what the market is saying, as of Friday. Everyone in the world who follows silver knows the importance of $26 for silver. Until price can rally and hold above it, do not expect higher levels. It is that simple. There is a small 8 week base that is currently being retested by another small trading range. Whenever a trading range retests and holds above the previous one, it has a bullish connotation. Because silver is in an overall down trend, upside strength is not a dominate factor, so expect additional time required to develop a more overtly bullish character.
The two bars at rally high "A" showed EDM, [Ease of Downward Movement] on high volume, as price declined. At the current low of the decline, "B," there is another high volume effort, but instead of showing EDM, the two bars overlap one another. When you see overlapping bars, it is indicative of a balance between the efforts of buyers and sellers. The fact that buyers were more responsive at the low of the correction speaks well for the prospects that support may hold. That answer will come next week. If it is to be support, there will be the beginnings of another rally. If support disappears, lower prices will result. We do not have to guess which, but instead follow the market's lead, either way. For sure, if price declines, one would not want to be a buyer, based on the message of the market.
Two points worth considering from this 90 minute intra day chart. There was a high volume rally on 15 October, left side of chart, that was retested three times at the 21.10 area, and that led to another strong rally. From that kind of market development, we can expect buyers to defend that support area on a retest. That retest is now at hand. There was a wide range, high volume decline, last Thursday. On Friday, there was another sell-off on the highest intra day volume in over a month. Volume is a measure of effort. The question to ask is, if the effort was the greatest in recent days, why was the net result so little? Keep these last two bars in mind in relation to the daily chart, above, where the discussion centered on overlapping bars, a balance between buys and sellers. So far, the increased effort failed to reach the support from the 21.10 area, when it was more than opportune to not only retest but even break it. After all, silver is in a down trend. Were the two bars reflecting a balance, or more of buyers overcoming sellers in preparation for a rally? We cannot know the answer, [no one can], until next week, but it does raise the possibility of a trade potential should support hold. It may be only short-term, if one develops, but what the charts show is how developing market activity can be used to advantage. The same holds true for a larger time frame. Stackers need to keep on stacking, and futures traders need to be select, if buying, while the trend remains down. When and as a change in trend occurs, from down to up, making buy decisions will become easier, not that trading is easy, but knowing the trend and market context puts the odds of success in a much higher arena of probability. One then has an edge.
|
| Gold Fever: Coming Global Currency Reset Will Double Gold Overnight! Posted: 10 Nov 2013 01:30 AM PST by Jim Willie, Silver Berar Cafe:
|
 Have you been keeping up with Bitcoin’s latest ups and downs? I love this stuff! Even if it ends up at zero, it will have been a hell of a great ride.
 Deflation remains a mystery for many because they just cannot grasp the fact that money supply can increase while prices decline. Their heads begin to spin around and they spit out green pea soup because it is not supposed to happen in their mind. During deflationary trends, money supply can still increase but the contraction is so massive that money supply cannot possibly increase at the same pace as assets collapse as demand shrinks into the sunset.


 All people in the futures markets are there to make money, [hedgers excepted], or they would not subject themselves so unnecessarily to the risks. Even buyers of the physical, Stackers, want to get as low a price as they can. More people are fundamentally inclined than are technically driven. As a consequence, they like to read articles that provide a degree of psychological comfort in support of their own view of the market.

 The answer may unfortunately be a resounding "Yes"
 This year volumes and deliveries on the Shanghai Gold Exchange have begun to appear with some regularity in gold market updates, alongside COMEX gold futures volumes and London prices.
 Hathaway added: "I just want to come back to this idea that what you see going on in the paper market is an unregulated playpen for macro-investors. Paper gold has enormous capacity to absorb these trades, and it doesn't really tell the story of what's taking place in the physical market. So there is a disconnect between the two, and as I say, it's going to get resolved.
 There's a stunning development in the world of gold buying and selling. In fact, there's a massive gold shortage across conventional markets. This shortage may be a precursor for a price melt-up. Let's look at some charts.
 As you probably know the US posted a blowout headline number for the October Non-Farm Payrolls report of 204,000 jobs gains, and upwardly revised the prior month. What made this significant was the thinking that the government shutdown would have negatively impacted the jobs number.


 The United States has ushered in hyper monetary inflation with the series of Quantitative Easing programs, as in QE1, QE2, Operation Twist, and QE3. My belief is no longer than hyper inflation is inevitable, since already part of current policy now. Hyper-inflation is already here.
| You are subscribed to email updates from Save Your ASSets First To stop receiving these emails, you may unsubscribe now. | Email delivery powered by Google |
| Google Inc., 20 West Kinzie, Chicago IL USA 60610 | |
No comments:
Post a Comment