


Gold World News Flash |
- COMEX Deliverable Gold Bullion Drops To Levels Not Seen Since 2003 – Claims Per Ounce Around 55
- Massive Debt Levels Will Push Silver to $150 and Beyond
- Can Silver Hold $23 ? $26 Should
- Direction of U.S. Trade Deficit Indicates Direction of U.S. Dollar
- Gold and Silver Holding the Line On a Breakout
- Silver - Can $23 Hold? $26 Should
- Guest Post: When Dominance Leads To Incompetence And Catastrophe
- Precious Metals Market Report with Franklin Sanders
- Current Economic Collapse -- "News Brief" -- Episode 157
- G20 conference agrees to eliminate privacy for tax records
- "The Ugly Wager" Or When Will The US Equity Market Bubble Pop?
- IS THE MANIPULATION IN THE METALS ABOUT TO BEGIN AGAIN?
- Labor Force Participation Crisis? Don't Blame Demographics!
- Tokyo To Host 2020 Summer Olympics
- Top Economist Predicts Increased Gov’t Theft & Surge In Gold
- Who Is Going To Buy The US Debt If This War Causes China, Russia And The Rest Of The World To Turn On Us?
- Dr. Nu Yu’s Back With Analyses on Gold & Silver, USD, Crude Oil, HUI/XAU, U.S. Bonds
- Jim’s Mailbox
- Gold And Silver - It Is Always About One Thing: Timing
- Cashing In Your Gold Insurance
- This Past Week in Gold
- Gold And Silver - It Is Always About One Thing: Timing
- Market Monitor – September 7th
- Gold: An attitude adjustment for institutional banks
- COMEX Deliverable Gold Bullion Drops To Levels Not Seen Since 2003 - Claims Per Ounce Around 55
- COMEX Deliverable Gold Bullion Drops To Levels Not Seen Since 2003 - Claims Per Ounce Around 55
| COMEX Deliverable Gold Bullion Drops To Levels Not Seen Since 2003 – Claims Per Ounce Around 55 Posted: 08 Sep 2013 12:00 AM PDT from Jesse’s Café Américain:
London Banker, Lies, Damn Lies, and Libor “Delivery takes on a note of finality, of a reckoning, when supply has become rehypothecated into little more than a state of mind. The unanswered call for delivery is the final lifting of the veil.” |
| Massive Debt Levels Will Push Silver to $150 and Beyond Posted: 07 Sep 2013 10:00 PM PDT by Hubert Moolman, SilverBearCafe.com:
The process of the devaluation of gold and silver, started by the demonetization of gold and silver, is about to reverse at a greater speed than ever before. This is similar to what happened during the late 70s, when the gold and silver price increased significantly. However, what happened in the 70's was just a prelude to this coming rally. The 70's was the end of a cycle, this is likely the end of a major cycle; an end of an era of the debt-based monetary system (dishonest money). |
| Can Silver Hold $23 ? $26 Should Posted: 07 Sep 2013 10:00 PM PDT The silver situation continues to grow more positively, based on developing market activity. Almost everyone has an opinion, but they are all subservient to whatever the market dictates with its most current and most reliable information. It is then a matter of reading the message. Sometimes it is very clear, sometimes not. The resistance for silver at $26 is uppermost on the mind of everyone with any degree of awareness for this market. A lesser market message, but one still quite clear was the lesser resistance from a demonstrated failed swing high retest back in April. |
| Direction of U.S. Trade Deficit Indicates Direction of U.S. Dollar Posted: 07 Sep 2013 09:53 PM PDT The trade deficit has improved a lot since 2010 and the U.S. dollar strengthened So says Katchum (katchum.blogspot.ca) in edited excerpts from his original article* entitled Correlation: Trade Balance Vs. Currency Strength. [The following article is presented by Lorimer Wilson, editor of www.FinancialArticleSummariesToday.com and www.munKNEE.com and the FREE Market Intelligence Report newsletter (sample here – register here) and may have been edited ([ ]), abridged (…) and/or reformatted (some sub-titles and bold/italics emphases) for the sake of clarity and brevity to ensure a fast and easy read. This paragraph must be included in any article re-posting to avoid copyright infringement.]Katchum goes on to say in further edited (and possibly paraphrased in some places) excerpts: As you know, a trade deficit means that imports exceed exports. Americans buy more stuff from foreigners and in exchange they give money to these foreigners. This money needs to be in the currency of the foreigners. Let’s say an American buys a Chinese TV. He will have to pay yuan to the Chinese merchant. To do this, he will convert U.S. dollars to yuan. This will lower the value of the U.S. dollar. The other way round is also true. China has a trade surplus and will sell its goods to America in exchange for U.S. dollars. These U.S. dollars will be converted to yuan, otherwise the Chinese merchant can’t do much with the U.S. dollars in his country. This will increase the value of the yuan. Of course, there is a lag between trade and currency conversion. This lag is approximately 1 year. As a consequence, the trade balance is a leading indicator for the strength of a currency. The higher the U.S. trade deficit, the more probable that the U.S. dollar will go down in value. The following chart gives the monthly U.S. trade deficit (red chart) Vs. the U.S. dollar index (blue chart). If the trade deficit widens (red line goes down), the U.S. dollar index will drop (blue line goes down).  Conclusion Knowing that the extent of U.S. trade deficit is a leading indicator for currency weakness, you can predict the collapse of the U.S. dollar by just looking at the trade deficit trend and, as such, you can position yourself for this collapse in the U.S. dollar by buying precious metals and commodities. [Editor's Note: The author's views and conclusions in the above article are unaltered and no personal comments have been included to maintain the integrity of the original post. Furthermore, the views, conclusions and any recommendations offered in this article are not to be construed as an endorsement of such by the editor.]*http://katchum.blogspot.ca/2013/09/correlation-trade-deficit-vs-currency.html Related Article: 1. Continuing U.S. Dollar Strength Depends on Asia's Self-interests Continuing – Here's Why  In an odd twist of fate the future of the U.S. dollar is in the hands of Asian governments [and particularly China and Japan. Let's hope they continue to put their own interests first.] Here's why. Read More »
The post Direction of U.S. Trade Deficit Indicates Direction of U.S. Dollar appeared first on munKNEE dot.com. |
| Gold and Silver Holding the Line On a Breakout Posted: 07 Sep 2013 09:40 PM PDT Today was filled with cross currents, as the Non-Farm Payrolls report came in light, and looked even worse if you peered into the details of it. The unemployment rate is less meaningful now because of the large number of people who have been long term unemployed and are falling off the unemployment benefits rolls. Labor Participation Rate and average workweek are therefore a bit more important. And things are not looking good because the jobs that are being created tend to be low wage and often part time. |
| Silver - Can $23 Hold? $26 Should Posted: 07 Sep 2013 07:39 PM PDT The silver situation continues to grow more positively, based on developing market activity. Almost everyone has an opinion, but they are all subservient to whatever the market dictates with its most current and most reliable information. Read More... |
| Guest Post: When Dominance Leads To Incompetence And Catastrophe Posted: 07 Sep 2013 06:22 PM PDT Submitted by Charles Hugh-Smith of OfTwoMinds blog, Dominance means leaders and employees alike lose the ability to experience risk. Lost amidst the week's geopolitical and propaganda dramas was a signal event in the long history of dominance leading directly to collapse: Microsoft bought Nokia's mobile phone business for $7.2 billion (5.44 euros). Considering that this business was valued at 260 billion euros ($340 billion) not that long ago, that is a rather precipitous decline from tech-dominance grace. Microsoft has a long history of acquiring innovations by buying tech companies by the dozen, and of overpaying for acquisitions and eventually writing down the value of the purchases. With Nokia's market share down to 4%, it could be argued Mr. Softee is once again overpaying, but perhaps the patent portfolio will be worth the purchase price. Or maybe not. Patent trolling is no substitute for creativity, innovation and appreciation of risk. Microsoft is a case study in dominance leading to incompetence and catastrophe. Within the moat of near-monopoly/dominance, competence dwindles to the ability to keep doing what worked spectacularly well in the past, and keeping bureaucratic infighting and divisional rivalries down to a dull background erosion of initiative and talent. Doing more of what succeeded spectacularly in the past works until it doesn't, at which point doggedly pressing on with the old formula of success leads to catastrophic failures. Nokia and Blackberry are recent case studies, but the rise of Google Chrome and smart-phone/tablet computing is beginning to threaten Microsoft's core business of being the utility monopoly in the PC space. Dominance means leaders and employees alike lose the ability to experience risk. The customer will take what is delivered, regardless, for the simple reason that alternatives are either unavailable or cumbersome. In the PC space, the other mainstream choice to date has been the costly Macintosh family of Apple computers. Now that cheap tablets running the free Chrome operating system can do pretty much everything a PC can do, and do so on the go, Microsoft's monopoly is threatened. It's not just that consumers hate the Windows 8 operating system--the entire PC platform is slipping from dominance. Millions of users such as myself would switch to a Chrome OS on the PC in a heartbeat, just to jettison the bloated Windows OS entirely. The Windows Office near-monopoly (Word and Excel) is equally vulnerable to an alternative that opens old Word and Excel files and offers basic word processing and spreadsheet functions in the Chrome OS. It's rather staggering to list Microsoft's failures over the past decade. The strategy that worked in the 1990s--copy rivals and add more features to the copycat products and services--is no longer working. 1. Microsoft's Internet Explorer browser has lost most of its once-dominant market share to rivals such as Google Chrome. 2. Microsoft spent a reported $10 billion competing in search with Google; Mr. Softee's Bing search service remains an also-ran. 3. MSFT's tablet has never gained traction and is an also-ran. 4. Microsoft bought a slew of mobile-software companies in pursuit of dominance; as a direct consequence of this aggressive strategy, its share of the smart-phone software market has dwindled from over 10% to 1%. 5. The XBox gaming platform was supposed to dominate the convergence-web-TV space; that never gained traction, either. Dominance in any space breeds complacency and enables the luxuries of political squabbling, sclerosis and loss of focus. Competence becomes incompetence, and the infrastructure that fosters creativity and flexibility--that is, a keen appreciation of risk and spontaneity--is slowly dismantled. That applies not just to corporations but to governments, nations and empires. |
| Precious Metals Market Report with Franklin Sanders Posted: 07 Sep 2013 06:00 PM PDT By Catherine Austin Fitts This week on The Solari Report, we will post my interview with Franklin Sanders of the The Moneychanger about events in the precious metals market. Precious metals investors are weary from a long consolidation in gold and silver prices from 2011 highs. Even as pawn shops work overtime [...] |
| Current Economic Collapse -- "News Brief" -- Episode 157 Posted: 07 Sep 2013 05:06 PM PDT Congress is back in session on Sept 9. The President and other government officials are campaigning to persuade the congress to vote in their favor. There are reports that congress is headed for a... [[ This is a content summary only. Visit http://FinanceArmageddon.blogspot.com or http://www.newsbooze.com or http://www.figanews.com for full links, other content, and more! ]] |
| G20 conference agrees to eliminate privacy for tax records Posted: 07 Sep 2013 04:59 PM PDT In just two years the IRS may be sharing everything with Russia's and China's foreign intelligence agencies. * * * G20 Countries to Share Tax Records to Crack Down on Cheats By Bill Curry http://www.theglobeandmail.com/news/politics/g20-countries-to-share-tax-... ST. PETERSBURG, Russia -- Tax records will be shared around the world by 2015 as part of a G20 pledge to crack down on individual tax cheats and global corporations with complicated arrangements aimed at paying as little tax as possible. The topic of taxation in a global economy has become a major political issue of late, as multinational firms like Apple and Starbucks have faced scrutiny over their corporate structures. Further, investigative reports into the use of offshore tax havens by the world's wealthiest individuals added momentum to the view that governments are getting shortchanged of much-needed revenue. As business increasingly moves online and international, cash-strapped governments approved an aggressive timeline to adopt the automatic exchange of tax information among the G20. The deal was solidified after China, the last holdout, agreed to the plan just days before the summit in St. Petersburg. ... Dispatch continues below ... ADVERTISEMENT Precious Metals Round Table: On Tuesday, September 24, Sprott Asset Management will assemble four experts for a live Internet broadcast about the prospects for the precious metals. Participating will be Sprott's CEO, Eric Sprott; financial letter writer and internationally renowned conference speaker Marc Faber; Sprott's chief investment strategist, John Embry; and Sprott Asset Management President Rick Rule. To participate, please visit: https://event.on24.com/eventRegistration/EventLobbyServlet?target=regist... "We are committed to automatic exchange of information as the new global standard," states the G20 final communiqué. The G20 says they will work out the details of the plan throughout 2014 with the goal of having the system in place by the end of 2015. "This is quite fast," said Domenico Lombardi, director of global economy for the Waterloo-based Centre for International Governance Innovation, who is in St. Petersburg as an observer. Mr. Lombardi said the timeline appears "ambitious" and questioned whether it will be met. "This is done on purpose to escalate pressure," he said. At the conclusion of the summit, Prime Minister Stephen Harper called the tax exchange agreement "extremely positive," even though concerns remain to be addressed. "Obviously there are many details to be worked out," he said. "I think we'll find as we go forward in discussions that those kinds of difficulties, or potential difficulties, those concerns will also be shared by a number of our partner countries, so I'm confident that we can move forward on this in a way that's positive for everyone." Queen's law professor Arthur Cockfield, who studies these types of agreements, said problems can be addressed if every country makes clear assurances as to how the information will be protected. "In my view, governments will more effectively engage in automatic tax information exchanges if they have assurances that the transferred information will be protected by laws that are similar to their own laws that protect taxpayer rights," he said in an e-mail. "This should help overcome concerns when taxpayer information is transferred to countries -- such as Saudi Arabia, Russia, and China -- that may not have traditionally protected taxpayer rights to the extent expected under Canadian law." A proposed U.S. law requiring foreign governments -- including Canada -- to report banking information involving U.S. citizens has already run into concerns from the Canadian government and attracted the attention of Canada's privacy commissioner. Questions of privacy will likely increase given that the G20 includes non-democratic countries where human rights are a concern, including China and Saudi Arabia. While the political attention in St. Petersburg has focused on the crisis in Syria, the G20 releases numerous pages of communiqués, action plans and annex reports on their economic plans. Among the key points: The G20 noted improved growth in the U.S., Japan, and Europe, but that global growth prospects have been marked down repeatedly over the past year. "Despite our actions, the recovery is too weak, and risks remain tilted to the downside. In the last months financial market volatility has increased," the G20 stated. On monetary policy, the G20 noted the concern that actions by some countries can lead to unintended negative consequences elsewhere. "We commit to co-operate to ensure that policies implemented to support domestic growth also support global growth and financial stability and to manage their spillovers on other countries," it stated. In an accompanying "action plan" report, the U.S. Federal Reserve -- whose quantitative easing policies have caused concern within the G20 -- issued a statement on its plans. "The Federal Reserve intends to continue its asset purchase program and employ its other policy tools as appropriate until the outlook for the labor market has improved substantially in a context of price stability," it states. Join GATA here: Gold Investment Symposium 2013 Mines and Money Australia New Orleans Investment Conference https://jeffersoncompanies.com/landing/speakers?IDPromotion=613011610080... * * * Support GATA by purchasing DVDs of our London conference in August 2011 or our Dawson City conference in August 2006: http://www.goldrush21.com/order.html Or by purchasing a colorful GATA T-shirt: Or a colorful poster of GATA's full-page ad in The Wall Street Journal on January 31, 2009: http://gata.org/node/wallstreetjournal Help keep GATA going GATA is a civil rights and educational organization based in the United States and tax-exempt under the U.S. Internal Revenue Code. Its e-mail dispatches are free, and you can subscribe at: To contribute to GATA, please visit: |
| "The Ugly Wager" Or When Will The US Equity Market Bubble Pop? Posted: 07 Sep 2013 04:48 PM PDT Unconventional monetary policies of the Fed et al. are having distortionary effects on asset markets and increasing their inherent instability. Via a mathematical framework, that has been empirically shown to accurately model bubbles, and give a prediction for when they will ultimately come to an end, Variant Perception (VP) investigates the S&P 500 today. The framework suggests a window of time within which the S&P will experience a 'regime change', which may involve a steep price drawdown. Using this framework, VP predicts this regime change will occur any time between now and the beginning of Q413. Furthermore, based on a suite of indicators for the S&P which point towards overbought and overvalued conditions with a backdrop of complacency and divergent market internals, VP forecast any regime change to resolve itself through a - potentially steep - market drawdown. Remaining long is an ugly wager. THEMES > The US equity market is likely close to the end of a bubble phase that started in 2009. The bubble pattern may resolve itself by trading sideways, but it is more probable we are facing a significant drawdown. > The critical window for the end of the bubble is anywhere between now and the beginning of 4Q13. Determining when a bubble might burst is very difficult. The end date for bubbles is sensitive to initial conditions of the fitted model. However, looking across the models we have fitted we are now in the window of the critical period of the current S&P bubble. > Buying put spreads or protection makes sense given the asymmetric outcomes. The chance for further upside is small versus the larger probability of a market drawdown that could be 10% upwards. Volatility is cheap and under-priced. Investors have rarely bought so many calls versus puts, and volatility is mispriced. > The current belief is that central banks can backstop risk taking. Bubbles are often formed by a new belief or paradigm. Today everyone thinks they can own stocks to benefit from “QE Infinity” while the Fed provides liquidity. Many investors believe they will be smart enough to get out and reduce exposure before the Fed changes its stance. We doubt everyone will be able to make it through the exit doors at the same time. > High margin debt is in line with 2000 and 2007 peaks in absolute terms. In year over year terms, the growth in margin debt is near 1987, 2000, 2007, 2010 and 2011. In most of these cases, these indicated intermediate market tops and in many cases preceded crashes. Previous increases in margin debt in the past three years contributed to the Flash Crash of 2010 and the debt ceiling crash of 2011. High levels of margin debt signal that a disorderly resolution of a bubble is more likely. > Our short-term sell signals are almost all flashing sell, and we have a breakdown in market breadth and health. Our collection of buy and sell signals have flashed many sell signals and no buy signals. Investors are very long and complacent, Treasury yields and oil prices are rising, and we are seeing deterioration in market breadth. > Valuations before drawdowns tend to be high, but they don't need to be ridiculously high. Current valuations are high and problematic. US markets appear cheap on the basis of forward-operating earnings. However, almost all US indices are near the top end of historical valuations based on trailing 12 month earnings. Trailing earnings are more accurate indicators of future returns BELIEF IN CENTRAL BANKS CAUSING BUBBLES AND CRASHES Every year, the Darwin Awards are given out to honour fools who kill themselves accidentally and remove themselves from the human gene pool. The 2009 Award went to two bank robbers. The robbers figured they would use dynamite to get into a bank. They packed large quantities of dynamite by the ATM machine at a bank in Dinant, Belgium. Unhappy with merely putting dynamite in the ATM, they pumped lots of gas through the letterbox to make the explosion bigger. And then they detonated the explosives. Unfortunately for them, they were standing right next to the bank. The entire bank was blown to pieces. When police arrived, they found one robber with severe injuries. They took him to the hospital, but he died quickly. After they searched through the rubble, they found his accomplice. It reminds you of the immortal line from the film The Italian Job where robbers, led by Michael Caine, after totally demolishing a van in a spectacular explosion, shouts at them, “You’re only supposed to blow the bloody doors off!” Central banks are trying to make stock prices and house prices go up, but they will likely ‘blow the doors off’. Unconventional monetary policy tools are intended to generate spill-overs to other financial markets. For example, QE and central bank asset purchases are meant to boost stock prices and weaken the dollar, lower bonds yields and push investors into higher risk assets. Central bankers hope they can find the right amount of dynamite to blow open the bank doors, but it is highly unlikely that they’ll be able to find just the right amount of money printing, interest rate manipulation and currency debasement to not damage anything but the doors.
Bubbles are often formed by a new belief or paradigm. Today everyone thinks they can own stocks to benefit from “QE Infinity” while the Fed provides liquidity. Faith in central banks today is equivalent to faith in the world of dot-com in 1999 or faith in the eternal rise of housing prices in 2006. Targeting stock prices is par for the course in a world of unconventional monetary policy. Officially the Fed receives its marching orders from Congress and has a dual mandate: stable prices and high employment. But in the past few years, the Fed has unilaterally added a third mandate: higher stock prices. Chairman Bernanke himself pointed out that stock markets had risen strongly since he signalled the Fed would likely do more QE during a speech in Jackson Hole, Wyoming in 2010. “I do think that our policies have contributed to a stronger stock market, just as they did in March of 2009, when we did the last iteration [of QE]. The S&P 500 is up about 20% plus and the Russell 2000 is up 30% plus.” It is not hard to see why stock markets rally when investors believe the most powerful central banker in the world wants stock markets go up. The problem is that almost all previous ends to QE or fears of an end have resulted in steep drawdowns. Almost all clients we speak to believe they will be smart enough to get out and reduce exposure before the Fed changes its stance. We doubt everyone will be able to make it through the exit doors at the same time. The last two times the Fed stopped QE or paused, we had significant price declines: Flash Crash May 2010 and August 2011 with the debt ceiling. For example, the Flash Crash in 2010 happened at the end of QE1. The August 2011 drawdown happened right at the end of QE2. It is highly likely we’ll see a repeat when the Fed tapers.
AN ANALYTICAL FRAMEWORK FOR BUBBLES Here we introduce a framework for modelling bubbles. We have left out the mathematics. Instead, without getting too bogged down in the detail, we hope to show that it is possible to model bubbles using a theoretical approach, and that this approach can yield an estimate for when the bubble will end. We then show that the S&P today is exhibiting bubble-like behaviour and, using the model, give an estimate, of between around now and the beginning of 4Q13, for when the bubble will come to an end. ... Sornette’s central finding is that that log-periodic power laws (LPPL) do a good job of describing speculative bubbles. An LPPL essentially attempts to model the price of an asset as a function of oscillations around an exponential growth rate. ...
IS THE S&P 500 IN A BUBBLE? In the section below, we try to answer this question applying the method described above with a heavy emphasis on exploring what information the LPPL model can currently give us on the trajectory of the S&P 500.
The ensemble of critical times from our analysis suggests that the S&P 500 may be exhibiting characteristics of two bubbles and both are at or close to critical points. Critical times for windows starting prior to February 2011 range from 1 to 4 days. This would correspond to a longer duration bubble with origins in 2009 that has reached a critical point. Critical times for windows starting from 2012 onwards show a wider spread of critical times, ranging from 24 to 100 days (with a mean of 63). This would put a critical date on a more recent and shorter duration bubble at some point in the beginning of 4Q13. Full Variant Perception research note below:
|
| IS THE MANIPULATION IN THE METALS ABOUT TO BEGIN AGAIN? Posted: 07 Sep 2013 03:36 PM PDT The answer to the question above unfortunately is maybe. There are definitely warning signs springing up. The first sign of trouble popped up last week when the miners generated a key reversal on huge volume, and on a day when gold was actually positive. Something about that day smells very fishy to me. It looks like big-money traders had advance notice that a false breakout to new highs was going to be manufactured to give insiders an exit after a two-month 40% rally. The high-volume follow-through the next day confirms that something is not right. For the life for me it looks like big money just manufactured a bull trap and set up an exit right at the top of the two month rally.  Looking at the weekly chart only confirms my suspicion. The last week of August was the highest volume week in history. When that kind of volume appears at the top of a two-month rally, after a 40% gain, there's a good chance its signaling smart money just snuck out the back door. We should only see this kind of volume at the bottom of a serious decline, not the top of a two-month rally unless something is wrong.  Another warning sign is the potential topping candle on the weekly charts followed by an indecision candlestick this week.  I'm starting to get quite nervous that this intermediate cycle topped on week nine and the bear raid is about to continue. As most of you know I'm not a big conspiracy buff. Other than short-term stuff around options expiration, pretty much all of the pullbacks in this bull market can be explained away as normal corrective moves that happen in all bull markets. Unfortunately, this is not the case since last December. Nothing about the decline after the QE 4 announcement has been natural. first off, the intermediate cycle length was stretched ridiculously far, which would never occur during a down trend. During down trends intermediate cycles shrink, not stretch. Sentiment extremes which would normally generate bear market rallies had no affect during this decline. The lack of any significant countertrend moves to relieve selling pressure during this bear market are another sign in my opinion that this was not a natural move. And the repeated massive volume take downs in the overnight and pre market hours to push gold below significant technical levels to trigger stop loss orders would never occur if traders were trying to maximize profits. That 400 ton dump in the premarket on April 12th to run the stops below $1523 was so far from a natural market event it's not even questionable that was blatant manipulation.  There's no doubt in my mind that big-money knows gold is going to enter the bubble stage of this bull market sometime soon. What started out probably as an attempt to create a selling panic so Germany could get their physical bullion back, has now turned into a high-stakes game of let's see how far we can lower the starting point before the bubble phase begins. I noted before the difference in profit potential if the starting point of the bubble could be artificially lowered. I'm convinced that if allowed to trade freely the next leg up in the gold bull market began last summer as all assets started to respond to QE 3& 4. That rally had a starting point at about $1550. Assuming a minimum secular bull market top of at least $5000, the profit potential from that move beginning at $1550 is about 200%. However, if the starting point could be artificially lowered to $1000, the profit potential jumps to 400%. Considering the warning signs from the mining stocks last week and this week, I'm starting to get extremely concerned that the bear raid is about to resume. The first goal will be to take gold back down to test that $1179 summer bottom. If that bottom can be broken, (and if gold gets anywhere near that level I think we can automatically assume we're going to see another massive contract dump in the overnight market to make sure it does get broken) gold will collapse in another waterfall decline all the way back to the prior C-wave top at $1030.  The next week or two are going to be dangerous in my opinion. If the bears can get some downside traction, traders need to get out of the way, get back to cash, and prepare to jump on board the bull at $1000 which I believe is probably the ultimate goal of this manipulation event that has been going on all year. I advised subscribers to exit on Tuesday morning into strength based on these warning signals. We are now in wait and see mode in case the manipulation resumes. If it does, then we want to stay on the sidelines until the big money is finished jerking the sector around, and we want to reboard the train at the bottom along with the insiders who have manufactured this whole criminal process.       |
| Labor Force Participation Crisis? Don't Blame Demographics! Posted: 07 Sep 2013 02:45 PM PDT The Labor Force Participation Rate - in English, the percent of the population that is either in a job or looking for a job - fell yesterday to fresh 35 year lows. This is not a new trend, in fact since the end of 1999 (the dot-com bust) it has trended lower from well over 67% to the current 63.2%; which means the current unemployment rate would be almost 11% if the labor force was constant from when Obama took office. There appear to be at least four reasons (excuses) put forth for this dismal 'structural' trend but chief among them - and propagandized by most in the mainstream (given its lack of 'blame') - is the so-called 'aging of America' or demographics. There is only one problem with that 'myth'; it's entirely inconsistent with other Western economies who are experiencing exactly the same demographic shift. The collapse in the US labor force is, in fact, due to excess credit having fueled artificial growth for 2 decades; and now a government throwing free money at the population in the form of disability insurance (which has surged) and student loans (which are exponentially exploded). So who (or what) is to blame for the US' collapsing workforce? Simple, the unintended consequences of government interference.
So what is to blame for America's collapsing workforce? 1. The Aging Of America: Demographics - NO! Some claim that one big reason for the decline of the participation rate is the long-run demographic trend of now-retiring Boomers. However, this is just not supported by any facts. Compared to Canada, a nation similar in many respects to the US, the demographics - as represented by the following population pyramid are almost exactly the same...
So what explains this...
... the massive divergence in USA's and Canada's labor force participation rate? In other words, NO, it is not the aging of America that is driving the collapse of the working population in the USA... so what is it? 2. More Potential Workers Are Going On Disability - YES! As we have explained previously,
In fact, rather stunningly, the number of people on SSDI now exceeds the entire population of Greece.
and the application rate for SSDI is surging...
Sadly, as we noted here, it is now 'more economical' to not work that work for the lower incomes:
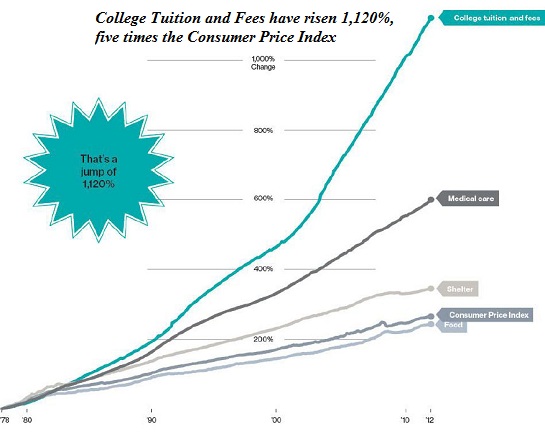
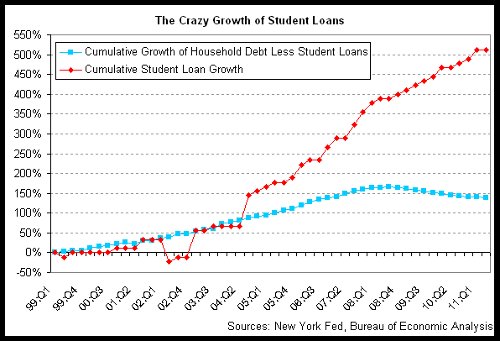
3. More Potential Workers Are Staying In School - YES!
The US economy remains stagnant at best and 'in recession' at worst and this is forcing millions of young people to prefer the safety of a government-funded student loan-driven 'educational system' to hide in as opposed to test the waters in the jobs market. As we pointed out previously,
As Charles Hugh-Smith noted previously,
4. "Growth" Since The 80s Has Been Credit-Fueled and Artifical And Now We Unwind - YES! As we noted yesterday, 'something' changed around the start of the 80s when economic growth diverged from labor. Coincidentally, US debt also began its exponential rise around that time and fueled 30 years of Keynes-inspired artifice - that is now seen for what is was...
and in fact, as David Stockman previously wrote in detail here,
Indeed, we have been losing private sector breadwinner jobs at the rate of 31,000 per months for thirteen and one-half years running, and as Stockman further explains:
So in conclusion:
Or as we have written in the past:
|
| Tokyo To Host 2020 Summer Olympics Posted: 07 Sep 2013 02:08 PM PDT Despite Mariano Rajoy's solemn promises that awarding the 2020 Olympics to Madrid would boost the Spanish GDP by 1.8% and lead to the creation of anywhere between 168,000 and a few hundred million new jobs (the latter number is a joke but since it comes from Rajoy, both are equally credible), the Olympic committee cut the Spanish contender before the final, which pitted Tokyo vs Istanbul. And when the final votes were tallied it was not even a contest: with 60 to 36 votes, the 2020 Olympics Games will be held in Tokyo: the city that was supposed to host the event in 1940 but due to the break out of World War II the event was delayed until 1964 (when it was almost cancelled again, permanently, following a modest escalation in nuclear deterrence between the US and USSR surrounding Cuba). Let's hope history does not rhyme.
While congratulations are certainly in order to the country which already has JPY1 quadrillion in debt so what is a few extra trillion here and there: it's not like any of it will ever be paid back, we do have some questions:
Naturally none of the above really matters since Japan will now be awarded something far more precious than Olympic Games: collateral, in the form of future construction, against which it can borrow even moar: because as Krugman will attest, 230% debt/GDP is for amateurs. Some more from BBC:
Of course not: when is the last time Japan lied about anything radiation-related, or anything else for that matter? Finally, as we posted over a year ago, Abe won't be happy to learn that contrary to even further currency devaluation expectations - the whole premise behind his Abenomics charade - Goldman found out that the countries which host Olympics tend to see their currenc appreciate. Hardly the Nikkei boosting, USDJPY surging event for the country with the insane PenNikkeistock market, where anything less than a 3% daily swing is a snoozefest, that many will desperately make this out to be. From July 2012: A Winning FX Strategy In part three of our five-part series tying the Olympics to economics (previously here and here), we note that in a rather surprising coincidence, the Olympics' host nation has been a rather simple tool to pick long-term 'winners' in the FX market. As Goldman points out, while we doubt that the Olympics directly affects the FX market, it has provided excellent long-term appreciation potential. We assume this means that the BoE will stop QE or we really don't see cable extending this performance record, though the findings suggest that systematically picking the 'next' host tends to pick winners more than losers.
Goldman Sachs: The Olympics As A Winning FX Strategy Is it possible that the Olympics affect foreign exchange markets? At first glance, this may seem unlikely as the Olympics are a relatively small event when compared to the size of the Global FX market, which turns over several trillion Dollars every single day. However, from an economic point of view, the question does make some sense. In a standard open economy model, government spending such as constructing the Olympic sites and improving the infrastructure typically leads to real appreciation. Also, a country hosting the Olympics is likely to see an influx of visitors during the actual Games. This would be recorded as a services export in the balance of payments and, all else equal, it would increase the demand for local currency. To investigate whether the Games do affect FX markets, we constructed a real effective exchange rate for the Olympics, by combining the Goldman Sachs Real Trade Weighted FX Indices (GS RTWI) of the host countries starting after the Moscow Olympics in 1980. For example, the GS RTWI for the Chinese Yuan is used between August 29, 2004 (the closing date of the Athens Olympics) and August 24, 2008 (the closing ceremony of the Beijing Olympics). For host cities in the Euro area, we use the Euro RTWI.
The Olympic RTWI has appreciated by around 90% since the end of the Moscow Olympics in 1980, which is vastly more than any other individual currency (apart from a few hyperinflation cases with highly unstable exchange rates). The table shows that the currency with the second strongest real appreciation was the Japanese Yen: it has appreciated by around 54% since 1980, and remains substantially below the appreciation of our synthetic Olympic index. This suggests that individual currencies do tend to appreciate more than usual in the run-up to hosting the Olympics. By systematically picking the next hosting currency, the Olympic FX Index tends to pick 'winning' currencies more often than 'losers'. However, there are a few important caveats. First, the four-year periods preceding the Seoul 1988, Sydney 2000 and London 2012 Olympics saw the host currency depreciate. In other words, the Olympic FX Index is not guaranteed an FX Gold Medal. Second, real effective exchange rates can appreciate because of high inflation rather than nominal appreciation. Carry may be higher as well, meaning that investors may still be able to benefit, but Olympic currencies are not guaranteed to appreciate in nominal terms. To check the performance of the Olympic currency, we calculated the return to date on an initial investment of $100 in the Olympic currency at the end of the Moscow Games, including carry. Following the host country rules laid out above, this would mean that at the end of the Beijing Olympics the investment would have been shifted out of Renminbi and into Sterling. Starting with $100 in 1980, this Olympic investment would currently be held in Sterling and worth about $1,020. In comparison, investing $100 in rolling 1-year USD investments would have returned only about $700. In summary, the empirical results suggest that a synthetic Olympic currency would outperform over time. Even though Olympic investment spending is a relatively small share of GDP (for example, around 0.8% for the UK 2012 Games), one potential explanation is that there is a positive selection bias in picking the host city. For example, countries with strong growth in the years before a decision would be able to invest more in their Olympics bid, increasing the chances of winning the Games. This is even more so if growth is supported by a structural story that lasts longer than just one business cycle. The Beijing Olympics are an obvious recent example. Overall, we continue to doubt that the Olympics directly affect the foreign exchange market. However, the Olympics may be a rather simple tool to pick long-term 'winners' in the FX market with good long-term appreciation potential. |
| Top Economist Predicts Increased Gov’t Theft & Surge In Gold Posted: 07 Sep 2013 02:08 PM PDT  Today one of the top economists in the world warned King World News that we are going to see an increase in government theft of its citizens assets. Michael Pento, who heads Pento Portfolio Strategies, also made some incredibly bold predictions about what is coming in the bond, gold, silver, and mining shares markets. Below is what Pento had to say in this powerful interview. Today one of the top economists in the world warned King World News that we are going to see an increase in government theft of its citizens assets. Michael Pento, who heads Pento Portfolio Strategies, also made some incredibly bold predictions about what is coming in the bond, gold, silver, and mining shares markets. Below is what Pento had to say in this powerful interview.This posting includes an audio/video/photo media file: Download Now |
| Posted: 07 Sep 2013 12:51 PM PDT Yesterday we implied a difficult question when we illustrated the huge size of US Treasury bond holdings that China and Russia have between them - accounting for 25% of all foreign held debt - implicitly funding US standards of living (along with the Federal Reserve). The difficult question is "Can the U.S. really afford to greatly anger the rest of the world when they are the ones that are paying our bills?" What is going to happen if China, Russia and many other large nations stop buying our debt and start rapidly dumping U.S. debt that they already own? If the United States is not very careful, it is going to pay a tremendous economic price for taking military action in Syria.
Via Michael Snyder of The Economic Collapse blog, At this point, survey after survey has shown that the American people are overwhelmingly against an attack on Syria, people around the globe are overwhelmingly against an attack on Syria, and it looks like the U.S. Congress is even going to reject it. But Barack Obama is not backing down. In fact, ABC News is reporting that plans are now being made for a "significantly larger" strike on Syria than most experts had expected. If Obama insists on going forward with this, it will be the greatest foreign policy disaster in modern American history. Right now, both Russia and China are strongly warning Obama not to attack Syria. And Russia is not just warning Obama with words. According to Bloomberg, Russia has sent quite a collection of warships into the region...
China is also letting it be known that they absolutely do not want Obama to hit Syria. On Friday, China issued a warning about what military conflict in the Middle East could do to "the global economy"...
And according to Debka, China has also deployed "a number of warships" to the region...
If the U.S. attacks Syria, Russia and China probably will not take immediate military action against us. But they could choose to hit us where it really hurts. According to the U.S. Treasury, foreigners now hold approximately 5.6 trillion dollars of our debt. Over the past couple of decades, the proportion of our debt owned by foreigners has grown tremendously, and today we very heavily depend on nations such as China to buy our debt. At this point, China owns approximately 1.275 trillion dollars of our debt, and Russia owns approximately 138 billion dollars of our debt. So what would happen if China, Russia and other foreign buyers of our debt all of a sudden quit purchasing our debt and instead started dumping the debt that they already own back on to the market? In a word, it would be disastrous. As I have written about previously, the U.S. government will borrow about 4 trillion dollars this year. Close to a trillion of that is new borrowing, and about three trillion of that is rolling over existing debt. If China and other big foreign lenders quit buying our debt and started dumping what they already hold, that would send yields on U.S. Treasuries absolutely soaring. And we have already seen bond yields rise dramatically in recent weeks. In fact, on Thursday the yield on 10 year U.S. Treasuries briefly broke the 3 percent barrier. So what is going to happen if the yield on 10 year U.S. Treasuries continues to go up? The following are a few consequences of rising bond yields that I have discussed in previous articles... -It will cost the federal government more to borrow money. -It will cost state and local governments more to borrow money. -As bond yields go up, bond values go down. In the end, rising bond yields could end up costing bond investors trillions of dollars. -Rising bond yields will cause mortgage rates to skyrocket. In fact, we are already starting to see this happen. This week the average rate on a 30 year mortgage hit 4.57 percent. -Higher interest rates will mean a slowdown in economic activity at a time when we definitely cannot afford it. -As economic activity slows down, that will be very bad for stocks. When the next great stock market crash happens (and it is coming), equity investors could end up losing trillions of dollars of wealth. -Of course the biggest threat of all is the 441 trillion dollar interest rate derivatives time bomb that is sitting out there. Rapidly rising interest rates could potentially bring down several of our "too big to fail" banks in rapid succession and throw us into the greatest financial crisis the nation has ever seen. Are you starting to get the picture? And the 3 percent mark is just the beginning. Brent Schutte, a market strategist for BMO Private Bank, told CNBC that he expects the yield on 10 year U.S. Treasuries to eventually go up to 6 or 7 percent...
If that happens, we will experience a full blown financial meltdown. Of course it would greatly help if Obama would back down and not attack Syria. As Vladimir Putin noted at the G20 summit, large nations such as India, Brazil, South Africa and Indonesia are all strongly against the U.S. taking military action...
Can we really afford to have most of the international community turn on us and quit buying our debt? Of course not. Sadly, as I noted the other day, Obama appears to be locked into doing the bidding of Arab countries such as Saudi Arabia and Qatar. In fact, as the Washington Post reported the other day, Secretary of State John Kerry has even admitted that they are even willing to pay all of the costs of a U.S. military campaign that would overthrow Assad...
Why aren't we hearing more about this in the news? Fortunately, despite the relentless propaganda coming from the mainstream media, a lot of members of Congress are choosing to take a stand against this war. For example, U.S. Representative Tom Marino recently shared the following about why he is voting against military action in Syria...
And Marino is very right. There are no "good guys" in Syria. The "rebels" are murderous jihadist psychotics that would be even worse than Assad if they took power. For much more on what the mainstream media is not telling you about the war in Syria, check out a stunning video report from investigative reporter Ben Swann that you can find right here.
The picture above comes from the official Facebook page of one of the "rebel groups" in Syria. I am sure that you do not need me to point out that the White House is burning in the background of the picture. These are the people that Obama wants to help? According to NBC News, the rebels are also displaying images of the black flag of al-Qaeda on Facebook too...
Let's assume for a moment that Obama is successful in Syria and that Assad is overthrown. That would hand Syria over to al-Qaeda. Once in power, the "rebels" would slaughter or force the conversion of millions of Christians, Jews and non-Sunni Muslims that have been living peacefully in Syria for centuries. To those that would support this war, I would ask you this question... Is that what you want? Do you want the blood of millions of Christians, Jews and non-Sunni Muslims on your hands? If you are a Christian that is supporting Obama on this, I would ask you to consider an excerpt from a letter from Christian nuns in Azeir, Syria that I have posted below...
You can read the rest of that letter right here. Also consider the following shocking video of Senator John McCain being confronted by a very emotional woman that says that her 18-year-old cousin in Syria was just killed by rebels loyal to al-Qaeda...
Any American that supports this war is aiding al-Qaeda. Any American that supports this war is choosing to ally themselves with radical jihadist Christian killers that want to conquer the entire Middle East in the name of Sunni Islam. If Congress votes to approve this war, then we should do what one site has suggested and send those that vote yes to Syria. They don't even have to fight. We'll just drop them off in the middle of the "rebel forces" and entrust them into the gentle hands of the al-Nusra Front. But of course they would never go. The ones that will be endangered will be the precious sons and daughters of other Americans. This is not a war that has a good outcome for America. Conservative voices and liberal voices all over the country are joining together to speak out against this war. Hopefully Barack Obama will listen and cooler heads will prevail. If not, things could spin wildly out of control very rapidly. |
| Dr. Nu Yu’s Back With Analyses on Gold & Silver, USD, Crude Oil, HUI/XAU, U.S. Bonds Posted: 07 Sep 2013 12:37 PM PDT Don’t undertake any buy or sell decisions regarding, physical gold and silver, the The excerpts below come from Dr. Nu Yu’s (www.marketweeklyupdate.com) Market Weekly Update and are presented by Lorimer Wilson, editor of www.munKNEE.com and www.FinancialArticleSummariesToday.com and the FREE Market Intelligence Report newsletter (sample here – register here). The excerpts may have been edited ([ ]), abridged (…) and/or reformatted (some sub-titles and bold/italics emphases) for the sake of clarity and brevity to ensure a fast and easy read. This paragraph must be included in any article re-posting to avoid copyright infringement. Edited excerpts from Dr. Nu Yu’s newsletter are below: Short-Term Picture: S&P 500 Index in a 4-Month Uptrend Channel The S&P 500 index has formed a 4-month bullish uptrend channel. A pullback or a downwave towards the lower boundary of the channel around 1610 is expected.
 Market Ratio and Competitive Strength Each week I talk about a pair of markets…[and this week we look at] the euro vs. the U.S. dollar. Euro vs. U.S. Dollar: The chart below is a weekly chart for the ratio of the euro to the U.S. dollar in last seven years. The ratio has been in a symmetrical triangle pattern for six years. The central line of the triangle is at 1.7. Currently the ratio swings up towards 1.70 to make Euro stronger than the US dollar.
 Gold Forming 11-Month Descending Broadening Wedge Pattern The gold index is forming an 11-month Descending Broadening Wedge pattern on the daily chart. Last week price touched the upper boundary of the wedge and began falling again. Gold should become neutral before it breaks above the upper boundary of the wedge.
 Long-Term Picture: Silver in a 2.5-Year Falling Wedge Pattern The silver index has formed a 2.5-year falling wedge pattern. Silver will remain bearish with range-bounded swings before a breakout from the wedge.
 Gold/Silver Mining Stocks Forming 4-Month Inverted Roof Pattern Gold/silver mining stocks are forming a 4-month inverted roof pattern. They could become bullish once prices break above the horizontal resistance line of the inverted roof.

Crude Oil in 8-Week Trading Range Crude oil has been in consolidation and it has formed a 8-week trading range between 103 and 109. Last week an attempt to break above the upper horizontal resistance of the trading range failed. Prices should be in sideways range before a breakout from the trading range.
 US Dollar in 5-Month Broadening Symmetrical Triangle Pattern The U.S. dollar formed a 5-month Broadening Symmetrical Triangle pattern. In August, the 2-month-long downward wave failed to touch the lower boundary of the triangle, and it formed a Partial Decline inside the Broadening Triangle. According to Bulkowski, a partial decline usually appears at the end of a broadening pattern, and there will be an increased chance for an upward breakout.
 US Treasury Bond Forming a bump-and-run reversal bottom pattern The 30-year U.S. treasury bond is forming a Bump-and-Run Reversal Bottom Pattern. Now it is in the Bearish bump phase.
 Asset Class Performance Ranking with Crude Oil Leading The following table is the percentage change of each asset class (in ETFs) against the 89-day exponential moving average (EMA89). Currently Crude Oil is outperforming, and U.S. treasury bond is underperforming.
 [Editor's Note: The author's views and conclusions in the above article are unaltered and no personal comments have been included to maintain the integrity of the original post. Furthermore, the views, conclusions and any recommendations offered in this article are not to be construed as an endorsement of such by the editor.]*http://marketweeklyupdate.com/2013/09/02/09022013-market-update/ (©2010-2013 MarketWeeklyUpdate.com. All Rights Reserved) Related Articles: 1. King Dollar…Will It be a Breakdown or a Breakout? 
[As can be seen in the chart below] the U.S. Dollar has been trapped inside of a multi-year pennant pattern, which continues to narrow…[strongly suggesting that] the end of the pattern is near [one way or the other]! Read More » 2. The Stock Market Is NOT About to Crash Any Time Soon! Here's Why  There's nothing to be bearish about regarding the stock market these days. US stocks are not overpriced or overleveraged, and remain more attractive than at prior peaks so pop a pill and relax. There's no immediate danger threatening stocks as the following market analyses clearly outline. Read More »  We have experienced a huge bull market this year but any pundits are calling for the bullish move to end in a sharp downward correction…The bears have a case, historically and cyclically, but I am going to go out on a limb and say things are really different this time. Here are 5 reasons why. Read More » 4. Noonan: Gold & Silver Could Move Sideways for Another 1-2 Years – Here's Why  Using past history of how price responds, it is likely that gold, and silver, could move sideways for another year or two. While this flies in the face of so many current, supposedly “expert”, opinions [mine is not based on opinion but, rather, is strictly based on the facts as conveyed by the charts. Take a look and you will see that too!] Read More » 5. How Will the Price of Gold Evolve Into 2014 and Beyond? A Perspective  How will the price of gold develop into 2014 and in the following years? [Read on as] we try a look into the future. Words: 2600 Read More » 6. Here's How to Choose Gold & Silver Stocks With the GREATEST Chance of Major Returns  Which gold/silver mining companies own quality undeveloped gold and silver deposits in safe stable countries – and are extremely well managed? Such companies offer exceptional value in that they provide the best exposure to a rising precious metals price environment. Below are a number of things to look for when considering an investment in such companies. Read More » 7. U.S. Energy Independence Is A Pipe Dream!  I don’t want to kill the dream of U.S. energy independence but the fact is it won’t become a reality overnight. It’s entirely possible, however, that the North American continent [Canada, the U.S. and Mexico] can achieve energy independence within the next decade. [Let me explain.] Read More » 8. Eric Sprott: Gold & Silver Could Double Within a Year & PM Stock Gains Could Be Gargantuan  In this exclusive interview, Eric Sprott answers questions about the gold and silver market in which he suggests that gold could double in a year and, in the case of silver, could go up even more than that. As for gold and silver equities, he believes gains could be gargantuan, because the equities always double or triple the performance of physical gold. Here’s his reasoning. Read More » 9. Will Major Decline of S&P 500 Adversely Affect Gold & Silver Stocks?  Should gold stock investors and speculators worry about the effect of a deeper decline or cyclical bear market of the S&P 500 on the mining sector? [You'll be surprised at the answer!] Read More » The post Dr. Nu Yu’s Back With Analy |
| Posted: 07 Sep 2013 12:27 PM PDT Dear Ron, Jim has advised many times that it is best to simply tune out from the news that emanates from MSN. The reality is that we are in gold because it is the only way to survive the monetary mayhem that the world’s central banks have engineered. The short term aberrations of the gold... Read more » The post Jim’s Mailbox appeared first on Jim Sinclair's Mineset. |
| Gold And Silver - It Is Always About One Thing: Timing Posted: 07 Sep 2013 09:36 AM PDT Is the current rally from the lows the result of: A. Long lines to buy silver and gold coins world-wide B. Unprecedented demand for those same coins, year over year C. Drawdowns of physical gold/silver on COMEX D. Central bank PM vaults about empty |
| Cashing In Your Gold Insurance Posted: 07 Sep 2013 09:20 AM PDT One nation's recovery is another's credit crisis. Time to sell gold... COTTON is it, for the second anniversary? Today marked two years since gold hit its all-time peak so far. Tuesday 6th Sept 2011 was wet and windy, both in London and gold. Late Asian trade had seen the wholesale gold price rise 1.4%, reaching $1921 per ounce. Prices then turned lower, and by the time New York opened the air was hissing out of gold futures. |
| Posted: 07 Sep 2013 07:52 AM PDT Summary: Long term - on major sell signal since Mar 2012. Short term - on mixed signals. Gold sector cycle - up as of 8/16. Read More... |
| Gold And Silver - It Is Always About One Thing: Timing Posted: 07 Sep 2013 07:28 AM PDT There is one exceptional chart that best captures the essence of the current PMs scenario within its 5,000 or whatever year history, and it lets all know that everything else is a symptomatic consequence. When you understand the ... Read More... |
| Market Monitor – September 7th Posted: 07 Sep 2013 04:46 AM PDT Top Market Stories For September 7th, 2013: COMEX Deliverable Gold Bullion Drops To Levels Not Seen Since 2003 - Jesse's Cafe South Africa gold strike starts - producers - Mineweb War & One World Currency - GoldSilver.com Gold buyers rush to order as import rules clarified - Reuters Why the options market is telling you to |
| Gold: An attitude adjustment for institutional banks Posted: 06 Sep 2013 06:04 PM PDT Clif Droke |
| COMEX Deliverable Gold Bullion Drops To Levels Not Seen Since 2003 - Claims Per Ounce Around 55 Posted: 06 Sep 2013 05:36 PM PDT |
| COMEX Deliverable Gold Bullion Drops To Levels Not Seen Since 2003 - Claims Per Ounce Around 55 Posted: 06 Sep 2013 05:36 PM PDT |
 “Price discovery is not a sexy function of markets, but it is critical to the efficient allocation of scarce capital and resources, and to the preservation of the long term wealth of investors and the economy as a whole. If price discovery is compromised by manipulation, then we will all be gradually impoverished and the economy will be imbalanced and unstable.”
 The massive debt bubble created by our monetary system is about to burst. The demonetization of gold and silver, has over the years diverted value from these metals, to all paper assets (such as bonds) linked to the debt-based monetary system.


| You are subscribed to email updates from Save Your ASSets First To stop receiving these emails, you may unsubscribe now. | Email delivery powered by Google |
| Google Inc., 20 West Kinzie, Chicago IL USA 60610 | |
No comments:
Post a Comment