


saveyourassetsfirst3 |

- Inflation Watch: “They Are Capitulating…”
- Silver price divergence
- Why We See Gold Going Lower Long-Term
- SIR #19: Truckers Running on Fumes
- Shift to Physical Accelerates as Gold Rises in Dollars Only
- Financial Media Can’t Admit it’s a Bull Market
- Gold and Silvers Daily Review for April 20th, 2011
- No Real Estate Recovery For Several Years
- Look at these ETF charts before calling a top in silver
- Fleeing the Dollar Flood: The world tries to protect itself from U.S. monetary policy
- Putin: U.S. Monetary Policy Is ‘Hooliganism’
- Why Rob McEwen is STILL bullish on gold
- Silver Still Soaring
- Silver Still Soaring: The Short Covering Rally Continues
- Gold and Silver: Supreme Safe Haven Assets
- So Whats Different About $1500 Gold...?
- Silver: Eligible Versus Registered and About That Big Inventory Change at Scotia Mocatta
- Penn West: A Low Risk Way of Protecting Your Portfolio Against High Oil Prices
- Silver – The Early Stages of Re-monetisation?
- Silver ETF Rally Continues, But for How Long?
- 24 Signs Of Economic Decline In America
- Silver Seems Set to Soar as Paper Folds
- Precious Gold 101: As Reliable as Ever
- Silver Set to Soar as Paper Folds?
- Investors Pile Into Precious Metals; Price of Lumber Plummets
| Inflation Watch: “They Are Capitulating…” Posted: 22 Apr 2011 02:37 AM PDT Lately just about the only things not soaring in price are US houses and electronics beginning with "i". Raw materials, for instance, have had a good week based on the price action of this commodities ETF:
Those higher raw material costs seem to be finally working their way through to restaurant results:
Oil and gasoline are inching up:
Precious metals and the US dollar continue to move in opposite directions:
And home prices are soaring in countries to which the US is exporting its inflation:
Then there's this from Brazil, with one very interesting passage (bold added below):
Some thoughts:
|
| Posted: 22 Apr 2011 01:01 AM PDT I logged on this morning and found something very strange. Kitco pricing is not matching the other majors. Right this minute at 10 am EST I get these quotes: Bullion Desk: Bid Ask +/- LDN Silver 47.20 47.29 0.72 14:56 Kitco: Bid/Ask 46.68 46.72 Low/High 46.50 46.77 Change +0.07 +0.15% I use bullion desk on my website, as I deal in Canadian dollars and they have a realistic exchange rate, unlike Kitco. Any thoughts? |
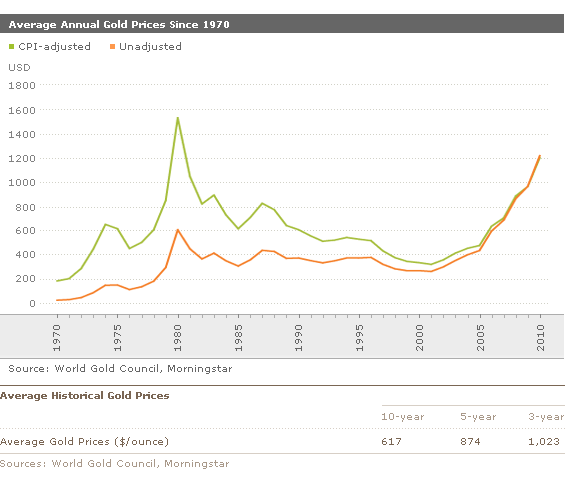
| Why We See Gold Going Lower Long-Term Posted: 22 Apr 2011 12:57 AM PDT Morningstar submits: by Joung Park After exhibiting few signs of life during much of the 1980s and 1990s, gold prices have revived during the last 10 years, climbing more than five-fold from the 2001 average price of less than $300 per ounce to more than $1,400 today. So what drove this massive increase in gold prices during the last decade? We believe four major factors have been largely responsible for the recent surge in gold prices:
While we think that some of these factors could continue to provide a tailwind for gold prices, we believe many of the factors cited above are unsustainable over the long run, thereby lending support to our Complete Story » |
| SIR #19: Truckers Running on Fumes Posted: 22 Apr 2011 12:56 AM PDT This report was sent to subscribers on April 20, 2011. Join our free mailing list to receive actionable SIR information 48 hours before it is posted for the public… EXECUTIVE SUMMARY:
• Trucking is one of the most expedient, but also one of the most inefficient modes of freight transportation. • Equities in this sector have been bid higher as investors buy into the economic recovery and fail to discount risks from higher fuel costs. • Three trucking companies are vulnerable to a sharp decline as investors begin to take stock of mounting risks:
~~~~~~~~~~~~~~~~~~~~~~~~~~~~~~~~~~~~~~~~~~~~~ It's no secret that oil prices have been climbing – increasing transportation costs for consumers and businesses alike. To a certain extent, this dynamic has been largely glossed over by Wall Street. At this point, the majority of fund managers and institutional investors are buying into the recovery thesis. After all, the Fed has been flooding the economy with cheap capital and we have essentially bought our way out of the financial crisis. But the big question is at what cost? Sure, we may have manufactured a few percentage points of GDP growth. But the taxpayers (present and future) have ponied up trillions of dollars to generate this feeble recovery. More importantly, the flood of capital along with increasing demand from emerging markets has generated significant inflation for key commodities. The CPI numbers fail to show the true effect, but looking just at the costs for agricultural and energy commodities, we can see a significant inflationary effect. This inflationary effect has been a significant challenge for emerging markets where food, housing, and energy costs make up a material portion of monthly income. The effects have been muted in developed nations because of our higher level of discretionary spending. But that doesn't mean inflation won't eventually cause much more severe challenges. For retailers, higher energy costs are beginning to affect business from two primary angles:
It seems that this second issue has been largely ignored – possibly because higher manufacturing and distribution costs have been offset by lower labor expenses. Companies are getting more done with fewer people. And with high unemployment rates, wage pressures are virtually nonexistent. Fuel Costs and the Trucking Industry Higher fuel prices don't automatically translate directly to lower profits for the trucking industry. Most fleets are able to pass fuel surcharges on to customers and materially offset rising costs. But when fuel prices shift materially, it can cause retailers to begin rethinking their shipping priorities. Short-haul routs may still be a necessity, but when it comes to longer distance shipping, there are better alternatives. Rail transportation is inherently less expensive in terms of fuel costs. For instance, in 2009, CSX averaged 468 miles per gallon per ton. Typically, it takes about three times as much fuel to move the same weight and distance by highway trucking. For retailers that continue to move freight by truck, higher fuel costs will do one of two things. Either the retailer will accept lower profit margins as a result of higher transportation costs, or the retailer will raise prices for consumers. While lower profit margins may be a short-term solution, eventually, prices will have to rise across the board. And according the the laws of supply and demand, higher prices naturally lead to lower quantity demand. As the inflationary effects of higher fuel prices evolve, truckers are going to have to face a choice similar to the retailers' conflict. Passing on higher fuel costs in the form of fuel surcharges will eventually cause retailers to cut back on shipping. However, choosing NOT to pass on these higher costs will eat into profit margins. Either way, the environment is expected to become much more challenging for traditional trucking companies. Vulnerable Stock Prices Trucking stocks have been strong for the last several months. Relatively stable retail sales figures along with a slight improvement to jobless claims have been a bullish factor. Investors appear willing to believe in a growing recovery, and are paying higher earnings multiples for the cash-flow positive trucking companies. But with this confidence comes additional risk. If optimistic assumptions are challenged, the price / earnings multiples will surely contract. Remember, the market hates uncertainty and right now, institutional investors are operating under the construct of false-certainty. Employment strength is not as positive as the headlines imply. The labor participation rate has been dropping, meaning there are significantly more workers who are simply discouraged and choosing not to look for employment. As the Fed begins to wind down stimulus measures, the feeble recovery (which is basically still on life support) will be required to sustain itself. The danger is that retailers begin to feel the pinch as both low-end consumers as well as affluent buyers continue to feel the effects of tighter policy, and increased inflation. Up to this point, the lower-end consumers have been hit the hardest, while employment and income have remained stable for higher wage earners. A withdraw of stimulus could be the catalyst for lower spending from the affluent consumer, and in turn, smaller shipments for truckers to carry. Price action will be most important variable when determining our trade timing, but we have three trucking stocks picked out as short candidates when the decline begins:  Old Dominion Freight Line (ODFL)
• Equity offering may be the most efficient use of a high stock price, but dilutes current shareholders. • Growing average length of haul puts the company in direct competition with the rail industry. • Faltering chart is close to breaking through support – igniting bearish interest. ~~~~~~~~~~~~~~~~~~~~ Old Dominion is trading at a premium valuation. Analysts expect the company to earn $1.77 per share this year, and the stock is trading near $34. A forward PE above 19 is well above the historical average for this capital-intensive business. The premium price implies that investors are expecting significant long-term growth – and analyst expectations have been gradually increased over the last several months. In 2011, the expectation is for earnings growth of 31% despite the fact that revenue will only grow by about 18%. For 2012, the growth assumptions are similar, with EPS expected to increase by 23%, with revenue growth decelerating to 12%. Following the logic on these assumptions, analysts are expecting profit margins to increase despite the fact that fuel costs are higher and likely to bite into both shipment volumes as well as the ability to pass elevated costs on to consumers. In addition to the business concerns, equity investors also have to deal with a significant stock sale being enacted by the company. According to a press release issued in conjunction with the company's fourth quarter earnings release, Old Dominion is attempting to sell $100 million worth of additional stock. From a business perspective, this sale actually makes a lot of sense. Management is using its elevated stock price as "currency" – raising capital to cover capital expenses and potentially make acquisitions. But the strategic decision implies that management believes their stock price is at least somewhat overvalued – and they are attempting to take advantage of this premium valuation. Current stockholders will see their ownership of the company diluted, while management receives a $100 million blank check which may or may not be used productively. One of the issues that makes Old Dominion particularly vulnerable is the increasing average length of haul. As of the last reporting period, ODFL's average haul is 948 miles – a figure that has been growing annually for a number of years now. Ironically, while longer hauls use less fuel per ton per mile, the increasing route distance also puts the company in more direct competition with the rail industry. Highway truckers simply can't compete in terms of efficiency when compared to shipments by rail. In the future, truckers are likely to be more profitable by charging premiums (per distance) for shorter routes, rather than competing with rail carriers to deliver the same service. Technically, ODFL has been in a relatively strong bull market for a number of months now. But the stock is beginning to show signs of fatigue and could be a great short if it breaks down from this point. In late March, ODFL broke out of a three-month base, only to run into resistance just above $36. Since that time, the stock has come back to test the breakout point, and considering the weakening market, that test may fail. If ODFL trades decisively below $34, it will also break the 50 EMA which could be a major sell signal for momentum traders. Price action continues to be the key variable for pulling the trigger on a short position, but the components for an attractive reward-to-risk scenario are coming together.
Landstar System (LSTR)
• Premium valuation is vulnerable considering industry challenges. • Deceleration in revenue growth raises questions about expectations. ~~~~~~~~~~~~~~~~~~~~ Take a peek at Landstar System's website and you'll naturally assume that the company is a leader in a number of different transportation business lines. The company's tag line of "Providing Supply Chain Solutions and Complete Global and Domestic Transportation Services" sounds very impressive. But in actuality, the company is a trucking firm – with 91% of revenues derived from independent business capacity owners (BCOs) and truck brokerage carriers. There's nothing wrong with being in one business and doing it well. But investors should realize that the company is first and foremost a trucking company – with all the risks and opportunities that come along with this business. Questionable Growth Rates The biggest risk that I see with Landstar right now is that investors are likely over-estimating the company's potential growth, while failing to realize the industry risks which will directly affect this company. For 2010, the company grew earnings by nearly 30%, an impressive feat as the economic recovery took hold. In 2011, analysts expect earnings growth to decelerate to 19%, and for next year growth is expected to come in 17% higher. But looking carefully at the company's traffic and revenue levels, there are some concerning issues rising. For starters, the total number of company loads increased by only 10% last year. That's all well and good when pricing power is at your back. But if LSTR is entering an environment with tighter pricing metrics and lighter retail shipments, the earnings growth could decelerate much more quickly than analysts currently expect. More importantly, we are already seeing signs of deceleration in revenue growth. For the December quarter, the company grew revenues by only 7%, while still reporting a 35% increase in profit. The number of loads for the quarter actually decreased during this period, not a great sign for a company priced for growth. At this time, Landstar's stock is still tracking well above its 50 day average, and holding above a breakout level from early April. But over the last few weeks, volume has been decreasing – possibly a sign that institutions are backing off purchase programs. Once again, we're waiting for price action to signal trouble before committing capital on the short side. But given the high valuation, and growth concerns, LSTR could be an excellent plunge candidate when the market begins to lose momentum. The company announces earnings Thursday (4/21) before the open. Certainly, this earnings announcement could turn out to be the initial catalyst, knocking shares out of their currently bullish pattern.
Werner Enterprises (WERN)
• Optimistic valuation leaves plenty of room for disappointment. • Breakout failure discourages momentum traders. ~~~~~~~~~~~~~~~~~~~~ Over the past four quarters, Werner Enterprises has increased profits in a truly remarkable way. Despite the fact that average revenue growth has been in the single digits (less than 10% year-over-year), earnings per share have grown by 50%, 61%, 27% and finally 32%. The impressive part of this growth is how the company has managed to manufacture efficiency gains for a significant amount of time. Investors have rewarded the company – especially in the last six months. The stock has rallied nearly 40% from its short-term low in August. Investors are now paying nearly $20 for every dollar the company earns as further growth is expected. While efficiency gains are certainly impressive and worth striving for, earnings can only improve so much due to better internal margins. At some point, if the company is going to continue to grow, revenue has to appreciate - and appreciate by a material amount. The risk with WERN right now is that investors may be overly confident when it comes to future growth, without fully discounting the risks of an economic setback. Werner appears vulnerable from two distinct perspectives: First, the company has become increasingly reliant on the retail industry. Over the past two years, retail merchandise has grown to represent 49% of the company's revenue. More stable categories like grocery products and manufacturing shipments have declined as a portion of revenue. This leaves Werner vulnerable to a slowdown in the retail market – a vulnerability that current investors appear to be glossing over. Secondly, the company has been reducing its fleet of trucks. Reductions in maintenance costs have certainly helped the company become more efficient and profitable. But if investors are betting on future growth, one has to wonder how this growth will take place… Cutting capacity is a short-term fix for growing earnings. But it doesn't help much in terms of creating a long-term platform for growth. Looking at the stock chart, WERN traded through a relatively tight consolidation into the second half of March. At the end of the month, the stock broke to new highs on robust volume. But within a week, the stock fell back into the range, disappointing breakout buyers. If WERN violates the low end of this trading range (below $25.) the action would invite trend followers to place bearish bets, and would also leave breakout buyers trapped in a losing position. Given the company-specific and broad economic challenges, this break could offer an excellent inflection point for initiating a short position.
|
| Shift to Physical Accelerates as Gold Rises in Dollars Only Posted: 21 Apr 2011 11:48 PM PDT |
| Financial Media Can’t Admit it’s a Bull Market Posted: 21 Apr 2011 11:45 PM PDT The Daily Gold |
| Gold and Silvers Daily Review for April 20th, 2011 Posted: 21 Apr 2011 11:41 PM PDT |
| No Real Estate Recovery For Several Years Posted: 21 Apr 2011 09:08 PM PDT Special Real Estate Report On Fallout From Inflation-Hyperinflation. Is it possible to have inflation-hyperinflation in food and energy yet, see real estate prices continue to collapse? Yes it's possible and it's been happening. The great debate over inflation versus deflation has several moving parts. When credit is destroyed most commerce and especially real estate comes to a screeching halt and crashes. This is our current dilemma and it's growing worse by the day. However, people need to eat and drive. With sinking currency values, food and energy prices cost a lot more. This continues as long as old, bad debts, and over-printing of currencies and bonds stay in the game. Central bankers of the world are trapped. If they raise interest rates, all commerce stops and economies crash. If they continue to print, values are driven lower and daily needs' prices skyrocket. Japan Got It The Worst With A Triple Whammy. "The triple tragedy of earthquake, tsunami and nuclear crisis in Japan may have global consequences that go well beyond atmospheric radiation." "Three distinct categories of inflationary pressures have been created: 1) Demand Inflation pressures, 2) Supply Inflation pressures, and 3) Interest-Rate pressures that could lead to increased global monetization." http://danielamerman.com/articles/2011/Japan3.htm The Worst Media Remarks Come From So-Called Expert Authorities …discussing An Economic Recession-Recovery. This is not a recession and for sure it is not a recovery. We sit in Greater Depression II within a quiet hurricane center. All is calm before the storm. The coming typhoon will be legendary. (Editor) That discussion is cruel joke. There is no recovery until our global system is washed clean from all bad debts both public and private. Further, governments must get out of the way with their mountains of bureaucratic red tape and road-blocking of capitalist growth. National budgets are out of control and in the USA we do not even have a budget despite they're being mandated by law. Our administration is so politicized it appears they have deliberately embarked upon a path of total economic devastation. Central bankers' Catch-22 predicament of printing versus raising rates will continue until we all implode. The day of reckoning is near. There will be an economic whirl-wind beyond comprehension. The final outcome could determine not only the course of America but the path of the entire world. "Paulson Sees Falling Home Prices as Risk to Recovery." "U.S. home prices are unlikely to rebound this year because banks aren't willing to lend while there's uncertainty over their rights to foreclose, money manager John Paulson told Les Echos in an interview. The U.S. needs construction of at least 1 million to 1.2 million new homes a year for a solid economic recovery, Paulson said, according to the newspaper. Less than 300,000 new homes are being built, said the money manager, whose firm, Paulson & Co., over-sees $36 billion." (Ed: Late Thursday court news favored bankers). "In my eyes, the major risk for the American recovery is the stagnation of the residential real-estate market," Paulson said, according to the Paris-based financial newspaper. "It will be difficult to have a rebound in real-estate prices this year." "The Federal Reserve's economic stimulus plan creates a risk of inflation, Paulson said. Because of that risk, the price of gold can rise farther, he said. While it's possible the dollar will lose its status as a reserve currency, "it's necessary to look at currencies in relative terms," he said. The U.K. is following a similar path to the U.S. in terms of stimulus, and "the Euro has its own problems," Paulson said." "With inflationary risks in the next three to five years and the instability of the Euro, gold provides protection against currency devaluation, he said. The firm has about 3 percent of its assets in gold, and has created gold-denominated share classes of its funds, he said." -Phil Serafino 4-10-11 Bloomberg.net When Home Prices Shot To The Sky We Knew A Big Bad Bubble Was Process. -Editor "Here is Robert Shiller's plot of U.S. home prices, population, building costs, and bond yields, from Irrational Exuberance. Shiller shows inflation-adjusted U.S. home prices increased 0.4% a year from 1890–2004 and 0.7% a year from 1940–2004. U.S. census data from 1940–2004 shows self-assessed value increased 2% per year." Our sell signal came in June, 2005 when lumber futures took a dive along with our recognition that toxic banker-derivative credits were set to implode. Greenspan produced a housing bubble by providing give-away interest rates. Housing industry professionals all jumped in with poor or, no underwriting, overblown appraisals, while sticking people in homes they could not afford. Got a pulse-Got a Job-Got a House. What ticks me off is Greenie's sincere effort to cover and lie about not knowing or, understanding what he was doing. It was deliberate and he knew it-to prop markets. "Housing bubbles may occur in local or global real estate markets." -Wikopedia "In their late stages, bubbles are typically characterized by rapid increases in the valuations of real property until unsustainable levels are reached relative to incomes, price-to-rent ratios, and other economic indicators of affordability." "This may be followed by decreases in home prices that result in many owners finding themselves in a position of negative equity—a mortgage debt higher than the value of the property. The underlying causes of the housing bubble are complex. Factors were historically low interest rates, lax lending standards, and a speculative fever." "While bubbles may be identifiable in progress, bubbles can be definitively measured only in hindsight after a market correction, which in the U.S. housing market began in 2003–2006. Former U.S. Federal Reserve Board Chairman Alan Greenspan said "We had a bubble in housing", and also said in the wake of the subprime mortgage and credit crisis in 2007, "I really didn't get it until very late in 2005 and 2006." (Editor: That's BS). "The mortgage and credit crisis was caused by the inability of a large number of home owners to pay their mortgages as their low introductory-rate (sub-prime) mortgages reverted to regular interest rates. Freddie Mac CEO Richard Syron concluded, "We had a bubble," and concurred with Yale economist Robert Shiller's warning that home prices appear overvalued and that the correction could last years, with trillions of dollars of home value being lost." -Editor: They are finally catching on to reality. "Greenspan warned of "large double digit declines" in home values "larger than most people expect." Problems for home owners with good credit surfaced in mid-2007, causing the U.S.'s largest mortgage lender, Countrywide Financial, to warn that a recovery in the housing sector was not expected to occur at least until 2009 because home prices were falling "almost like never before, with the exception of the Great Depression." (Editor: Greenie warned on nothing until the game was over. It was obvious the carnage he had produced with his 1% interest). "The impact of booming home valuations on the U.S. economy since the 2001–2002 recession was an important factor in the recovery, because a large component of consumer spending was fueled by the related refinancing boom, which allowed people to both reduce their monthly mortgage payments with lower interest rates and withdraw equity from their homes as their value increased." -Wikopedia        This posting includes an audio/video/photo media file: Download Now |
| Look at these ETF charts before calling a top in silver Posted: 21 Apr 2011 08:51 PM PDT  Are you trying to call a top in silver? You're not alone – I've been picking up on a lot of chatter in the blog (and email) world about traders and analysts trying to call that proverbial "top" in Silver "any day now." Before you can't fight the temptation any longer, at least take a look at these four charts – Two Daily and Two Weekly – of major Silver ETFs SLV (bullish) and ZSL (ultra-bearish). This is well worth your time...and I thank reader N.A. for sharing it with us...and the link is here. |
| Fleeing the Dollar Flood: The world tries to protect itself from U.S. monetary policy Posted: 21 Apr 2011 08:51 PM PDT  Here's a story out of yesterday's edition of The Wall Street Journal that's courtesy of Washington state reader Roy Stephens. Members of the International Monetary Fund emerged from their huddle in Washington last weekend resolved to keep every option open to slow the flood of dollars pouring into their countries, including capital controls. That's a dangerous game, given the need for investment to drive economic development. But it's also increasingly typical of the world's reaction to America's mismanagement of the dollar and its eroding financial leadership. The link to this worthwhile story is here. |
| Putin: U.S. Monetary Policy Is ‘Hooliganism’ Posted: 21 Apr 2011 08:51 PM PDT  "Look at their trade balance, their debt, and budget. They turn on the printing press and flood the entire dollar zone — in other words, the whole world — with government bonds. There is no way we will act this way anytime soon. We don't have the luxury of such hooliganism," Russian Prime Minister Vladimir Putin said. This short story is one that I borrowed from yesterday's King Report...and it's a must read...and the link is here. |
| Why Rob McEwen is STILL bullish on gold Posted: 21 Apr 2011 08:51 PM PDT  Here's a Broadcast News Network story from Toronto yesterday that was sent to me by reader George Findlay. The story itself is only semi-interesting...but the interview with Rob McEwen is a must watch/listen. Just click on the stack of gold bars once you've brought the story up on your screen. The link to the BNN piece is here. |
| Posted: 21 Apr 2011 08:51 PM PDT  I've been poking around the Internet for more than twelve years...and I don't remember a time when I didn't know who Carl Swenlin [decisionpoint.com] was. This is an excerpt from Friday's blog to his subscribers...and reader U.D. was kind enough to share it with us. This is what he had to say in his opening paragraph... |
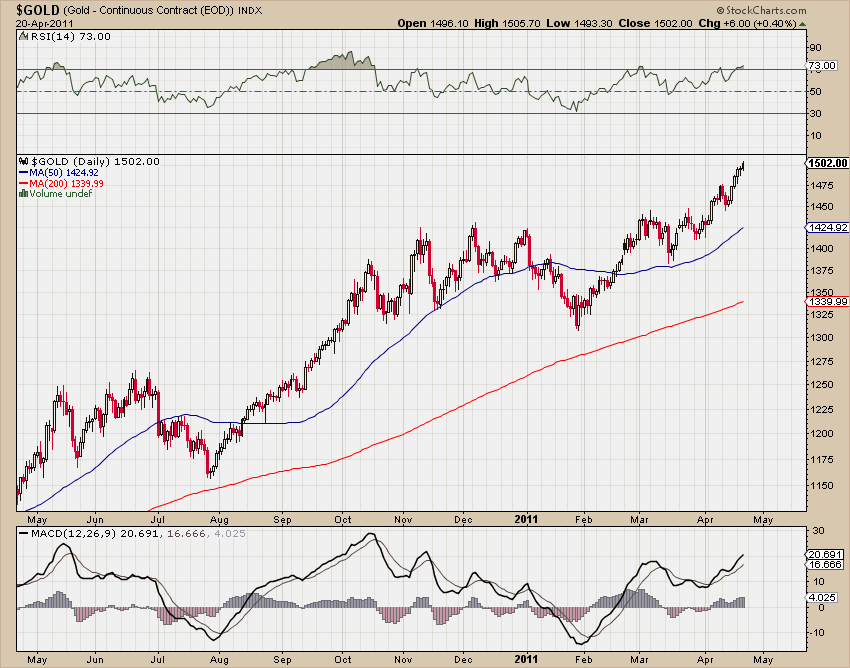
| Silver Still Soaring: The Short Covering Rally Continues Posted: 21 Apr 2011 08:51 PM PDT ¤ Yesterday in Gold and SilverThe gold price didn't do much of anything yesterday and...looking at the Kitco chart below...it's obvious that the gold price hasn't done very much of anything during the last three trading days, despite the rather precipitous decline in the U.S. dollar during that time period.
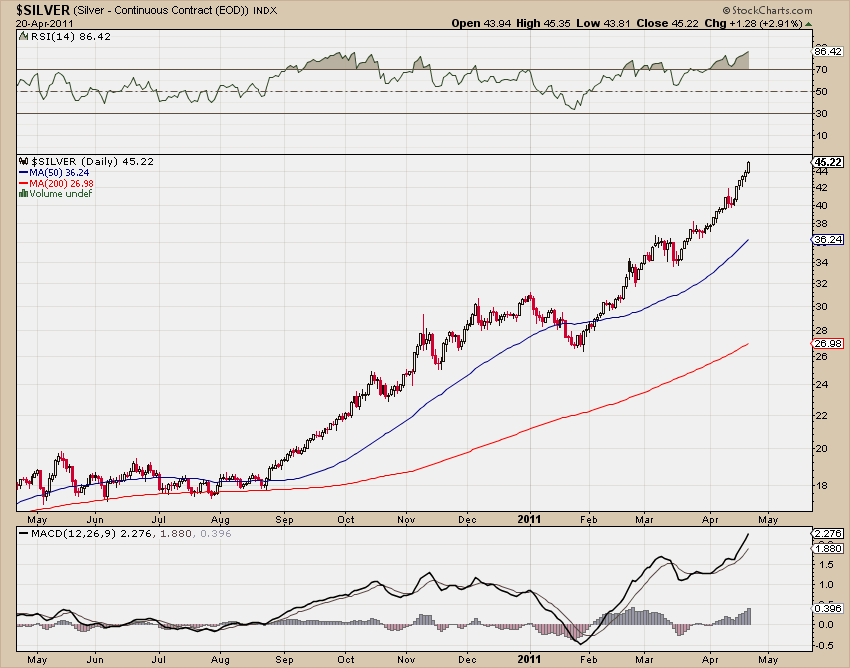
The silver graph below just shows how much silver has become a different animal than gold. The dollar graduations on the Kitco graph below tells all. From silver's low on this chart, to its close on Thursday, silver has risen 8.4%...compared to gold's 1.3% over the same time period. This has nothing to do with the dollar. It's a short-covering rally, pure and simple...with Thursday's price action being more of the same. Volume, once again, was very heavy.
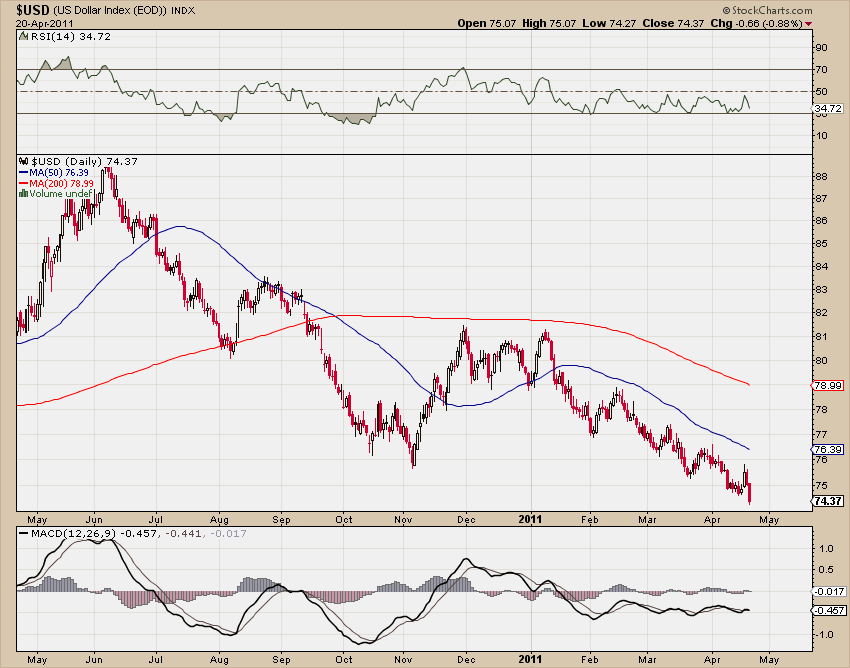
The dollar continued its decline on Thursday, reaching its nadir of 73.75 around 11:00 a.m. in London...which is 6:00 a.m. Eastern time. From there, the dollar recovered to 74.10 by the close of Thursday trading in New York. It's obvious from the precious metal charts, that the dollar was not a factor in yesterday's price action. And not that I want to put too fine a point on this, but the gold price has barely reacted at all to the big decline in the U.S. dollar during the entire week just past.
The gold stocks were rather jumpy in early trading yesterday...but then settled down somewhat, with the HUI finishing up an even 1% on the day. The silver stocks did somewhat better, but it was very uneven...and you'd never guess by looking at the action of either the gold or silver stocks, that we're at record highs in the gold price...along with a silver price that's screaming to the upside by at least a dollar a day.
As I said, the silver stocks did better, but prices were mixed. The top-callers are still yelling their lungs out...and most of the sheeple are doing their bidding by selling and waiting for the correction...which is the reason the silver stocks are not screaming to new highs. But if it does come...how deep will it be and how long it will last...will be the question of the day. As Ted Butler has mentioned for weeks now, this silver rally is a short-covering rally. Open interest is actually declining because the bullion banks are covering their short positions...it's not caused by new speculative longs coming into the market and bidding the price up. The dynamics are totally different now. Here's the 1-year silver chart. If you want to bet against this trend...please be my guest. Now that the silver price is doing what it's doing...volatility, both up and down, is the name of the game from this point onwards. As Richard Russell says, any dips should be bought.
The CME's Daily Delivery report showed that 1 gold, along with 18 silver contracts, were posted for delivery next Wednesday. The link to the action, such as it was, is here. There was action in both GLD and SLV yesterday...as metal was withdrawn from both. GLD showed a small decline of 19,498 ounces...and a chunky 1,073,404 troy ounces of silver was taken out of SLV. Based on the recent price action, it's a pretty good bet that this silver was desperately needed elsewhere by an authorized participant, as SLV is owed many millions of ounces that just aren't available. The U.S. Mint had a smallish sales report yesterday. They sold 9,000 ounces of gold eagles...along with 1,000 one-ounce 24K gold buffaloes. They didn't report any further silver eagles sales. Over at the Comex-approved warehouses on Tuesday, they reported receiving a smallish 34,822 ounces of silver...but shipped 516,206 ounces out the door...for a net decline of 481,384 troy ounces. The link to the action is here. My bullion dealer had another monster day at his store yesterday...and it was certainly one of his biggest sales days of 2011. He has almost more business than he can handle. Because silver bullion deliveries are now many months in the futures, customers are limited to 10 oz. of silver bullion per customer in over-the-counter sales. If they wish to purchase more, it's a 3-month minimum wait for most items. Physical supplies are tight...and getting tighter. This time it's different...but will it make a difference this time? We'll find out soon enough. Both GLD and SLV had withdrawals yesterday. The Great Gold Tsunami Lies Ahead: Richard Russell. Why Rob McEwen is STILL bullish on gold. ¤ Critical ReadsSubscribeDow Jones Industrial Average ends week at highest level in nearly three yearsThe Dow Jones Industrial Average ended the week at the highest level since before the financial crisis, as a string of America's biggest companies smashed Wall Street's profit expectations. One hesitates to rain on this parade, but the oceans of money from Q.E.2 had to go somewhere...and the Fed has made no secret of the fact that it wanted to see the U.S. equity markets go higher...and the Wall Street investment houses came through in spades. This story was posted over at The Telegraph late yesterday evening...and I thank reader Roy Stephens for sending it along...and the link is here.  Geithner Downgrades His Credibility to Junk: Jonathan WeilThis op-ed piece by Bloomberg News colonist Jonathan Weil doesn't pull too many punches as he trashes little Timmy Geithner. Speaking to Fox News, Geithner said that there was no chance that U.S. debt would ever be downgraded by S&P...or any other U.S. credit rating agency. That got Weil's hackles up...and he had this to say... "It would be one thing to express the view that a downgrade would be unwarranted, or that the chance of it happening is remote. Either of these positions would be defensible. Geithner went beyond that and staked out an absolutist stance that reeks of raw arrogance: There is no risk a rating cut will occur. He left no room for a trace of a possibility, ever." I thank Washington state reader S.A. for sending me this story...and the link is here.  Ben Bernanke's life gets tougher as America is sent to the debt doghouseOn Monday, the US experienced the economic equivalent of being told to join Alcoholics Anonymous. The ratings agency Standard & Poor's informed Washington that it must get its fiscal house in order within two years or lose its status as a top borrower. It was a public consigning to a debt doghouse that countries, including Britain, Greece and Portugal, were all sent to over the last couple of years and are all now trying to escape. This is another story from The Telegraph that is also from Roy Stephens...and the link is here.  Fleeing the Dollar Flood: The world tries to protect itself from U.S. monetary policyHere's a story out of yesterday's edition of The Wall Street Journal that's courtesy of Washington state reader Roy Stephens. Members of the International Monetary Fund emerged from their huddle in Washington last weekend resolved to keep every option open to slow the flood of dollars pouring into their countries, including capital controls. That's a dangerous game, given the need for investment to drive economic development. But it's also increasingly typical of the world's reaction to America's mismanagement of the dollar and its eroding financial leadership. The link to this worthwhile story is here.  Putin: U.S. Monetary Policy Is 'Hooliganism'"Look at their trade balance, their debt, and budget. They turn on the printing press and flood the entire dollar zone — in other words, the whole world — with government bonds. There is no way we will act this way anytime soon. We don't have the luxury of such hooliganism," Russian Prime Minister Vladimir Putin said. This short story is one that I borrowed from yesterday's King Report...and it's a must read...and the link is here.  China Inflation And Wage Protests Spread, Turn ViolentHere's a piece from zerohedge.com that was sent to me by reader 'David in California' yesterday. A two-day strike over rising fuel prices turned violent in Shanghai on Thursday as thousands of truck drivers clashed with police, drivers said, in the latest example of simmering discontent over inflation. About 2,000 truck drivers battled baton-wielding police at an intersection near Waigaoqiao port, Shanghai's biggest, two drivers who were at the protest told Reuters. This is well worth reading...and the link is here.  Interview With James TurkIn yesterday's column I posted a King World News blog featuring James Turk. Eric sent me the entire audio interview last night...and it's worth listening to. The link is here.  Why Rob McEwen is STILL bullish on goldHere's a Broadcast News Network story from Toronto yesterday that was sent to me by reader George Findlay. The story itself is only semi-interesting...but the interview with Rob McEwen is a must watch/listen. Just click on the stack of gold bars once you've brought the story up on your screen. The link to the BNN piece is here.  |
| Gold and Silver: Supreme Safe Haven Assets Posted: 21 Apr 2011 06:08 PM PDT
|
| So Whats Different About $1500 Gold...? Posted: 21 Apr 2011 05:56 PM PDT |
| Silver: Eligible Versus Registered and About That Big Inventory Change at Scotia Mocatta Posted: 21 Apr 2011 05:36 PM PDT Jesse's Café |
| Penn West: A Low Risk Way of Protecting Your Portfolio Against High Oil Prices Posted: 21 Apr 2011 05:20 PM PDT Devon Shire submits: I just read an article that recaps the Canadian military having peak oil concerns. And I think someone needs to get these folks at the various think tanks a television so they can watch CNBC. Because every time one of those think tanks comes back after doing a few months of hard research they are warning us that the world is facing a potential oil supply crisis, while every day on CNBC I hear that the high price of oil is being driven by speculators and a weak US dollar. Shouldn't they just save themselves the effort and let the experts on television write their reports for them. Now who am I to believe? The think tanks that do exhaustive research or the television talking heads who are willing to opine on any subject imaginable so long as someone asks them a question and points a camera at them? We Complete Story » |
| Silver – The Early Stages of Re-monetisation? Posted: 21 Apr 2011 05:10 PM PDT The title of today's DR is taken from an essay we wrote in our Sound Money. Sound Investments publication on 30 June last year. It's a follow up to the 'Brief history of de-monetisation' essay, which appeared in last week's Daily Reckoning With silver seemingly headed towards US$50 an ounce, it's a timely look back on the forces that have propelled it higher from around the US$19 mark at the time of writing. Before we get into it though, just a quick follow up on some feedback we received after last week's carbon tax chat. Being a scientific dunce (we doubled up on history at high school, at the expense of science) it's not surprising that a few people pulled us up on a, well, schoolboy error. Carbon is not the problem and not a pollutant. It is everywhere. By mass it is the fourth most prevalent element in the universe. Apparently, the human body is 18 per cent carbon (by mass). There you go. So having a 'tax on carbon' sounds pretty dumb and we apologise for using the term. Cloaked in ignorance, we were interested to read about the 'carbon cycle'. Mother Nature has given us the tools to manage the problem. Doing so would create new industries and jobs. All the government has to do is provide tax breaks to encourage it. But instead we get a mis-named carbon tax. Anyway, it's a bit of food for thought over this Easter long weekend. We'll be back on Monday with an ANZAC Day special, so see you then. Now, onto silver… (Please remember, this is an excerpt from an issue of Sound Money. Sound Investmentsfrom June 2010. Some of the figures, like the gold/silver ratio – currently around 34:1 – are out of date. But the argument is still sound. So I decided to reprint the article as a snapshot of how it appeared at the time.) Last week we showed you how silver had become systematically de-monetised by governments over the past 150 years or so. These actions have seen the gold/silver ratio move from its long term historical average of around 15:1 to 66:1 today. In other words, one ounce of gold is now equivalent to 66 ounces of silver. In this week's essay, we'll show you why silver could potentially be one of the cheapest assets in the world right now. The silver market is not at all analysed by mainstream investors and for this reason remains very much overlooked as an investment opportunity. As proponents of sound money, we believe precious metals, most notably gold, will have an increasing role to play as the current unsustainable system evolves to a more stable footing. If gold's role as money becomes increasingly recognised then silver will also come into the picture as a monetary metal. In last week's essay we quoted Milton Friedman as saying 'the major monetary metal in history is silver, not gold'. This fact hasn't been forgotten. As you will see, investment demand for silver is beginning to grow very strongly and conditions are primed for this growth to continue. If this occurs, silver will effectively be 're-monetised'. As such we expect to see the gold/silver ratio to move heavily back in silver's favour in the years ahead. Silver Supply and Demand To understand why this may be the case you first need to consider the fundamentals of the silver market. That is, the supply and demand factors. Let's look at supply first. In 2009, 80%, of the world's supply of silver, or 709.6 million ounces, came from mine production. Peru was the largest producer of silver with 123.9m ounces, followed by Mexico (104.7m) China (89.1m) and Australia (52.6m). (Nearly all of Australia's silver production comes from BHP's Cannington Mine in North West Queensland. Cannington is one of the world's largest silver/lead mines. Pure silver mines are rare in Australia – most of the output is as a by-product of gold or base metal production.) Supplies of scrap silver accounted for 19% of global supply in 2009, or 165.7 million ounces, while government sales represented just 1%. Notably, supplies from both of these sources fell heavily in 2009 compared to 2008. Silver demand is a more interesting and complex story. The chart below, taken from the Silver Institute, shows the various sources of demand for silver. By far the largest source of demand is 'Industrial Applications'. A funny thing happened to silver soon after its demonetisation process got underway; new technologies resulted in a massive increase in its usefulness for industry. As a conductor of heat and electricity, silver's qualities are unrivalled. Because it doesn't corrode or overheat (and therefore cause fires) it is used for switches, contacts and fuses in nearly all electrical appliances, from households to industry. In addition, silver is used in computers, mobile phones and cars. Silver also has anti-bacterial qualities. Thousands of years ago, water and wine were transported in silver vessels to ward off contamination. Now, the medical industry uses silver in a range of applications to speed healing and avoid infections. Silver has many other industrial uses, including advanced technology, however we think you get the gist. Silver plays a critically important role in the modern economy. As you can see from the chart, industrial applications account for a large portion of silver demand. In 2009, it represented 48% of total demand, or 352.2 million ounces. This represented a sharp fall from 2008 as the global recession took its toll. But as you can see, this didn't really impact overall demand. We'll look at the reason for that in a moment. Other major areas of demand include jewellery, which is fairly constant (22% of 2009 total demand) and photography (11%). Silver nitrate was first used in the photographic industry in the 1800s and it became a major user of the metal throughout the 1900s. However, with the advent of digital photography demand from this field has waned over the past decade. Silverware demand (as in, plates, cutlery etc) has been fairly steady over the past few years while demand for coins (representing 11% of 2009 total demand) has increased strongly. In 2006 coin demand soaked up 39.8m ounces of supply. In 2009 coins accounted for 78.7m ounces – a near doubling in 3 years. Which brings us to one of the increasingly important aspects silver demand, investment demand. (Note that investment demand and coin demand are counted separately). Here's where things get interesting. Investment demand – It's 'implied' The Silver Institute (www.silverinstitute.org) tracks global silver supply and demand and you can find this data (going back to 2000) on their website. GFMS compiles the data. As you have seen, mine production and scrap sales dominate the supply side, while 'fabrication' (which includes the uses discussed above) dominates the demand side of the equation. But these two sources do not equal out. GFMS have therefore created a category, 'implied' investment, to balance out global supply and demand. From 2008 to 2009 this implied investment demand increased by a whopping 184%, from 48.2m ounces to 136.9m ounces. The creation of silver ETFs in 2006 is considered the primary reason behind the increase in silver investment demand. But even a cursory glance at the numbers compiled by GFMS leads you to think that these numbers may be understated, perhaps significantly. Why? Well, the GMFS 2010 World Silver Survey shows that the total holdings of the world's three largest silver ETFs were 385.8m ounces in April 2010. The first ETF, the US based ishares Silver Trust, trading under the symbol of SLV, started in 2006 while the other two kicked off about a year later. So we can safely say these ETFs have created new silver demand of nearly 400m ounces since 2006. But if we look at the implied investment figures from 2006 (inclusive) investment demand totals only 271.1m ounces. That leaves a 100m plus ounce discrepancy and we haven't even factored in sources of investment demand outside of the three big ETFs. What's Bear Stearns got to do with it? Now you might not think that this discrepancy is a big deal until you consider another piece of information. Do you remember how Bear Stearns collapsed in 2008 and the Federal Reserve helped finance its takeover by JP Morgan? It turns out that Bear Stearns held a massive short position in silver futures at the time. Being 'short' a commodity or stock means you are betting on a fall in price. When prices rise, you lose. When they fall, you win. As you can see from the accompanying chart, the silver price was rising strongly at the same time as Bear Stearns was going down the gurgler (Feb/March 2008). Perhaps Bear was covering its shorts in an effort to stem losses? (Short covering can produce very strong price increases). But JP Morgan soon took over Bear Stearns and assumed Bear's short silver position. This did not become apparent until months later when newly released data showed that JP Morgan held the largest silver short position in the market. At the time prominent silver market analyst Ted Butler pointed out that one or two US banks (JP Morgan being one) were short a massive 169m ounces of silver. This constituted an unprecedented concentrated short position. It will come as no surprise then to see that the silver price collapsed as soon as JP Morgan took over the short position. Is it possible that some investment banks are making up the difference between actual investment demand and available supply by taking short positions on the futures market? We think it is, especially if the silver ETFs don't actually have all the physical metal they say they do and are instead gaining exposure via the futures market. The physical and futures precious metals markets (gold and silver) are a byzantine world and one we don't pretend to understand in full. But examining simple supply and demand data, it is hard to ignore that the recent increase in physical demand for silver, if sustained, could be very bullish for the price over the next few years. Along with the big jump in demand for silver coins, the increase in investment demand suggests that silver is in the formative stages of being re-monetised. A global population suspicious of what governments will do to the value of their money in coming years is the driving force behind this remonetisation. As we pointed out last week, silver's role as money declined in the 19th century not because people decided voluntarily against using it, but because government's around the world virtually took it out of circulation. If this trend towards silver as money continues, and we think it will, the gold/silver ratio should improve in favour of silver. However it is a tad optimistic to think the ratio will get back to its historical norm of 15:1. There is one other bullish aspect to the silver story – its price. If silver really was just an industrial metal and not in the process of re-monetisation, would it be trading close to its all time highs? No other industrial metal is. As you can see from the chart, silver's recent high occurred in early 2008 (as Bear Stearns was crumbling). From there it fell heavily. It is difficult to put this circa 50% fall entirely down to the global deleveraging cycle because the majority of it occurred a few months before the panic of 2008 set in. Something else was driving the price down… After bottoming at around US$9 in late 2008, the silver price has rebounded strongly and is now trading just below US$19. If silver can sustain a break through the US$19 area, we reckon it will go on and record new highs in a matter of month. Greg Canavan |
| Silver ETF Rally Continues, But for How Long? Posted: 21 Apr 2011 05:05 PM PDT Vikash-Jain submits: iShares Silver Trust (SLV) Yes - we missed the silver bullion boat (though we do hold some silver mining stocks). Now we watch from afar as the band keeps playing and everyone keeps dancing. Our only comfort? We won't be there when the boat sinks. In two years, the price of silver has nearly quadrupled, to about US$44 from about $12. Even after adjusting for a weaker US$, the increase is a stunning 320%. Is it demand? Perhaps those silver-coated nano-tubes are not so nano? Or is it supply? Have we hit peak silver already? As far as we can tell, it Complete Story » |
| 24 Signs Of Economic Decline In America Posted: 21 Apr 2011 04:53 PM PDT 
The following are 24 more signs of economic decline in America. Hopefully you will not get too depressed as you read them.... #1 On Monday, Standard & Poor's altered its outlook on U.S. government debt from "stable" to "negative" and warned the U.S. that it could soon lose its AAA rating. This is yet another sign that the rest of the world is losing faith in the U.S. dollar and in U.S. Treasuries. #2 China has announced that they are going to be reducing their holdings of U.S. dollars. In fact, there are persistent rumors that this has already been happening. #3 Hedge fund manager Dennis Gartman says that "panic dollar selling is setting in" and that the U.S. dollar could be in for a huge decline. #4 The biggest bond fund in the world, PIMCO, is now shorting U.S. government bonds. #5 This cruel economy is causing "ghost towns" to appear all across the United States. There are quite a few counties across the nation that now have home vacancy rates of over 50%. #6 There are now about 7.25 million less jobs in America than when the recession began back in 2007. #7 The average American family is having a really tough time right now. Only 45.4% of Americans had a job during 2010. The last time the employment level was that low was back in 1983. #8 Only 66.8% of American men had a job last year. That was the lowest level that has ever been recorded in all of U.S. history. #9 According to a new report from the AFL-CIO, the average CEO made 343 times more money than the average American did last year. #10 Gas prices reached five dollars per gallon at a gas station in Washington, DC on April 19th, 2011. Could we see $6 gas soon? #11 Over the past 12 months the average price of gasoline in the United States has gone up by about 30%. #12 Due to rising fuel prices, American Airlines lost a staggering $436 million during the first quarter of 2011. #13 U.S. households are now receiving more income from the U.S. government than they are paying to the government in taxes. #14 Approximately one out of every four dollars that the U.S. government borrows goes to pay the interest on the national debt. #15 Total home mortgage debt in the United States is now about 5 times larger than it was just 20 years ago. #16 Total credit card debt in the United States is now more than 8 times larger than it was just 30 years ago. #17 Average household debt in the United States has now reached a level of 136% of average household income. In China, average household debt is only 17% of average household income. #18 The average American now spends approximately 23 percent of his or her income on food and gas. #19 In a recent survey conducted by Deloitte Consulting, 74 percent of Americans said that they planned to slow down their spending in coming months due to rising prices. #20 59 percent of all Americans now receive money from the federal government in one form or another. #21 According to the U.S. Bureau of Labor Statistics, the average length of unemployment in the U.S. is now an all-time record 39 weeks. #22 As the economy continues to collapse, frustration among young people will continue to grow and we will see more seemingly "random acts of violence". One shocking example of this happened in the Atlanta area recently. The following is how a local Atlanta newspaper described the attack....
#23 Some Americans have become so desperate for cash that they are literally popping the gold teeth right out of their mouths and selling them to pawn shops. #24 As the economy has declined, the American people have been gobbling up larger and larger amounts of antidepressants and other prescription drugs. In fact, the American people spent 60 billion dollars more on prescription drugs in 2010 than they did in 2005. |
| Silver Seems Set to Soar as Paper Folds Posted: 21 Apr 2011 04:53 PM PDT John Browne submits: As a result of active "demonetization" efforts by the IMF and its member central banks, gold and silver have experienced the type of volatility that has given conservative investors reasons not to perceive the metals as dependable cash alternatives. Instead gold and silver have become known as the asset class to hold as a hedge against inflation. However, during the 1990's, when inflation was in general much higher than it has been since the turn of the millennium, gold and silver prices drifted lower and stagnated. However, since 2000, gold and silver have risen by over 400 and 700 percent respectively. Remarkably, this has occurred over a time frame during which, by most accounts, low inflation has prevailed. How can this be explained? In 1944 when the U.S. dollar was considered 'as good as gold,' it was made the international reserve currency. This unique status is the reason that Fed Complete Story » |
| Precious Gold 101: As Reliable as Ever Posted: 21 Apr 2011 04:30 PM PDT Resource Investor |
| Silver Set to Soar as Paper Folds? Posted: 21 Apr 2011 04:30 PM PDT
|
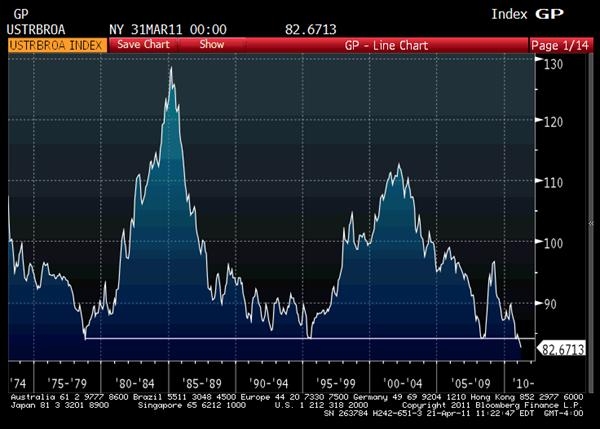
| Investors Pile Into Precious Metals; Price of Lumber Plummets Posted: 21 Apr 2011 04:27 PM PDT Pater Tenebrarum submits: The combination of continued trouble in euro area peripheral sovereign debt and a weak US dollar has resulted in continued buying interest in precious metals. Silver is on a near-parabolic run, quoted at over $46/oz. as of the time of writing. Gold has in the meantime established a foothold above $1,500. Gold as of Wednesday's close – first time above $1,500 – click for higher resolution. Silver's incredible rally continues – this was Wednesday's close – as of early afternoon on Thursday it trades another $1 higher at $46.28 – click for higher resolution. The US dollar continues to sink – but it is close to major long term support levels here – click for higher resolution. The Fed's broad trade-weighted dollar index meanwhile is at a new 40 year low – click for higher resolution. Some Warning Signs On The Horizon Jon Hilsenrath, the Fed's mouthpiece at the WSJ, Complete Story » |


 • Higher oil prices continue to raise costs for retailers relying on overland shipping.
")
")
")


| You are subscribed to email updates from Gold World News Flash 2 To stop receiving these emails, you may unsubscribe now. | Email delivery powered by Google |
| Google Inc., 20 West Kinzie, Chicago IL USA 60610 | |
No comments:
Post a Comment