


saveyourassetsfirst3 |

- 2011-03-18 Goldman Sachs: 2011 gold price $1,480 within 3 months
- 2011-04-14 GFMS 2011 gold price forecast $1,600 by end of 2011
- Gold Derivatives, Gold Lending, Official Management Of The Gold Price (Lima, 2002)
- Short-Term, High-Probability, Mean-Reversion Strategy: Outperforming
- Long Commodities and Short the Dollar
- SLV 2013. No comment, self explanatory.
- Greek 10-Year Yield Surges Over 13.2% - Euro Falls against Gold and Particularly Silver
- "Huge Speculation" Makes Asian Silver Market "Dysfunctional"
- One of the Dumbest Things I Have Ever Read About Gold
- Gold and Silvers Daily Review for April 13th, 2011
- GOT Physical?
- Timing Is Everything: Assessing the Price of Gold
- Why silver has been rising faster than gold
- How to acquire stock market insurance for FREE
- U.S. Will Resolve Debt by Returning to Gold Standard: James Grant
- Institutions way under-invested in gold, Rickards tells King World News
- Conversations with Casey: Doug Casey on Phyles
- Gold and silver market trends for 2010-GFMS
- More Indian temples to melt gold
- Indian Investors Switch to Silver From Gold
- Wall of Maturing Debt
- Global Macro Notes: Sizing Up The Bull
- What is Today's "Fair Value" Gold Price?
- The Gold Market Fix
- Why is Silver rising faster than Gold?
| 2011-03-18 Goldman Sachs: 2011 gold price $1,480 within 3 months Posted: 14 Apr 2011 12:43 PM PDT Goldman Sachs analyst David Greely predicts gold to rise to $1,480 within the next 3 months. He does not see gold peeking before 2012. |
| 2011-04-14 GFMS 2011 gold price forecast $1,600 by end of 2011 Posted: 14 Apr 2011 11:33 AM PDT GFMS, one of the leading global precious metals consultancies, released its "2011 Gold Survey". GFMS expects gold to reach $1,600 by the end of 2011. |
| Gold Derivatives, Gold Lending, Official Management Of The Gold Price (Lima, 2002) Posted: 14 Apr 2011 06:12 AM PDT
|
| Short-Term, High-Probability, Mean-Reversion Strategy: Outperforming Posted: 14 Apr 2011 03:15 AM PDT Andrew Crowder submits: I took a hiatus from my daily post yesterday so that I could evaluate the latest trades in my High-Probability, Mean-Reversion Strategy. I closed out my Silver (SLV), Russell 2000 (IWM) and S& 500 (SPY) positions during the last two trading sessions for an nice overall return. Both the SLV (+19.8%) and IWM (+21.3%) trade were profitable. However, the SPY trade did not experience the same good fortune. The strategy experienced its first loss since it was initiated back in November as SPY lost 20.2%. The High-Probability, Mean-Reversion strategy is now up 34.6% since it was initiated six months ago with a win ratio of 92.3%. So far the strategy is up 14.2% for the month April. Obviously I am pleased with the win ratio (92.3%) since I initiated the strategy, but I am a realist. I realize there is no holy grail in trading. One thing that I do Complete Story » |
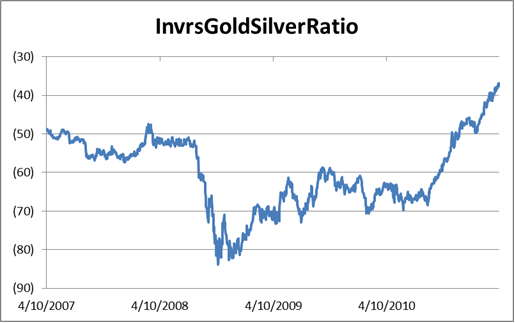
| Long Commodities and Short the Dollar Posted: 14 Apr 2011 02:59 AM PDT Joe Eqcome submits: Outlook: Long commodities and short the dollar. This is has been a "perma-trade" that keeps on giving. What would have made this even better? If your commodity of choice was silver, the poor man's gold. Poor Man's Gold: The chart below compares the amount of silver you can buy for an ounce of gold. The chart has been inverted reflecting higher levels on the chart for lower amounts of silver that can be purchased relative to the price of gold. So, while gold is at nominal high, silver is at a 31 year high. (Click charts to expand) A Twofer: The commodities "run" has been driven by two sustaining factors. The first is the rising middle class in China and India seeking greater material wealth—a combination of 2.5 billion people. The second is the declining value of the dollar in which most commodities are priced. Complete Story » |
| SLV 2013. No comment, self explanatory. Posted: 14 Apr 2011 02:03 AM PDT typetext |
| Greek 10-Year Yield Surges Over 13.2% - Euro Falls against Gold and Particularly Silver Posted: 14 Apr 2011 01:39 AM PDT |
| "Huge Speculation" Makes Asian Silver Market "Dysfunctional" Posted: 14 Apr 2011 01:15 AM PDT Bullion Vault |
| One of the Dumbest Things I Have Ever Read About Gold Posted: 14 Apr 2011 01:13 AM PDT
|
| Gold and Silvers Daily Review for April 13th, 2011 Posted: 14 Apr 2011 01:03 AM PDT |
| Posted: 14 Apr 2011 01:01 AM PDT Anyone that took my advice is a fucking champ. Enjoy your profits. Enjoy the roller coaster going into expiry tomorrow. You know how to thank me. More later, getting some interesting emails sent to me in regards to the CRIMEX. $US dollar treading a river still ready for the Mariana's trench soon. |
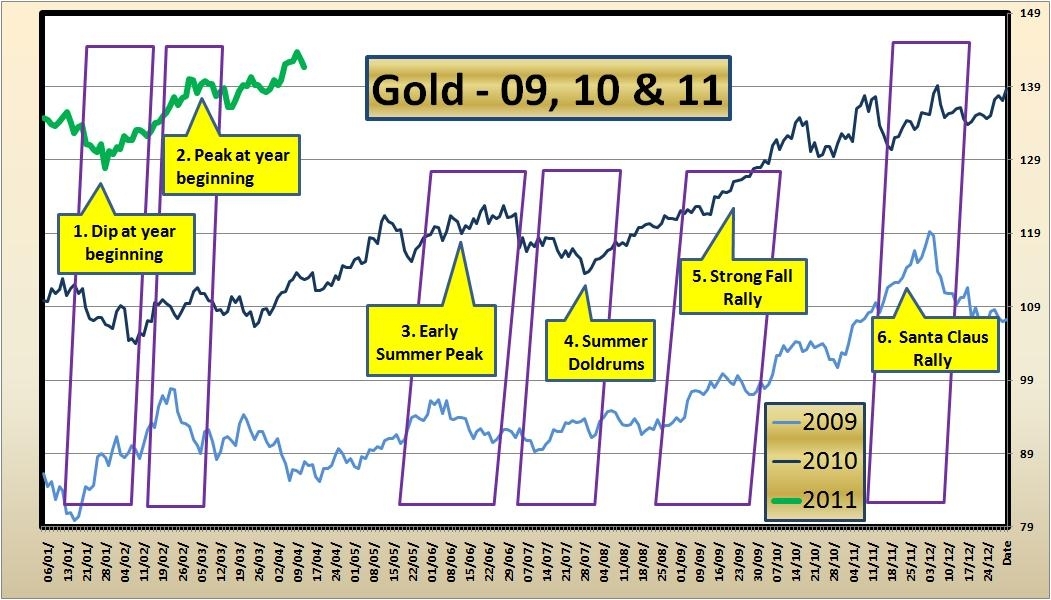
| Timing Is Everything: Assessing the Price of Gold Posted: 14 Apr 2011 12:50 AM PDT Marco G. submits: After a January dip and a February peak, and then a further dip for the turmoil around the Japanese Tsunami, investors must be wondering "what's next for the Gold price?" A review of history may give the investor some ideas, for as they say, history may not repeat itself, but there may be an echo. This is not precise and it is not technical analysis, but there does seem to be definite phases that the rising gold prices move through in the year. (Click chart to enlarge) The author did not use 2008, as the economic disruptions at that time may give unreliable data. Also the years prior to 2008 were not used as the author believes the world changes with time and the economic drivers back Complete Story » |
| Why silver has been rising faster than gold Posted: 14 Apr 2011 12:44 AM PDT From Mineweb: Silver is breaking new records at around $40, and gold is touching new highs of close to $1,460. Looking back over the past few years, we've seen gold rise from around $312 to $1,460... a rise of 4.68 times... and silver from around $6 to $40 a rise of 6.67 times. But this does not give a clear picture, so we went back over the last year and what did we see? Since early 2009, gold has moved from $900 to $1,460, a respectable 62%. Over the same period, silver has moved from $10 to nearly $40... a remarkable 400%. Why the difference in ... Read full article... More on precious metals: Four silver investments you may want to avoid Porter Stansberry: The two big reasons silver has been soaring When the long-awaited gold mania could begin |
| How to acquire stock market insurance for FREE Posted: 14 Apr 2011 12:38 AM PDT From Alex Daley in Casey's Daily Dispatch: ... If the crash of 2008 showed us anything, it's that most investors, even the so-called professionals, are woefully unprotected against the risks of a big market crash. They simply ignore the volatility of the markets and trudge forward with the idea that "in the long run, stocks only go up." For many of us, our equity portfolios are the largest single asset we have by a long shot, and yet the majority of investors sit completely exposed. Of course, you cannot go to an Allstate agent and purchase portfolio insurance. Instead, your options are limited mostly to the hedges available on the financial markets (or some more exotic choices if your means are sufficient, but that is beyond the scope of this article). If you, like many investors, keep the majority of your holdings in relatively liquid stocks on the U.S. exchanges, one of the first places to look is options. Say you are one of the investors who has been along for the ride on Netflix, and your position is up 700% in five years, with the stock trading at about $230 per share. Maybe you're willing to live with a 10% haircut, but no more. In that case, you could purchase puts to cover your holdings on the stock out to September, with a strike price of $205. The current premium on such puts is about $20, or less than 10% of the share price. That might sound like a lot to pay for insurance. But the nice thing about options is, you can always let someone else pay for your policy. Calls for Netflix at $250 with the same expiration are also trading right around $20. Sell an equal number of covered calls, and your insurance is basically free. If the stock rises, you'll still get the strike price, sharing in some of the gains (albeit now capped). And if it crashes, you'll be able to dump your shares onto someone else at the prearranged price... Read full article... More from Casey Research: Doug Casey: What to do with your money now Casey Research reveals the top takeover targets in the junior mining sector Doug Casey: The investment rules you must follow now |
| U.S. Will Resolve Debt by Returning to Gold Standard: James Grant Posted: 13 Apr 2011 08:36 PM PDT ¤ Yesterday in Gold and SilverGold didn't have a very exciting day yesterday...but it did manage to close on the positive side of the ledger, so I guess we should be thankful to JPMorgan et al for these small mercies. The high for the day was in around 9:00 a.m. Eastern time...and then got sold off a bit starting the moment that the London bullion market closed at 4:00 p.m. local time...which is 11:00 a.m. in New York. The price was briefly below Tuesday's closing price, but recovered a few dollars going into the close of electronic trading at 5:15 p.m. Eastern. Volume was pretty light.
Silver's price movements were about the same as gold's...right down to the sell-off after the London closed. From that New York low, silver recovered almost back to its high of the day, which I found very encouraging. I'm also glad to see the price put some distance between it and the $40 mark as well.
The dollar didn't do a whole lot of anything yesterday...and the scale of the graph makes the price action look more spectacular than it actually was.
The selling pressure on both gold and silver prices that began at the close of London trading at 11:00 a.m. Eastern time, is more than obvious on the graph below. And even though the gold price managed to squeeze out a small gain on the day, the gold stocks couldn't manage the same feat...with the HUI finishing down a smallish 0.45%. For the most part, the silver stocks had a much better time of it.
The CME's Daily Delivery report showed that 82 gold, along with 3 silver contracts, were posted for delivery on Friday. Both ETFs showed declines for the second day running. GLD was down a chunky 107,251 ounces...while SLV had an eye-watering withdrawal of 7,806,880 troy ounces...which I'd bet is probably the biggest one-day drop in SLV history. I would also guess that it had little to do with the big price sell-offs of Monday and Tuesday. Someone obviously needed a chunk of silver in a hurry, because the price drop over the last couple of days certainly wouldn't account for a withdrawal of this size. The U.S. Mint had a smallish sales report yesterday. They sold another 1,000 ounces of gold eagles, along with 1,500 one-ounce 24K gold buffaloes. For the third day in a row, the Comex-approved depositories did not receive a single ounce of silver and...for the third day in a row, they shipped more out the door. On Tuesday they shipped out 249,418 troy ounces of the stuff. The link to that action is here. Combine the approximately 1.5 million ounces of silver shipped from the Comex warehouses over the last two reporting day...along with the 8.8 million withdrawn from SLV since Monday...and it's obvious that over 10 million ounces of silver have disappeared to parts unknown in the last three business days. As Ted Butler pointed out, frantic activity like this is not a sign of a market in surplus, it's indicative of a market that is short of physical product to deliver. My bullion dealer had another huge day on Wednesday that was even bigger than the one he had on Monday. It's obvious that investors are buying the dips...not only in the silver shares, but in the physical metal itself. I was very encouraged by the fact that silver didn't close below $40...and every attempt to sell it down below that level ran into serious buying. Indian investors switch to silver from gold. GLD was down a chunky 107,251 ounces...while SLV had an eye-watering withdrawal of 7,806,880 troy ounces. PIIGS ahoy! ¤ Critical ReadsSubscribeU.S. Economic Optimism Plummets in MarchMy first story today, posted over at gallup.com, is one I stole from yesterday's edition of the King Report. Americans' optimism about the future direction of the U.S. economy plunged in March for the second month in a row, as the percentage of Americans saying the economy is "getting better" fell to 33% -- down from 41% in January. It is also down three points from the 36% of March 2010. Optimism in March essentially matches last year's low points: 32% in July, 33% in August, and 32% in September. However, it remains higher than it was throughout 2008 and early 2009. There's a lot of good stuff in here...including a lot of graphs...and the link is here.  Inflation Actually Near 10% Using Older MeasureToday's next story is a posting over at cnbc.com that was sent to me by reader Scott Pluschau. Inflation, using the reporting methodologies in place before 1980, hit an annual rate of 9.6 percent in February, according to the Shadow Statistics newsletter, written by John Williams. "Given ongoing inflation problems with food and the spreading impact of higher oil-related costs in the broad economy, reporting risk is to the upside of consensus expectation for March's CPI report," said Williams, citing a 10 percent jump in gasoline prices in March, in the note. This is well worth the read...and the link is here.  Banks facing $3.6 trillion 'wall of maturing debt', IMF Report saysRoy Stephens provides the next story out of yesterday's edition of The Telegraph. Debt-laden banks are the biggest threat to global financial stability and they must refinance a $3.6 trillion "wall of maturing debt" which comes due in the next two years, the International Monetary Fund said in its Global Financial Stability Report. Government debt was generally high...and on a worryingly upward path in many advanced economies, the IMF said. It repeated its warning that the United States and Japan faced particularly dangerous debt dynamics. This story is certainly worth skimming...and the link is here.  PIIGS ahoy!Reader U.D. sent this piece out yesterday...and it's a fairly longish read by columnist Martin Hutchinson...and is posted over at the prudentbear.com website. Martin states that..."Because of the delusory fiscal and monetary policies of the last few years, the protection Britain and the United States would normally receive from issuing their own currencies will shortly disappear. The two countries will then be revealed as the biggest PIIGS of all." If you have the time, this is well worth the read...and the link is here.  China inflation threat underestimatedChina is poised to become an "exporter of inflation to the rest of world", according to Legal & General Investment Management [LGIM], which warned that the threat from rising prices in the world's second-biggest economy is underestimated. This is another story from The Telegraph late last night that's also courtesy of reader Roy Stephens...and the link is here.  Beijing March New House Prices Plunge 26.7% M/MHere's a story that was sent to me by Casey Research's resident economist, Bud Conrad yesterday. It's a piece posted at imarketnews.com that was filed from Beijing on Monday. It's a very short piece...and the headline pretty much says it all. The link is here.  Assange praises Indian newspaper's use of WikiLeaks disclosuresHere's an interesting story that was posted in The Guardian yesterday...and I thank Swiss reader G.B. for sending it along. US embassy cables released by WikiLeaks have made a huge impact in India. The Hindu began running stories based on the cables on 15 March, resulting in 21 front page scoops. The government has been rocked by some of the revelations, with calls for the prime minister, Manmohan Singh, to resign. The Hindu's editor-in-chief, N. Ram, says: "The cables we have worked on so far expose the venal and sordid underbelly of India, which is corrupt, non-transparent, and vulnerable to manipulation by the big powers, in particular the United States." It's a short read...and the link is here.  Gold and silver market trends for 2010-GFMSHere's a Reuters piece that was sent to me by Washington state reader S.A...and was filed from London yesterday. Demand for gold bars grew strongly last year, helping lift overall physical investment despite weaker inflows into exchange-traded funds, metals consultancy GFMS said in its annual Gold Report on Wednesday. I added up the four biggest demand areas in this report...China, India, industrial use and investment demand...and it came to 2,455 tonnes. This represents 90% of 2010 mine output. This short report is a must read...and the link is here.  More Indian temples to melt goldFollowing the footsteps of the famous Naina Devi and Chamunda Devi shrines in the state, other major temples in Himachal Pradesh, north India are expected to come up with gold melting plans. |
| Institutions way under-invested in gold, Rickards tells King World News Posted: 13 Apr 2011 08:36 PM PDT  I stole the headline...and the preamble from a GATA release yesterday. In the KWN interview, market intelligence analyst Jim Rickards makes a couple of compelling observations: Big financial institutions hardly own any gold at all, so the metal can't be in a bubble and, China is trying to get as much gold as it can through mining, getting gold at the cost of mining rather than in the market, where the Chinese bid could double the gold price and cause a lot of problems. Still, the Chinese bid puts a floor under gold. It's a short blog...and a must read...and the link is here. |
| Conversations with Casey: Doug Casey on Phyles Posted: 13 Apr 2011 08:36 PM PDT  My last posting of the day is not about gold...but is a must read nonetheless. It's yesterday's edition of Conversations with Casey. I haven't read the whole thing yet, but I can tell you that it's Doug at his finest. Doug, as always, is interviewed by Louis James, the Editor of Casey Research's International Speculator. This week's topic of discussion is phyles. Louis asks Doug..."What is a phyle, and why does it matter?" It's a longish read...but well worth your time...and the link is here. |
| Gold and silver market trends for 2010-GFMS Posted: 13 Apr 2011 08:36 PM PDT  Here's a Reuters piece that was sent to me by Washington state reader S.A...and was filed from London yesterday. Demand for gold bars grew strongly last year, helping lift overall physical investment despite weaker inflows into exchange-traded funds, metals consultancy GFMS said in its annual Gold Report on Wednesday. I added up the four biggest demand areas in this report...China, India, industrial use and investment demand...and it came to 2,455 tonnes. This represents 90% of 2010 mine output. This short report is a must read...and the link is here. |
| More Indian temples to melt gold Posted: 13 Apr 2011 08:36 PM PDT  Following the footsteps of the famous Naina Devi and Chamunda Devi shrines in the state, other major temples in Himachal Pradesh, north India are expected to come up with gold melting plans. |
| Indian Investors Switch to Silver From Gold Posted: 13 Apr 2011 08:36 PM PDT  Thanks to Alberta reader B.E.O...here's a story filed from New Delhi that showed up in yesterday's edition of The Wall Street Journal. He found it posted over at sprott.com in the wee hours of this morning. The headline pretty much says it all...and I think that it might be worth your time running through it. This is something Ted Butler has been advocating for years...and he's been right about that in spades...and I'm glad I took his advice. The link is here. |
| Posted: 13 Apr 2011 07:56 PM PDT
Mercenary Links Roundup for Wednesday, April 13th (below the jump).
04-13 Wednesday
|
| Global Macro Notes: Sizing Up The Bull Posted: 13 Apr 2011 07:43 PM PDT
Some will argue any oil decline is a "buy the dip" opportunity before flare-up rages further. This may be true, but it is not a lock by any means. As the speculative vanguard, small caps are a tell that this decline is about more than just oil. It may be a weakening of risk appetite and a shift towards broad stock market correction. That would be fitting given two potentially "priced in" factors — April being the best month of the year for stocks, and corporate profits hitting new records as cost cuts and rising sales combine. The trouble is that investors may have anticipated both. This has become enough of a gamed market for the "April effect" to have been pulled forward, and equity levels are certainly rich enough to reflect record earnings. Put this together and what you get is a classic "buy the rumor, sell the news" type environment. This is why we remain open to long-side setups — in case oil or gold go nuts for example — but maintain an instinctive bias to the short side. The bulls have had the run of the place since September 2010. More than 7 months on, the end of the [QE2] psychology boost and priced-in corporate profits pop are coinciding. After Alcoa's miserable kick-off to earnings season, we have seen further evidence of a "sell the news" mentality in J.P. Morgan's tepid reaction to strong results.
The old trading wisdom says that "the less observed, the better the trade." As Bruce Kovner pointed out in Market Wizards, market moves born of speculator activity have lower odds of being the real deal. This makes for an exceedingly strange environment, as the psychological power of QE2 and the "Bernanke Put" (successor to the Greenspan Put) have made for one of the most gamed markets ever One can see the degree of gaming via the below eye-opening CRB correlation chart, which has made the rounds from Bloomberg to Minyanville to The Big Picture:
On top of Fed accommodations and improving economic conditions, Mr. Market seemed to don an invincibility cloak after shrugging off the Japan earthquake and Fukushima. As George Soros has observed, positive feedback loops in markets tend to undergo a series of tests. When a hard test is successfully passed, crowd conviction reinforces itself yet further. So here is a very rough summation of driving factors thus far:
 In addition to the above, a "wall of worry" was created by the many hesitators and doubters, allowing markets to climb and climb. Then, as noted, the Japan disaster acted as a sort of horrific strength test.
The ability of markets to (mostly) brush off Fukushima like a blip may help explain the rather insane move in emerging markets some weeks back. So many emerging market vehicles went vertical in that rush, India is as good an example as any. We caught India long (via INP) on the late March wedge breakout, and remain partially long (after booking profits) as of this writing. But the near vertical nature of INP's move (and many others) felt surprisingly unnatural from the start. The sudden fevered frenzy for E.M. assets, in other words, seemed not so much a logical reassessment of the global economic outlook, but instead a sort of thoughtless violent spasm comprised of short covering, a damn-the-torpedoes attitude to inflationary pressures and policy risks, and a table-pounding sense of "get me in no matter what." The below chart of MSCI Brazil (EWZ), an ag-themed favorite, shows what that kind of "fools rush in" mentality all too often leads to.
At the very least, widespread bullishness on food, energy and emerging markets all at the same time seems a massive contradiction in terms. The "ambrosia of cheap capital" (to use a Fed president's term) that helps push grains and oil to new heights also makes life hell for various E.M. central bankers, who one by one give in to necessary tightening measures at risk of economic slowdown. Meanwhile, the dollar's managed decline — there is too much collateral damage risk to let it crash — reduces America's appetite for imports, puts pressure on export-based E.M. economic models as local currencies rise, and places greater pressure on the bottom 70% of U.S. consumers (still being ignored). Explanations for investor optimism thus provide an overview of "how we got here." But they doen't explain how we are going to get much farther, because all these pro-bullish phenomena have built-in self destruct mechanisms:
To imagine the bull train rolling merrily along, then, one has to have comfortable answers to the following questions: What happens when QE2 comes to an end? What happens to the price of oil in the event of QE3 — and how much more speculation can we handle? Oil $120? Oil $150? At what point does inflation kill profits, if more "non-core" inflation is what we get? How long can America's "have nots" (the bottom 70% pincered by stagflationary forces) be ignored? Can China really be expected to pull off a soft landing? If they fail, how deflationary is that? What about Spain — Europe's true test — where massive real estate losses are yet to be acknowledged? Whither investor expectations? And where do corporate profit margins go from here? JS |
| What is Today's "Fair Value" Gold Price? Posted: 13 Apr 2011 07:19 PM PDT A risk-adjusted look at the Gold Price… |
| Posted: 13 Apr 2011 07:15 PM PDT
|
| Why is Silver rising faster than Gold? Posted: 13 Apr 2011 06:54 PM PDT Gold Forecaster |


 On Monday April 11th, the following commentary was posted in the


| You are subscribed to email updates from Gold World News Flash 2 To stop receiving these emails, you may unsubscribe now. | Email delivery powered by Google |
| Google Inc., 20 West Kinzie, Chicago IL USA 60610 | |
No comments:
Post a Comment