


saveyourassetsfirst3 |

- Gold Investing Hits the Horoscopes
- Raid in silver and gold fail/Monday is Day of Judgment for position Limits
- Utah Considers Making Gold And Silver Legal Tender
- No Breakout in Gold So Far, Strong Resistance Seen in Silver
- Rick Rule: Silver Linings
- J.P. Morgan, HSBC May Have Gained Billions from Influencing Silver Prices
- Two Gold stories/videos from China
- Look who's calling Utah and gold 'eccentric'
- Housing Is Ruined For Years
- The Gold Mining Business Model’s the Best There Is for Any Industry
- What’s really driving the Gold Price?
- “Gold & Silver Mkts: Price & Volume Update” – Morris Hubbartt
- This past week in gold
- Why Gold and Gold Shares have Consolidated for Five Months
- Bailouts, Bombs, Bullets and Bahrain Should Support Gold and Silver
- Gold and Silvers Daily Review for March 25th, 2011
- Gold Bubble : Written in the Stars
- Where PE Ratios are Pointing
- Will Financial Problems In Portugal Cause The European Debt Crisis To Spiral Out Of Control?
- Friday ETF Roundup: EWJ Slumps on Continued Japan Fears, UNG Surges on Weather
- Salivating at the Upside Potential of the Gold Market
- Gold Miner ETFs: Breaking Down the Options for Investors
| Gold Investing Hits the Horoscopes Posted: 26 Mar 2011 04:09 AM PDT Oh no...Gold Investing is being tipped in tabloid horoscopes. Sell...! |
| Raid in silver and gold fail/Monday is Day of Judgment for position Limits Posted: 26 Mar 2011 02:31 AM PDT This posting includes an audio/video/photo media file: Download Now |
| Utah Considers Making Gold And Silver Legal Tender Posted: 26 Mar 2011 02:15 AM PDT from The Consumerist By Phil Villarreal on March 25, 2011 1:30 PM Utah's state house took a step toward allowing gold and silver to be accepted as cash, passing a bill that would recognize government-issued gold and silver coins for not only their face value, but the value given to the items by collectors. If the bill passes, the state would study the idea of establishing an alternative form of currency backed by silver and gold. The Salt Lake Tribune reports the bill wouldn't require people to accept gold and silver coins as money, and it would also exempt the sale of the coins from state sales tax as well as capital gains taxes. A lawmaker who supported the bill did so out of fear that the dollar will collapse: The rest here: http://consumerist.com/2011/03/utah-...al-tender.html |
| No Breakout in Gold So Far, Strong Resistance Seen in Silver Posted: 26 Mar 2011 02:00 AM PDT
|
| Posted: 26 Mar 2011 12:45 AM PDT |
| J.P. Morgan, HSBC May Have Gained Billions from Influencing Silver Prices Posted: 25 Mar 2011 11:11 PM PDT ¤ Yesterday in Gold and SilverAfter Thursday's late afternoon price adjustment by one of the usual not-for-profit sellers, the gold price remained in a quiet and very tight trading range up until 12:15 p.m. in New York. Then out of the blue...and for no reason I could see...someone decided to pull their bids and mark gold down about $13 in the space of half an hour. A bid appeared at 12:45 p.m...and gold recovered to close sixty cents below its Thursday close.
Silver spent most of Friday up between thirty and fifty cents...but at 12:15 p.m. Eastern...the silver price got hit for more than sixty cents before recovering a lot of that going into the close of electronic trading at 5:15 p.m. in New York.
You could be forgiven if you thought the timing of this price drop yesterday was more than coincidental, as it bore a remarkable resemblance to what happened to the price at the exact same time on Thursday in both metals. I can tell you that it pinned the needle on my b.s. meter. The dollar's low came minutes before 8:00 a.m. in London...and was up about forty basis points by the time gold and silver were pushed off their respective 12:15 p.m. cliffs...so most of the dollar's serious rally in price was already in for the day before the rug got pulled out from under the precious metals. Here's the chart...and you can be judge and jury on this one.
The gold stocks followed the gold price pretty much tick-for-tick...although the shares got sold off a bit at the end of the day...with the HUI down 0.88%. The silver stocks closed mixed. Here's the 5-day HUI for the week that was.
The CME's Friday Delivery report showed that only one gold, along with 34 silver contracts, were posted for delivery on Tuesday. JPMorgan and Barclays were the issuers and stoppers of note. There were no changes reported in either GLD or SLV...and the U.S. Mint reported selling another 1,000 ounces of gold eagles...and nothing else. The Comex-approved depositories showed a smallish increase of 47,993 ounces of silver on Thursday...and equally smallish 63,548 ounces were shipped out. The Commitment of Traders report [for positions held at the close of trading on Tuesday, March 22nd] wasn't quite what I was hoping to see...but Ted Butler said that it was still pretty impressive considering the big price gains we saw in both gold and silver during the reporting week. There was a 1,761 contract increase in the open interest in the Commercial net short position in silver but, as Ted Butler pointed out, the total open interest in silver for the $3.50 up move during the reporting week only showed an increase of 1,074 contracts...and that isn't a lot. Gold was up about forty dollars during the week, but the Commercial net short position only increased 4,645 contracts...and the total open interest in gold only rose a tiny 1,371 contracts. Ted was very happy about this. On sober second thought...he's right, of course...and he also pointed out that the COT structure is far more favourable at this juncture than when we were at the previous highs in both gold and silver earlier this month. Nothing much has changed [from the previous week] with Ted's "Days to Cover Short Positions" since last week, but here's the chart anyway.
As a matter of interest...Monday, March 28th is the last day that you can submit a comment to the CFTC regarding position limits in silver. Here's what Ted had to say about this in his comments to his paying subscribers earlier this week... "The core issue is that there exists an unusual concentration on the short side of COMEX silver futures held by JPMorgan. Manipulation can only exist if a concentrated position exists. Everything else is a peripheral matter. It does not matter if the concentrated silver short position held by JPMorgan is naked or is hedged with physical or OTC offsets. It does not matter if JPMorgan inherited the concentrated short position from Bear Stearns at the request of the US Government. It does not matter if JPMorgan operates an exchange -- licensed or not. What does matter is the concentrated nature of its COMEX silver short position [in the futures market]." "What also matters is that the only known antidote to concentration isthe enactment of legitimate speculative position limits, something now lacking in COMEX silver futures. That's why the current position limit process underway by the CFTC, including the solicitation of publiccomments on the matter, is so important. Fortunately, there has been an outpouring of public response on this issue with well over 3,000 comments being made by fellow citizens and investors asking that the Commission institute a 1,500 contract position limit in silver. I am hopeful that the large number of comments on silver will finally result, at a bare minimum, in an open discussion by the CFTC onthe merits of a 1,500 contract level in silver. For more than 20 years, any thought of an open debate has been buried." "Of the more than 3,900 public comments on position limits, more than 99% urge the Commission to institute hard position limits on all physical commodities. It will be hard for the Commission to misinterpret the public's collective opinion that they want hard position limits. With a deadline of March 28 for public comments, if you have not yet submitted your comments, please do so." And if you're not sure exactly what to say, or how to say it, you can check out what others have written...cut-and-paste that...then embellish it with your own comments...and please be polite. The link to the public comments page is here. This will take about ten minutes out of your life...and it's a small price to pay to be heard on this issue...and you've got the rest of the weekend to do it. Before running the long list of stories, videos and interviews...here's a chart that was sent to my by Nick Laird over at sharelynx.com. It's the "Total PMs Pool" graph that shows the total physical ounces of precious metals in all know repositories...and their value in U.S. fiat.
It's a good bet that JPMorgan and HSBC are not happy campers about the negative press they're getting these days...and that Forbes piece was just another brick in the wall. Look who's calling Utah and gold 'eccentric'. Interview With John Hathaway. Two Gold stories/videos from China. Glenn Beck: The Creature From Jekyll Island ¤ Critical ReadsSubscribeUS Finances Rank Near Worst in the World: StudyMy first four stories today are all courtesy of reader Scott Pluschau. In the Sovereign Fiscal Responsibility Index, the Comeback America Initiative ranked 34 countries according to their ability to meet their financial challenges, and the US finished 28th, said David Walker, head of the organization and former US comptroller general. The link to the story, which is posted over at cnbc.com, is here.  CBO: Taxing mileage a 'practical option' for revenue enhancementScott's second offering is right out of the "You-can't-make-this-stuff-up" file. The CBO report discussed the proposal in great detail, including the development of technology that would allow total vehicle miles traveled (VMT) to be tracked, reported and taxed, as well as the pros and cons of mandating the installation of this technology in all vehicles. The taxes gathered could be used to offset the costs of highway maintenance at a time when federal funds are short. The story is posted over at thehill.com website...and the link is here.  Massachusetts job fair canceled because of lack of jobsHere's an AP story that Scott sent that was posted over at boston.com yesterday...and the headline pretty much sums it up. Richard Shafer, chairman of the Taunton Employment Task Force, says 20 to 25 employers were needed for the fair scheduled for April 6, but just 10 tables had been reserved. One table was reserved by a nonprofit that offers human services to job seekers, and three by temporary employment agencies. It's a very short piece...and the link is here.  G.E.'s Strategies Let It Avoid Taxes AltogetherScott's last offering is this story out of the Thursday edition of The New York Times. G.E. reported worldwide profits of $14.2 billion, and said $5.1 billion of the total came from its operations in the United States. Its American tax bill? None. In fact, G.E. claimed a tax benefit of $3.2 billion. Amazing...isn't it? The link is here.  Glenn Beck: The Creature From Jekyll IslandYesterday I mentioned the fact that G. Edward Griffin, the author of the book "The Creature From Jekyll Island: A Second Look at the Federal Reserve" was going to be on Glenn Beck's TV program yesterday. He was...and here's the first part of the Fox News clip of that interview...and I'm hoping the rest of it will be posted sometime today...as only the first twelve minutes were available as of 7:00 a.m. Eastern time this morning. I thank reader Clayton McBride for sharing it with us. It runs about eleven minutes...and the part that is posted is well worth watching. The link is here.  Lack of data from Japan distresses nuclear expertsHere's a story out of yesterday's edition of the L.A. Times that was sent to me by reader Mike Priwer. How did Japanese workers at the crippled Fukushima nuclear plant jury-rig fire hoses to cool damaged reactors? Is contaminated water from waste pools overflowing into the Pacific Ocean? Exactly who is the national incident commander? This story is well worth your time...and the link is here.  Syria unleashes force on protesters demanding freedom as unrest spreadsThis next item is a Roy Stephens offering that was posted in this morning's edition of The Guardian in London. Reports of many killed as marchers take to streets, plus confrontations in Jordan, Yemen and Bahrain. This is worth reading...and the link is here.  |
| Two Gold stories/videos from China Posted: 25 Mar 2011 11:11 PM PDT  Nick Laird sent me a couple of stories [both with short videos imbedded] that were posted over at the Chinese website english.cntv.cn on Thursday and Friday. The first one is headlined "Gold Market in China Booming"...and the second is headlined "Gold Favored by Hong Kong Buyers". |
| Look who's calling Utah and gold 'eccentric' Posted: 25 Mar 2011 11:11 PM PDT  Here's a GATA release of a gold-related story in the Friday edition of the Financial Times. The FT headline reads "In Gold They Trust"...and they poke fun at Utah's move to make gold and silver legal tender. Chris Powell, GATA's secretary treasurer, tees them up and drives them down the fairway in his preamble. This is a must read from one end to the other...and the link is here. |
| Posted: 25 Mar 2011 10:31 PM PDT "Federal Reserve Recovery Is Flawed as Companies Get Credit Denied to Consumers." "Thirteen hundred miles from Wall Street, Alex Fairchild is still waiting for a little of the U.S. government's multi-trillion-dollar bailouts and Federal Reserve largesse to trickle his way. His above-average credit score and $20,000 down payment for a $195,000 condo overlooking Miami's Biscayne Bay didn't spare the software engineer from a mortgage application process that took so long a government tax credit he was counting on expired. After seven months under contract and appraisals from three underwriters, his developer went bankrupt and New York-based Vanguard Funding declined a loan. 'The banks are just extra jittery,' said Fairchild, 40, who has been renting the unit and is starting the process anew. Lenders have gone from "too lax" before the credit crisis to "entirely too strict. There are people like me that could be helping to get this inventory moved." "The consumer loan market, particularly housing, remains a challenge for borrowers. Total U.S. consumer credit outstanding was $2.4 trillion in January, or -6.6% below its July, 2008 level, the Fed said in a March 7 report. Total housing debt has declined by $536 billion since 2008 to $10.1 trillion, Fed data show. The median price of an existing U.S. home has dropped -13 percent since June to $158,800, bringing its decline since July, 2006 to -31 percent, according to the Chicago-based National Association of Realtors. About 10.8 million homes were worth less than the debt owed on them in the third quarter, research firm CoreLogic Inc. said in a December 13 report." "By contrast, the least creditworthy corporations have been able to borrow record amounts at the cheapest rates ever. Junk- rated companies sold an unprecedented $287.6 billion in bonds in 2010 and are setting an even faster pace of issuance this year. Claire's Stores Inc., the costume jewelry retailer that had debt that was almost 10 times its earnings last year, sold $450 million of bonds last month that Moody's Investors Service gave its third-lowest rating. While the economy expanded and companies are beginning to spend more, the improvements haven't driven the nation's unemployment rate below 8.9 percent for almost two years and the Conference Board's gauge of consumer confidence is still 37 percent below the level reached in July 2007." "The 2007-2009 recession period looks different from previous economic cycles," John McElravey, a bond analyst at Wells Fargo Securities LLC in Charlotte, North Carolina, said in a March 8 report. "Consumer credit outstanding contracted much more sharply than in other periods, and the return to positive growth rates has been relatively slow." "The biggest strain is still being felt by Americans looking to purchase homes. The market where banks once pooled non- government-backed mortgage loans into bonds and sold them to investors is virtually shuttered, with only two such deals in the past two years, according to data compiled by Bloomberg." "Banks, faced with demands to repurchase faulty loans that JPMorgan analysts estimate may cost lenders as much as $90 billion, have raised lending standards to avoid repeating mistakes made during the housing bubble that popped in 2006. Mortgage underwriters "have no latitude for common sense," said Angelo Cusinato, president of Resource Plus Mortgage Corp., a home-loan broker in Inverness, Illinois. "They are underwriting as if their concern isn't as much for the risk that the loan will go bad as the risk that they will have to buy back the loan because of some technicality in the paperwork. It continues to be very difficult, even for the homeowner that is absolutely solid gold." "While lending standards have been easing, Fed data show banks have been more reluctant to loosen requirements for consumers and small businesses that don't have access to bond markets and often pledge real estate as collateral for loans. "Currently the terms are pretty tight," Fed Chairman Ben S. Bernanke told the Senate Committee on Banking, Housing and Urban Affairs on March 1. "That is a problem for the housing market," he said, responding to a question from Senator Kay Hagan, a North Carolina Democrat was concerned that qualified mortgage borrowers are being denied an opportunity to take advantage of low rates." "Banks relaxing loan criteria to large corporations outnumbered those tightening by 10.5 percentage points in the Fed's two most recent quarterly surveys of senior loan officers. That's the highest rate since 2006. For prime residential mortgages, a net 1.9 percent were still tightening. For consumer loans other than credit cards, the measure was 3.7 percentage points in the most recent survey and 5.5 in the previous one." "For small businesses, loan officers easing outnumbered those tightening by 1.9 percentage points after 7.1 points in the previous period. The banks were still toughening their criteria for small businesses and consumers through the first quarter of 2010, while they already started loosening for corporations, the survey data show.' "The opening of the credit spigot to large companies has been most evident in the bond markets. The Fed's near-zero interest rates and its $2 trillion of bond purchases since January, 2009 prompted investors last year to pump a record $372.5 billion of cash into funds that buy debt, according to fund-flow tracker EPFR Global. Claire's Stores, the Pembroke Pines, Florida-based retailer of costume jewelry for teens that last year had debt 9.6 times its earnings before interest, taxes, depreciation and amortization costs, refinanced some of the debt by selling $450 million of senior secured bonds that pay a yield of 8.875 percent. Moody's, which rated the bonds Caa3, said that unless the company's earnings "significantly improve," it may have difficulty refinancing the remaining $1.2 billion of a term loan that matures in May 2014." "Investors have been drawn to corporate debt because, unlike consumers, company Treasurers have been sitting on record amounts of cash and earnings are growing, helping defaults to plunge from the highs reached during the recession. The default rate among U.S. speculative-grade companies has dropped to 2.8 percent through February from 12.8 percent a year earlier, according to Moody's. The ratings firm is projecting the rate will continue dropping through the next year, to 1.7 percent in February 2012. "Corporate America has been stockpiling a lot of cash," said Greg McBride, a senior financial analyst at North Palm Beach, Florida-based Bankrate.com. "From the standpoint of access to credit markets, they look like a pretty good risk." "At the same time, a greater proportion of homeowners are falling behind on their monthly payments than had been seen in three decades of record keeping by the Washington-based Mortgage Bankers' Association before the recession. "A major stumbling block for restoring credit to small businesses and consumers is lingering problems with residential real estate," said John Lonski, chief economist at Moody's Capital Markets Group in New York. "Though we see some signs of stabilization in housing, many are concerned there' could be another 5 percent to 10 percent drop in home prices, which would add to the number of home mortgages underwater." Mortgage brokers say the depressed housing market is struggling on concerns by banks that they would be stuck buying back loans that investors say were misrepresented to them. Bond insurers alone have brought at least a dozen claims against banks including Bank of America and Credit Suisse AG seeking to compel them to repurchases loans they said they were fraudulently induced to guarantee. "They just want blood," said Grant Stern, owner of Morningside Mortgage Corp. in Bay Harbor Islands, Florida, who worked on trying to get Fairchild the loan he sought in Miami. "They're so afraid of a re-purchase that they're papering the files with everything they can get. 'Jeffrey Mezger, chief executive officer of homebuilder KB Home (KBH), recalls a buyer in southern California in November whose mortgage was held up by a lender because he couldn't produce the sixth page of a bank statement that was left intentionally blank. 'They said, 'Well, if you can't give me page six, I can't approve your loan," Mezger recalled during a February 16 interview at Bloomberg's headquarters in New York. "That's the kind of stuff that was going on. You're beating up a guy putting 30 percent down because you don't have the page left intentionally blank." – Shannon D. Harrington With possibility of obtaining a new mortgage so slim, we would advise potential homeowners to skip a home purchase using a traditional loan with banks, credit unions and other normal sources. An easier way would be to buy a home from a very distressed situation getting a very good price and putting 10-20% down in cash and demand the seller carry the mortgage at a normal interest rate. If this is impossible, either continue to rent or find another home that offers those terms. Normally, after 3-5 years, the seller could then sell that private mortgage to an institution. At a later date, credit is proven okay, and shows payments made on time. Those kinds of loans can be sold to traditional lenders as most of the risk has been taken out with a proven payment track record. -Editor        This posting includes an audio/video/photo media file: Download Now |
| The Gold Mining Business Model’s the Best There Is for Any Industry Posted: 25 Mar 2011 07:31 PM PDT
Also looking good in this market are precious metal stocks, as spot prices remain very strong. This is a sector that needs rising spot prices for stocks to keep advancing, but the money continues to tumble in if you're a gold producer. In fact, the business model is so good that most growing producers don't know what to do with all their excess cash (what a great problem to have!). As an example of the kind of profitability you can find in the precious metal sector, Avion Gold Corporation (TSX/AVR) is but one junior mining company that's cashing in due to strong gold prices. Avion Gold is a junior Canadian gold miner with exploration and production facilities in West Africa. The company holds 80% of the Tabakoto and Segala gold projects in Mali. Avion Gold announced strong earnings of 18.63 million dollars ($0.05 per basic and diluted share) for the three months ended December 31, 2010. This compares to net income of 3.97 million dollars, or $0.02 per diluted share, generated in the same quarter last year. According to the company, it sold 27,908 ounces of gold at an average realized price of $1,370 per ounce, which represents a 10% increase over the average realized selling price of $1,234 per ounce in the previous quarter. Gold revenues were 38.2 million dollars, compared to 14.2 million dollars in the comparable quarter of 2009. Where I'm from, a business that sells 38 million dollars' worth of goods and generates over 18 million dollars in profits on those goods is really doing something right. Avion Gold produced 26,090 ounces of gold in the fourth quarter of 2010 at a total cash cost of $520.00 per ounce. For all of 2010, the company generated record earnings of 31.5 million dollars, or $0.09 per share, compared to 2.6 million dollars, or $0.01 per share, in the prior year. Total revenues were 115.3 million dollars compared to 33.6 million dollars in 2009 and total production grew to 87,631 ounces of gold. This year, Avion Gold expects to produce about 100,000 ounces of gold and the company is still predicting production of 200,000 ounces a year in 2012. This gold stock is just one in a large universe of junior mining companies that are making money hand over fist with gold prices over $1,000 an ounce. It's a great business model and it's likely to stay that way for a considerable period of time. Investing in gold has always been a risky business, because you can't control how much gold is in the ground and what's going to happen to the price of the commodity on the open market. All you can do as an investor is play the market as it is. In my mind, however, it's no different than investing in a technology company. The risks are the same and so is the unknown.
|
| What’s really driving the Gold Price? Posted: 25 Mar 2011 07:23 PM PDT |
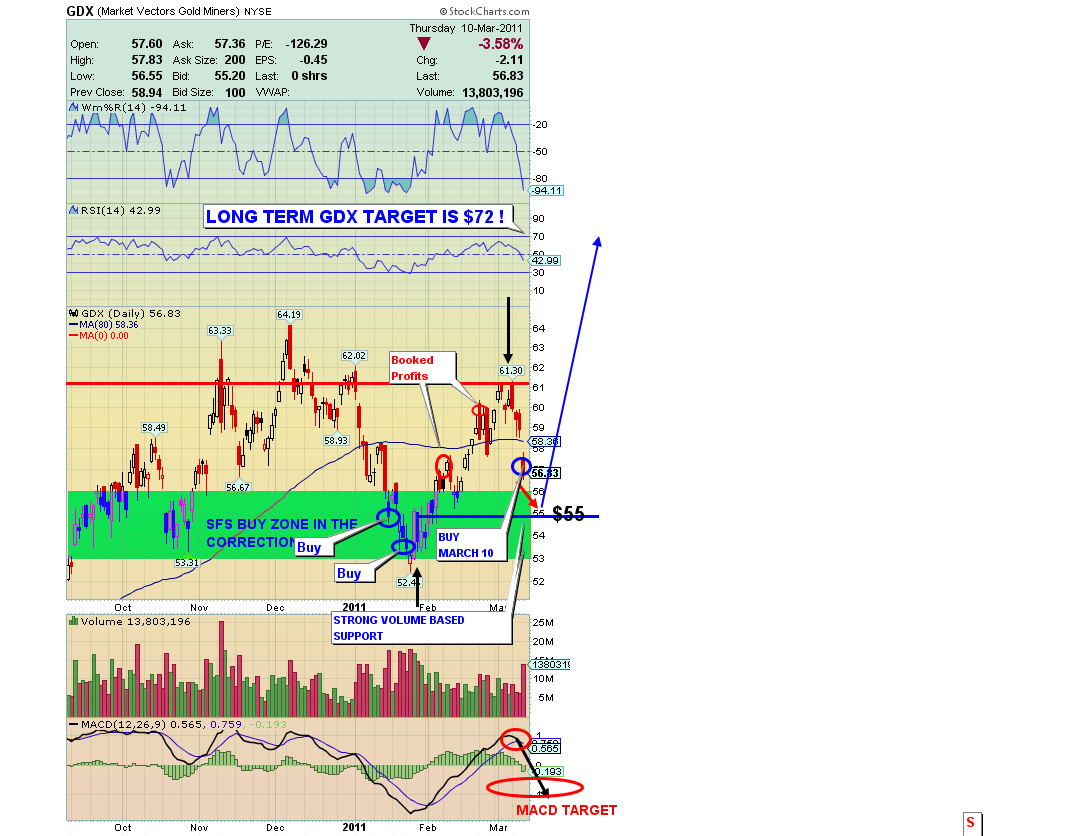
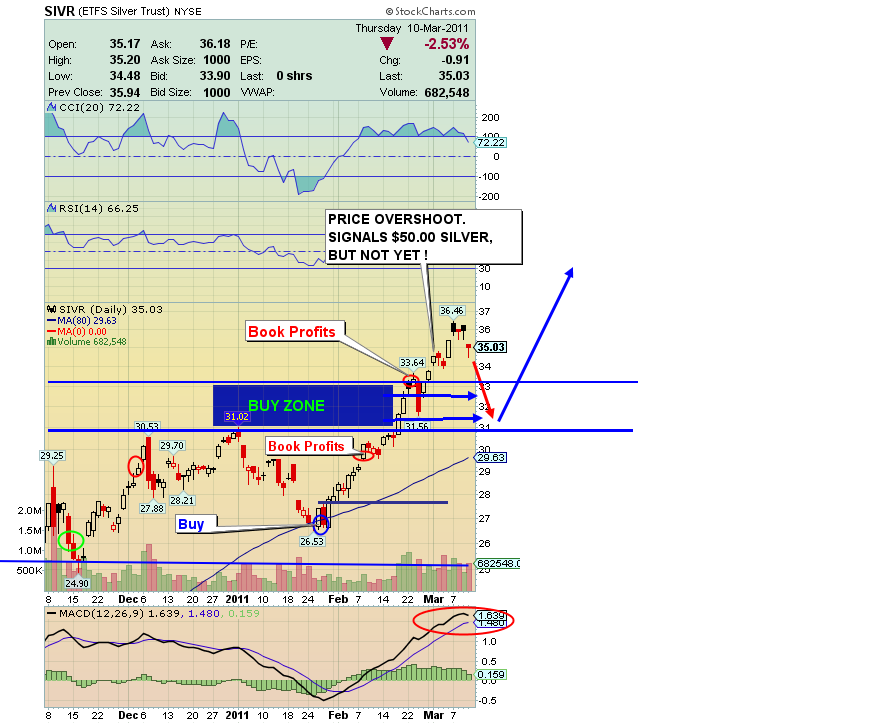
| “Gold & Silver Mkts: Price & Volume Update” – Morris Hubbartt Posted: 25 Mar 2011 07:13 PM PDT Super Force Signals UUP (US Dollar Proxy) Chart
Gold and Precious Metals
Gold Juniors GDXJ Chart GDXJ Chart Analysis:
GDX Chart Analysis
SIVR (Silver Proxy) 6 Mth Chart SIVR Chart Analysis
Unique Introduction For Web Readers: Send me an email to alerts@superforcesignals.com and I'll send you 3 of my next Super Force Surge Signals, as I send them to paid subscribers, to you for free! I'll do that for both my daily and 60 minute chart trading services! Thank-you! 25 SuperForce Buy or 25 SuperForce Sell: Solid Power. Stay alert for our Super Force Signals, sent by email to subscribers, for both the daily charts on Super Force Signals at www.superforcesignals.com and for the 60 minute charts at www.superforce60.com About Super Force Signals: Frank Johnson: Executive Editor, Macro Risk Manager. Email:
|
| Posted: 25 Mar 2011 07:07 PM PDT  GLD – on sell signal.  SLV – on sell signal. New high has not been confirmed by a new buy signal, yet. GDX – on buy signal. XGD.TO – on buy signal. Observations Since 2001, an average time frame to consolidate after making a new high in the $HUI has been between 4 to 6 months, therefore, the current consolidation which began in early Dec has a potential to break out to new highs in the next few weeks. Summary Disclosure End of update
|
| Why Gold and Gold Shares have Consolidated for Five Months Posted: 25 Mar 2011 06:13 PM PDT The Daily Gold |
| Bailouts, Bombs, Bullets and Bahrain Should Support Gold and Silver Posted: 25 Mar 2011 06:11 PM PDT |
| Gold and Silvers Daily Review for March 25th, 2011 Posted: 25 Mar 2011 06:07 PM PDT |
| Gold Bubble : Written in the Stars Posted: 25 Mar 2011 05:59 PM PDT
|
| Posted: 25 Mar 2011 11:25 AM PDT A number of market gurus have been looking into PE ratios recently. And they have been reporting their intriguing findings at length. For good reason Here's a summary of the deluge of analysis: the next ten years don't look rosy for stock markets, in much the same way as the decade to 2010 ended up being disappointing. First of all, a quick explanation of Price-to-Earnings ratios (PEs). Warren uffett-type value investors believe there is an inherent, or intrinsic, value to a stock based on its future earnings. When price is below that value, the stock is a buy. When prices rise above it, the stock is a sell. The trick is in calculating the value of the stock. All sorts of 'ifs', 'buts' and 'whens' come into the equation, as well as margins of safety. It takes a lot of time to complete the analysis, as our own value analyst, Greg Canavan, can tell you. He applies this analysis to ASX stocks in his newsletter Sound Money. Sound Investments. Part of the analysis - and perhaps its broadest summary - is the PE ratio. Put simply, the PE ratio is how much you are paying for future profits. The ratio is the stock's price divided by its expected earnings. The price is what you can buy the stock for in the stock market. How you define expected earnings is the tricky part. We won't go into it. A high PE ratio indicates share prices are high relative to a company's earnings. You pay a lot relative to what the company is expected to make. Low PE ratios indicate stocks are cheap relative to earnings. At what point PE ratios become expensive/cheap depends on the individual's opinion and history of the stock. How much are you willing to pay for the earnings of the company and how much have people tended to pay in the past are the key questions in determining what the PE ratio is telling you. The whole analysis can be applied to an entire stock market index in many different ways. The point being much the same: is the stock market overvalued or undervalued based on the price paid for future earnings of the companies in the index? One last item of theory: the efficient market hypothesis suggests all analysts are able to perfectly predict the earnings of a stock. This means that a stock's price will always equal its value. Put simply, stocks are never over or undervalued. They are always just right. So what has prompted the revered John Hussman, Mike Shedlock and John Mauldin to cover the state of PE ratios recently? (Sound Money. Sound Investment editor Greg Canavan also discussed it on Friday.) While many of the world's stock markets remain below 2007 highs, stock valuations relative to earnings are closing in on lofty heights that tend to spell disaster. Put differently, PE ratios are reaching dangerous highs compared to their norms. There are several ways to think about this. If you believe in efficient markets - that prices equal intrinsic value - then earnings would have to grow dramatically over coming years to justify current prices. A more likely explanation, for those who don't believe in perfectly efficient markets, is investors are too optimistic on the outlook for earnings. And this is causing them to drive prices up to levels above intrinsic value. Well above. An additional and pivotal cause for concern is that companies are too profitable at the moment. It sounds ridiculous, but as a Daily Reckoning reader should know, high profits don't last 'unless capitalism is broke' -as John Mauldin puts it. Competition pops up, employing people along the way. This reduces corporate profits exactly when the economy begins growing again. Kind of counter intuitive, which explains the unjustified earnings predictions of the mainstream .They expect the economy to grow and companies to increase profits. When earnings are revised downward, prices will have to follow, or PE ratios will become even more unjustifiable. Just eyeballing the chart of a popular type of index PE ratio, it isn't difficult to see US stocks falling 50% before becoming reasonably priced. And that's at current earnings projections. If capitalism kicks in, reducing profits, the justifiable prices based on past PE ratios will be even lower. The problem with this prediction is, as Keynes said, 'markets can remain irrational longer than you can remain solvent'. In other words, high PE ratios could persist as investors wait for earnings to improve - something that may never eventuate. Of course, this is rather ironic, as those postponing the recovery with their anti-capitalist policies are doing so in Keynes's name. The government is keeping the market irrational. Anyway, the PE analysis done by the three gurus mentioned is warning of a downtrend. These tend to last about two decades according to John Mauldin's analysis. Our two-decade slump in stock markets began in 2000, so we are in the second half. The implication is that the stock market won't be pretty for buy-and-hold-type investors over the next 10 years. At least for those who believe in diversification over careful stock picking. Oh, we forgot to mention the third explanation of dangerously high PE ratios. It needn't be because investors expect earnings to rise dramatically. Perhaps investors are just becoming willing to pay more for earnings. Or they simply prefer equities as an asset class. This would drive up prices regardless of earnings. In other words, it's an asset allocation matter. There are several reasons why equities might be more popular than before. The ideas that stocks rise with inflation and the end of massive bull markets in housing and bonds are two of the big ones. You have to put money somewhere. Especially when the government forces you to in the name of retirement. But this doesn't undermine the value investor's premise. As housing investors around the world discovered - and Australian housing investors are going to discover - the idea that people are willing to pay more for something than before is a passing cause for high prices. At some point, preferences change back. Which is difficult to predict, as people's whims do not conform to the analysis of PE ratios in the short term. So, for now, the stock market is an apparition of what it is supposed to be. After seeing bubble after bubble roll in and pop under the watch of central bankers, law makers and other monopolists, you don't have to be a genius to figure out the stock market isn't efficient. Prices don't stick to intrinsic values, they fluctuate all over the place. And stock markets aren't very helpful in predicting future earnings of the economy. But if stock markets fail as a forecasting mechanism, making them useless as a leading indicator of economic prosperity, why are higher prices considered to be good news? After all, as implied above, an improvement in the economy needn't equate to higher profits, which increase stock prices. What makes higher prices good in the stock market, when they are bad in the supermarket? Hint: The supermarket likes high prices. Yes, it's the finance industry that has you interpreting upward moves of the index as good - signified by a pleasant green colour - and falls in the market - signified by an angry red - as bad. Of course, the value investor knows better. A fall in prices means prices are either reverting to their value, or becoming an even more attractive buying opportunity. And even in the most overvalued markets, there are buying opportunities. Nick Hubble |
| Will Financial Problems In Portugal Cause The European Debt Crisis To Spiral Out Of Control? Posted: 25 Mar 2011 10:18 AM PDT 
The Prime Minister of Portugal, Jose Socrates, resigned on Wednesday after the major opposition parties banded together to vote down the austerity measures that he was requesting. The package of budget cuts and tax increases was intended to get Portugal's horrible debt crisis under control. Prior to the vote, the prime minister warned that he would no longer be able to run the country if the austerity package was not passed. Now there are all kinds of questions about what is going to happen to Portugal. At this point most financial authorities in Europe seem to be assuming that Portugal is going to need a bailout. Today, Standard & Poor's reduced the credit rating of long-term Portuguese government debt from "A-" to "BBB". Standard & Poor's is also warning that the credit rating may be cut further if negotiations for a bailout do not go well. Without a bailout, it seems almost certain that Portugal will default. Interest rates on Portuguese government debt have risen to unsustainable levels. The yield on 10-year Portuguese bonds hit 7.78% on Friday. That was the highest it has been since Portugal joined the euro. Authorities in Portugal are publicly saying that they simply cannot afford to pay that kind of interest. Unfortunately for them, it appears that Portugal is going to be forced to issue more bonds by June at the very latest. So how much would a bailout of Portugal cost? Well, according to one estimate, it would probably be in the neighborhood of 70 billion euros. That isn't going to sink Europe. However, the concern is that the crisis in Portugal could have a domino effect. There is increasing worry in Europe that Portugal's neighbor, Spain, could also need a bailout. But a bailout of Spain would potentially be so large that it would cause a financial nightmare for Europe. The following is how a recent article in the Wall Street Journal sized up the problem....
The truth is that the rest of Europe simply does not have the kind of financial muscle necessary to continue putting together huge bailouts indefinitely. If Spain does go down, it is going to put a massive amount of strain on the rest of the continent. There are other financial problems simmering in Europe right now as well. According to a recent Business Insider article, the financial problems in Ireland are also creating a lot of concern at the moment....
Ireland is a financial basket case right about now. Confidence in Irish debt is rapidly evaporating. In fact, the yield on 10-year Irish bonds recently hit 10.12%. Ouch! But that is nothing compared to what Greece is being forced to pay. The yield on 10-year Greek bonds recently reached an astounding 12.58%. There are persistent rumors that Greece is going to need yet another bailout. The truth is that Germany and the other European nations that are coming up with the cash for these bailouts are just pouring their money into financial black holes. Nations like Greece and Ireland are just money pits at this point. As I have written about previously, the financial collapse of Europe has basically become inevitable. The EU can keep coming up with bailout plan after bailout plan, but they are only putting off the crash for a while. Eventually a point will come when all of the balls simply cannot be kept up in the air anymore. So what is going to happen once that point is reached? Well, many believe that we could actually see the end of the euro and potentially even the break up of the European Union. Of course top politicians in Europe will fight tooth and nail to keep that from happening, but the truth is that at some point we are going to see some incredibly challenging financial problems in Europe. How the EU responds to the crisis is going to be extremely interesting to watch. So many people talk about the death of the U.S. dollar, but the truth is that we could very easily see a financial collapse and a major currency crisis in Europe prior to the collapse of the dollar. Europe is in really, really bad shape right now. Of course it doesn't help that the entire world is so incredibly unstable right now. The disaster in Japan, the war in Libya, the revolutions across the Middle East and the surging price of oil all threaten to throw the global economy into turmoil. As I discussed in a previous article, people need to start preparing for economic disaster. The entire global financial system is coming apart. The U.S. economy is crumbling, Europe is dealing with an unprecedented debt crisis and Japan has just been struck with the worst economic disaster that it has seen since World War 2. Most Americans don't pay much attention to what is going on in Portugal (or in the rest of Europe for that matter), but they should. The world is more interconnected than ever, and if Europe experiences a financial meltdown it will have dramatic consequences for the United States as well. The financial crash of 2008 swept the entire globe and virtually every nation on earth was deeply affected. The next wave of the financial crisis is also going to be felt globally. We live in one of the most interesting times in the history of the world. Are you prepared for what is about to happen? |
| Friday ETF Roundup: EWJ Slumps on Continued Japan Fears, UNG Surges on Weather Posted: 25 Mar 2011 09:52 AM PDT ETF Database submits: U.S. equity markets soared to start Friday trading, fell back to earth, but still managed to ultimately post modest gains to close out the week. The Dow rose by 50 points while the Nasdaq and S&P 500 rose by 0.2% and 0.3%, respectively as strong performances out of Apple (AAPL), and some basic materials companies helped to carry the day. Commodity markets were more mixed, however, as gold lost $6/oz. and oil added just $0.04 on the day as demand for safe havens cooled slightly in the session. Investors did, on the other hand, scoop up a variety of agricultural commodities as livestock products gained, and grains and softs rose broadly as well. Meanwhile, bond prices tumbled as Federal Reserve official Charles Plosser called for swift changes to Fed policy. In the speech, Plosser called for hikes from the current rate level of roughly zero percent up to 2.5% within Complete Story » |
| Salivating at the Upside Potential of the Gold Market Posted: 25 Mar 2011 09:00 AM PDT Not long ago, as I recall, a pension fund in some foreign country, one of those Scandinavian ones I think, was ordered to invest no more than about 3% of its custody assets in gold, meaning that the fund had too much gold, and to sell part of its gold holdings in order to comply. Personally, I think that the 4,500-year historical record shows that being 100% invested solely in gold over the long-term is almost always a Very, Very Good Idea (VVGI), while the 4,500-year record of being solely invested in stocks, bonds and housing over the long-term is almost always a Very, Very Bad Idea (VVBI). Thus, even to a really stupid guy like me, it doesn't take a lot of brain-horsepower to quickly see that to arbitrarily limit gold in one's entire retirement holdings to a measly 3% is, in a word, stupid, whereas 100% invested in gold is not, again in a word, stupid, but, rather, in yet another word, intelligent, in that gold soars while the debasement of a fiat currency is always complete and catastrophic. Or perhaps the word, in a word, could be "erudite," as in referencing the Mogambo Book Of Economics Stuff (MBOES) under "Erudite: at least glancing at the entire 4,500 years of history and seeing very clearly that to not be 100% invested in gold and silver over the long-term, especially when your government is allowing such frightening increases in the money supply, is stupid and ultimately ruinous. See also 'Broke, Why, Stupid, People' and 'Catchphrase, We're Freaking Doomed (WFD)!'" After all this talk of erudition, I am embarrassed to admit that I don't know the word for "stupid" in any of those Nordic languages. I don't worry, however, because the word for "stupid" in Spanish is "el Stupido," so I figure that if any of those Scandinavian guys speak no English but they savvy a little Spanish, they can easily translate it for everybody else so that everybody can know that they are, you know, stupid, in case they didn't know. Unfortunately, this translation thing will not convey how I laugh at them with an undisguised Mogambo Sneer Of Contempt (MSOC), and/or how I, following the proud tradition of Monty Python, fart in their general direction to show my scornful disdain at their limiting ownership of gold to 3% of holdings. So, my Timely Mogambo Tip (TMT) is that if you are some dumb-ass Scandinavian who is letting these morons manage your retirement money, then you may be interested to know that you are, as would seem to be inferred by this time after the foregoing paragraphs which is one long indictment of the level of laughable ineptitude of these losers, also stupid. Of course, the stupid British let their stupid prime minister, the stupid Gordon Brown, sell all Britain's gold at less than $400 an ounce, so it is not that there is no precedence for this kind of idiocy! Hahaha! I bring it up because it fits perfectly with the essay titled "The Driver for Gold You're Not Watching" by Jeff Clark of Casey Research. He says that "the elephant in the room is pension funds. These are institutions that provide retirement income, both public and private." The "elephant in the room" part refers to size, not smell or any of the other huge downsides to owning an elephant in an urban, apartment-dwelling environment, as "Global pension assets are estimated to be – drum roll, please – $31.1 trillion. No, that is not a misprint." He calculates for us that this staggering $31.1 trillion "is more than twice the size of last year's GDP in the US ($14.7 trillion)"! That exclamation point was put there by me, for dire reasons that I only vaguely suspect, as even a piddly 3% of that $31.1 trillion pile of retirement money, invested in gold, is a whopping $933 billion invested in gold!! "Why the double exclamation points?" you ask. Have I got some weird reason why I am always using so many exclamation points, like maybe I am being paranoid and weird, plus be a full-time lunatic and part-time father? Well, probably yes, for one thing, but also because, "The market cap of the entire sector of gold stocks (producers only) is about $234 billion," while "If these funds allocate just 5% of their assets to gold – which would amount to $1.5 trillion – it would overwhelm the system and rocket prices skyward." He goes on "According to estimates by Shayne McGuire in his new book Hard Money; Taking Gold to a Higher Investment Level, the typical pension fund holds about 0.15% of its assets in gold. He estimates another 0.15% is devoted to gold mining stocks, giving us a total of 0.30% – that is, less than one third of one percent of assets committed to the gold sector." My excitement rising, he goes on, "And let's not forget that this is only one class of institution. Insurance companies have about $18.7 trillion in assets. Hedge funds manage approximately $1.7 trillion. Sovereign wealth funds control $3.8 trillion. Then there are mutual funds, ETFs, private equity funds, and private wealth funds. Throw in millions of retail investors like you, me, Joe Sixpack, and Jiao Tsingtao, and we're looking in the rear view mirror at $100 trillion"! And this $100 trillion mountain of money trying to get into a market of gold and gold stocks that is currently valued at less than $1.5 trillion makes me, and him, too, salivate at the prospect, as he concludes, "I thought of titling this piece, 'Why $5,000 Gold Is a Conservative Forecast.'" And with numbers like that, and the last 4,500 years of history showing that people eventually stampede into precious metals in a panic, what can you say except, "Whee! This investing stuff is easy!" The Mogambo Guru Salivating at the Upside Potential of the Gold Market originally appeared in the Daily Reckoning. Daily Reckoning founder Bill Bonner recently wrote articles on stagflation and the great correction. |
| Gold Miner ETFs: Breaking Down the Options for Investors Posted: 25 Mar 2011 08:30 AM PDT Michael Johnston submits: The ETF industry as a whole has grown tremendously in recent years, with both assets and the number of products surging as investors embrace the exchange-traded structure as an efficient vehicle for accessing everything from U.S. stocks to Asian bonds to corn and cocoa. Certain corners of the market have, of course, expanded more quickly than others. One hotbed of activity is the commodity space, where investors have flocked to a number of new products, opening up an asset class with potential to enhance returns and smooth volatility. The commodity ETF boom hasn't been limited to products offering exposure to natural resource prices through either physical bullion or futures contracts, though many funds meeting those descriptions have |


 The economic news out there still isn't great, but the stock market doesn't seem to care. Equity investors seem only worried about first-quarter earnings and the outlook for the numbers remains very bright.


| You are subscribed to email updates from Gold World News Flash 2 To stop receiving these emails, you may unsubscribe now. | Email delivery powered by Google |
| Google Inc., 20 West Kinzie, Chicago IL USA 60610 | |
No comments:
Post a Comment