


saveyourassetsfirst3 |

- Derivatives: The Big Banks' Quadrillion-Dollar Financial Casino
- COT, Bart Chilton: Bullish On Silver
- As China's Relentless Advance Continues, U.S. Unaware It's in War
- Proxy Games at Lions Gate?
- Commodities Detach From the Dollar, Rise on Their Own
- Crash JP-Morgan buy Silver videos........
- Income Taxation and Hoarding
- HARVEY ORGAN: Is Silver Really Worth $424/oz?
- Buy Gold and Silver Through a Commercial Bank and You May End Up With a Vault Full of Air
- Gold and Silvers Daily Review for December 13th, 2010
- Interesting facts about Ft Knox
- Banks are rushing into this emerging mining region
- Top commodity analyst: Gold to beat silver now
- Marc Faber: The bear market in bonds is just beginning
- Hyperinflation Watch - December 13, 2010
- Some banks unwilling to hand over client-held physical gold and silver?
- Central banks have rigged gold for decades, Rickards tells interviewer
- Can Paper Bring Prosperity?
- Gold and the Overall Strength of the Market
- The Timing of QE2 Was No Accident
- Gold & the Overall Strength of the Market
- I think I just shi# my pants again.
- Banks Win Again
- One Word of Advice For Those Playing the Australian Boom
- Technology is the Best “Inflation Trade”
- Weekly Market Update Excerpt
- A Gold Correction is an Option
- Gold’s Gleam Will Not Fade Away Because of the Current Decline
- Derivatives: The Quadrillion Dollar Financial Casino Completely Dominated By The Big International Banks
- This past week in gold
- Charting The US Fiscal Catastrophe
- Metals May Continue to Decline on Yields
- Soaring With the Eagles
- Gold & Overall Strength of the Market
- COT Flash December 12, 2010
- Oh Sh*t, here's a contrary indicator for gold
- Weekender: The Von Mises Prophecy Explained
| Derivatives: The Big Banks' Quadrillion-Dollar Financial Casino Posted: 13 Dec 2010 06:18 AM PST Michael T. Snyder submits: If you took an opinion poll and asked Americans what they considered the biggest threat to the world economy to be, how many of them do you think would give "derivatives" as an answer? But the truth is that derivatives were at the heart of the financial crisis of 2007 and 2008, and whenever the next financial crisis happens, derivatives will undoubtedly play a huge role once again. So exactly what are "derivatives"? Well, derivatives are basically financial instruments whose value depends upon or is derived from the price of something else. A derivative has no underlying value of its own. It is essentially a side bet. Today, the world financial system has been turned into a giant casino where bets are made on just about anything you can possibly imagine, and the major Wall Street banks make a ton of money from it. The system is largely unregulated (the new "Wall Street reform" law will only change this slightly) and it is totally dominated by the big international banks. Complete Story » |
| COT, Bart Chilton: Bullish On Silver Posted: 13 Dec 2010 06:06 AM PST The structural changes that have taken place over the last 9 weeks remain intact and will likely resume after some of the 4 & 8 largest can add long and/or spread positions in order to minimize future losses. Judging by the way the way this has played out over the last eight or nine weeks, I would suspect this same trend to continue, which goes along with higher silver prices. Referring to the chart below, the gross short position continues to decline albeit at a very slow rate while the gross long position also declined at an even slow pace, thus the unadjusted Net Position decreased nearly 1,000 contracts or approximately 5,000,000 ounces (each contract represent 5,000 ounces). Before adjusting for both non commercial and commercial spread position, the four largest commercial banks net short position decreased by nearly 2,000 contracts or 2.70%. But of course, we need these adjustments so our perception of the report remains real and consistent. Non commercials spreads increased rather dramatically, increasing net open interest by nearly 3.5%. Making the final adjustments for commercial spreading and real net open interest, the top 4 and 8 largest currently account for 53.04%(decrease of 3.49% week over week) and 70.77% ( decrease of 4.43% w/w). We have finally seen the commercial net short position drop below 30% of total world bullion inventory held net short (using the upper range of estimates 1b oz). Complete Story » |
| As China's Relentless Advance Continues, U.S. Unaware It's in War Posted: 13 Dec 2010 05:51 AM PST Sy Harding submits:Wars between major countries are no longer fought on the high seas, or on land with vast armies, but in board rooms and markets. It’s now economic warfare that threatens to alter the global landscape, enriching the winners and creating hardship for losers. It’s no longer about which country has the largest navy or nuclear arsenal. It’s about which country can win the economic battles. Someone needs to inform Congress and the Federal Reserve, since they rarely mention China’s oncoming juggernaut. Congress is currently in a contentious debate over the U.S. defense budget, making sure the country can handle the types of war that threatened in the 1980s. To cut spending on military hardware or increase it, to build more F-22 fighter planes and aircraft carriers, or spend more on unmanned drones and beefed-up ground forces. While remaining by far the most powerful military presence in the world, the U.S. has not won many battles in the economic war of the last decade. The economic powerhouse has been China. Over the last ten years China’s economy has surged past those of Canada, Spain, Brazil, Italy, France, Germany, and this year passed Japan, to become the second largest economy in the world. China’s economy still trails the U.S. economy, but is closing fast. The International Monetary Fund and the CIA’s World Factbook, seem to agree that of the world’s total annual Gross Domestic Product of $70.1 trillion, the U.S. accounts for $14.2 trillion, and China about $9 trillion. However, China’s annual GDP has grown 800% from just $1.1 trillion in the year 2000, while the U.S. economy has grown 60% from its level of $8.7 trillion in 2000. So current estimates that China cannot overtake the U.S. to become the world’s largest economic power until at least 2020 may be wishful thinking, particularly given the diverging paths of late between the two economies. The U.S. economy came close to total collapse in 2008, and is still on life support provided by the most massive government rescue effort in history. Still worried more than a year after its Great Recession ended in June of last year, the U.S. government has just commenced another round of quantitative easing to try to lower interest rates even further, in an effort to make sure its economy doesn’t double-dip back into recession. Meanwhile, China’s economy is so strong that its government has been raising interest rates and taking other aggressive steps to cool it off. While the U.S. real estate industry is in a Depression with a capital D, China is concerned that its real estate industry is growing too fast and is also trying to slow it to a more sustainable pace. While the U.S., already the world’s largest debtor nation, is forced to take on increasing debt by issuing large amounts of new treasury bonds to finance its stimulus efforts, China, which overtook Japan this year to become the world’s largest creditor nation, is the owner of much of that U.S. debt, holding an estimated $1.7 trillion of U.S. bonds and dollars. Now it’s being estimated that 40% of the additional liquidity the Fed has begun pouring into the U.S. financial system will also wind up in China. For example, as the Wall Street Journal reports, large U.S. chemical company Huntsman Corp. (HUN) leapt at the chance to refinance $530 million of its long-term debt, which lowered its interest costs and pushed out repayment dates. The company said that will allow it to invest more in its business. But the Journal reports that the company’s biggest investment plans are for operations in the fast-growing economies of Asia. Every day we read of major U.S. companies borrowing cheaply in the U.S., as intended by the stimulus efforts, but then free to invest that capital in China and other Asian nations. That may be good for their investors, but will produce jobs in China and other Asian nations, not in the U.S. Major U.S. banks and brokerage houses, who are similarly using their rescued capital for impressive expansions into China. There’s something wrong in that activity. Meanwhile, China’s economic battle tactics are becoming more ominous. This year it began to attack the long-time position of the U.S. dollar as the standard currency in international trade, encouraging the use of its currency, the yuan, in trade settlements. While still a small portion of trade settlements, it has had some success, the use of the Chinese yuan in global settlements tripling in the third quarter of this year. China and Russia have also issued joint announcements that they will begin using their own currencies in bilateral trade between the two countries. The U.S. doesn’t seem to even be aware it’s in a war, since guns are not firing. But it’s a war the U.S. will be the worse for if it loses. Providing more liquidity for the U.S. economy only to allow corporations, banks, and investors to send 40% of it to China is the latest strange way to wage the economic war. Disclosure: I have no positions in any stocks mentioned, and no plans to initiate any positions within the next 72 hours. Complete Story » |
| Posted: 13 Dec 2010 05:47 AM PST There appears to be a delay (by design?) concerning the ‘gold proxy’ vote instruction form for Carl Icahn’s nominees for directorships at Lions Gate (LGF). Lions Gate’s annual shareholder meeting is tomorrow, Tuesday, December 14. I received the company’s white and most recently its blue proxy cards via mail over the past week or two. However, Icahn’s gold proxy just arrived today, the day prior to the meeting. Note that I am located a mere 2 1/2 hour drive from where the proxy vote materials were purportedly sent. Receiving the materials a day in advance of the meeting is unreasonable and suggests it could be by design. Who is to know if someone was told to sit on the materials and delay their sending. For a packet that was supposed to be ready for delivery on the 6th of December to take a full week to arrive in a neighboring state naturally raises suspicion. We shall see if we can learn if there is a story behind this. Complete Story » |
| Commodities Detach From the Dollar, Rise on Their Own Posted: 13 Dec 2010 04:44 AM PST Wall Street Cheat Sheet submits: By Jordan Roy-Byrne In the first phase of its bull market in the earlier portion of the last decade, Commodities began a bull market on the back of a falling US Dollar. The greenback declined while commodities, stocks, foreign currencies and even bonds rallied. The universal bull market could be better termed a dollar bear market. The movement of risk assets and especially commodities were, in most cases, hostage to the trends in the buck. Complete Story » |
| Crash JP-Morgan buy Silver videos........ Posted: 13 Dec 2010 04:23 AM PST Here's a good one ~ feel free to post your own favorites. Be sure to view the ending. |
| Posted: 13 Dec 2010 03:45 AM PST "Hoarding", the stockpiling of particular items due to a perception of future shortages or exceptional needs, has become an important topic among economists these days. With U.S. hyperinflation looming, we not only have anecdotal reports of individuals stockpiling essential items (along with acquiring "physical" bullion), but we see commodity prices soaring. This is not due to current demand, but rather many nations (led by China) are stockpiling vital resources, knowing that the reckless money-printing of Western bankers (and governments) guarantees an inflation-spiral ahead. We know that Western governments (especially the U.S. government) are extremely fearful of this commodities hoarding, not because they are willing to do anything to put the brakes on their out-of-control money-printing, but because they have already taken clear aim at "speculators". Supposedly, it is these speculators (accumulating commodities) who are to blame for inflationary pressures. This is a typical reaction of our corrupt and incompetent Western "leaders". They create a problem, and then instead of taking responsibility for their failures, they blame people who are reacting to that problem in a sensible manner – who see higher prices coming, and so they are buying goods at lower prices. How is that in any way an 'evil' that needs to be prevented? In fact, it is not. I devoted an entire commentary to pointing how it is excessive "shorting" in markets which causes much, much more economic harm than "speculators" who engage in "hoarding". In fact, in many cases hoarding is a "virtuous" form of behavior, which helps to conserve precious stockpiles. I urge readers to review that commentary, so that they are clear in their own minds that it is the manipulative "shorts", and the reckless money-printers whose conduct needs to be arrested (in more ways than one). This particular commentary is not focused upon commodities hoarding, but on a different form of economic hoarding – which has continued uninterrupted for an entire century – and which our morally and intellectually bankrupt "leaders" have ignored for that entire century. I have written many previous commentaries on the horribly destructive force known as "income taxation". It is a matter of the simplest arithmetic that any and every income taxation system will (over time) suck all the wealth out of the broader economy, and deposit it into the vast fortunes of the ultra-wealthy. Again, this is a topic with which I strongly urge readers to familiarize themselves, since it is not the subject of this particular piece. What I want to focus upon is how all of the hypocrites in government can repeatedly "warn us" about the evils of hoarding while ignoring the hoarding of $10's of trillions in idle wealth. We can see with reports of "debt crises" across the Western world that both on a personal level and a national level our economies have been totally hollowed-out, and now both individuals and governments face bankruptcy – on a scale never before seen in human history. This mass insolvency is occurring in what are still the "wealthiest" nations on Earth. This begs an obvious question. Where is all of our money? Of course, I have answered this question before I asked it. All of the wealth of our economies is being hoarded by a tiny group of history's greediest misers – who have amassed vast fortunes which would have been the envy of any King or Queen in the Middle Ages. |
| HARVEY ORGAN: Is Silver Really Worth $424/oz? Posted: 13 Dec 2010 03:45 AM PST exclusive! HARVEY ORGAN 1 of 2 : Is Silver Really Worth $424/oz? |
| Buy Gold and Silver Through a Commercial Bank and You May End Up With a Vault Full of Air Posted: 13 Dec 2010 02:59 AM PST
|
| Gold and Silvers Daily Review for December 13th, 2010 Posted: 13 Dec 2010 02:38 AM PST |
| Interesting facts about Ft Knox Posted: 13 Dec 2010 12:44 AM PST http://www.usmint.gov/about_the_mint...on=fun_facts13 Now holds 147.3 million ounces. Highest amount held was 649.6 million ounces in December 31, 1941. Not sure if that was all owned by the US, or if some of that is now stored in other locations like the NY Fed depository, but that is a huge difference. |
| Banks are rushing into this emerging mining region Posted: 13 Dec 2010 12:21 AM PST From Mineweb: Indonesia's mining sector has attracted 53 trillion rupiah, or $6 billion in bank financing up to September this year, surpassing 43 trillion rupiah for all of 2009, and is set to grow further in coming years due to strong demand and escalating prices of minerals. The figure far exceeds the 14 trillion rupiah that banks loaned to the mining industry in 2006, figures from Bank Indonesia show, despite current uncertainties over the country's new mining law. The growing industry has persuaded banks to extend loans to develop mines and for support activities such as transportation, said Francisca Nelwan Mok, managing director of corporate banking at Bank Mandiri, Indonesia's top lender. "Indonesia's mining industry has been... Read full article... More on mining: Why you should buy Wyoming's tiny mining stocks These are three of the last cheap gold stocks in the world today This is where the next great China commodity boom will happen |
| Top commodity analyst: Gold to beat silver now Posted: 13 Dec 2010 12:20 AM PST From Bloomberg: Gold may outperform silver, lifting the ratio between the two metals by as much as 20%, according to technical analysis by Societe Generale SA. The ratio of gold to silver steadied after dropping as low as 46.6 last week, near a two- year channel support line and the lows of 2008 and 1999. The ratio may climb to between about 56 and 58, which are retracement levels of the decline from June that are singled out in so-called Fibonacci analysis. "The gold-silver ratio reached an important support at 47.5/46," said Stephanie Aymes, a cross-commodity technical analyst with Societe Generale in London. "Gold will outperform silver to 56/58." An ounce of gold bought as little as 46.6 ounces of silver in London on Dec. 7, the least in almost four years. Precious metals gained this year on demand for a protection of wealth and an alternative to currencies. Some investors betting that silver may benefit from an economic recovery pushed the metal's 2010 advance to 70%, outperforming gold's 26% gain. Silver is used more in industry than gold. The ratio's 14-day relative strength index last month rebounded from a two-year falling trend support line and has been "posting bullish divergences," Aymes said. The index fell to 14.7 on Nov. 8 and was at 36.66 on Dec. 10. Some analysts view a level of 30 as an indication of possible gains. Gold for immediate delivery reached a record $1,431.25 an ounce on Dec. 7 and traded at $1,386 at the end of last week. Silver last week climbed to a 30-year high of $30.7025 an ounce and was last at $28.6712. The ratio was at 48.3054 on Dec. 10. In technical analysis, investors and analysts study charts of trading patterns and prices to predict changes in a security, commodity, currency or index. Fibonacci analysis is based on the theory that prices tend to drop or climb by certain percentages after reaching a high or low. To contact the reporter on this story: Nicholas Larkin in London at nlarkin1@bloomberg.net. To contact the editor responsible for this story: Claudia Carpenter at ccarpenter2@bloomberg.net. More on gold: This could kill the bull market in gold How you'll know when gold is a bubble Man denied access to his gold at Swiss bank: "The gold was not there" |
| Marc Faber: The bear market in bonds is just beginning Posted: 13 Dec 2010 12:19 AM PST From Investment Postcards from Cape Town: In this Bloomberg interview, Marc Faber, author of the Gloom Boom & Doom Report, discusses the U.S. deficit and also comments on financial markets. According to him, the yield of 10-year Treasury Notes will rise to 5% in the medium-term. However, in the short run he sees... Read full article (with video)... More from Marc Faber: Marc Faber: Don't worry if gold crashes... Marc Faber: A major market "turning point" is coming Marc Faber: The two investments every American should own |
| Hyperinflation Watch - December 13, 2010 Posted: 12 Dec 2010 11:30 PM PST Numbers Don't Lie December 13, 2010 For several months I have been warning that hyperinflation of the US dollar is looming. The ominous signs of this impending currency |
| Some banks unwilling to hand over client-held physical gold and silver? Posted: 12 Dec 2010 10:44 PM PST Some banks unwilling to hand over client-held physical gold and silver? Anecdotal evidence, so far, suggests some banks may be having trouble laying their hands on client-owned bullion in their own vaults. Author: Lawrence Williams Posted: Thursday , 09 Dec 2010 LONDON - For some time some of the more outspoken gold commentators, like GATA, have been suggesting that title is held to far more gold and silver supposedly stored in bank's vaults, than is actually there - indeed they even have been questioning Central Banks' holdings of physical bullion - even in Fort Knox. Now there is some anecdotal evidence emerging on the internet and news programmes that may serve to back up some of these claims, at least as far as some commercial banks are concerned. The theory that physical gold and silver may be in short supply comes about because there appears to be more gold, in particular, supposedly held by the banks than is in reality in existence. While banks do not hold the amount of cash on hand that is owed to depositors at any given time (hence the serious consequences of a run on a particular bank), the premise is that the same may well be applied by these banks to stocks of bullion. In this case, so the banks may say, that if push comes to shove, they would be able to lay their hands on the actual metal fairly quickly - or at the very least provide cash in lieu, although this may not be wanted by the metal owner. It certainly has been assumed that 'allocated' gold (or silver) is actually kept on hand, but 'unallocated' bullion may be loaned or sold, but returned or repurchased should the need arise. However the analysts will also tell you that the amount of gold or silver traded in virtual transactions exceeds the global holdings by a large multiple and if everyone insisted on physical delivery of their metal, this would be completely impossible to provide. If a bank holds physical gold or silver on a client's behalf, storage fees will be being charged, but if that gold or silver is not actually being held in the vaults, but has been say leased out to a third party, would it be fraudulent to continue charging for this 'storage'? - a point which probably has yet to be challenged legally. But such days may be close. A couple of days ago King World News of the U.S. quoted Jim Rickards, a long term proponent of gold market manipulation by banks and governments and extremely well respected - as saying that he knows of an investor in physical gold who had to haggle with a Swiss bank, which was supposedly storing gold for him, for a full month to achieve physical delivery of his own owned bullion - a considerable amount - $40 millions worth. And the gold was only returned to him after threats to resort to legal action and give the story to the media. Subsequently, Gold Money founder James Turk, told the same news progamme that he has already come across a number of similar cases and recounted a specific one showing that investors in even relatively small amounts of physical bullion have experienced similar problems. In this case the investor held some $550,000 (20,000 ounces) in physical silver, also supposedly held on his behalf in a Swiss bank, and has been negotiating with them for two months so far without being able to take delivery of his own silver. The bank had apparently been suggesting that he take the cash value, but he was holding out for delivery of the physical bullion. Both these instances, and the other unquoted ones referred to by Turk, could be taken to suggest that the banks did not have the investors' specific allocated gold or silver in their vaults, despite charging fees for its 'storage'. Rickards also went so far as to suggest that holders of physical bullion store their metal in privately run vaults rather than within the banking system. So far all these reports have been anecdotal with neither the specific investors not the banks involved being named. But if this is endemic in the system and the banks are not holding even the 'allocated' bullion they say they are it can't be too long before more detailed cases come to light. This could really throw the precious metals markets into turmoil and precipitate the short squeeze to end all short squeezes if holders of physical metal lose confidence in the banks which are holding their bullion - if indeed they are! http://www.mineweb.com/mineweb/view/...tail&id=92730 |
| Central banks have rigged gold for decades, Rickards tells interviewer Posted: 12 Dec 2010 07:40 PM PST
|
| Posted: 12 Dec 2010 05:53 PM PST Dollar Daze |
| Gold and the Overall Strength of the Market Posted: 12 Dec 2010 05:34 PM PST GoldandOilGuy |
| The Timing of QE2 Was No Accident Posted: 12 Dec 2010 04:05 PM PST Do you think the Fed's decision to move ahead with QE2, despite the strengthening economy rhetoric, was coincidence with the rollover in the "the Formula" and "Leading Formula" in November? Don't think so. When the formula rolls over, it begins to feed on itself as described by Jim. Identification of the real secular trends shows the path to profit in this business. "The Formula" US Fiscal Balance vs US Dollar: Federal Government Budget As A % of GDP, 12 Month Moving Average: "Leading Formula" Federal Taxes Withheld (TW) Less Total Government Outlays (TO) As A % of GDP, 12 Month Moving Average: Headline: November federal budget deficit highest on record The federal budget deficit rose to $150.4 billion last month, the largest November gap on record. And the government's deficits are set to climb higher if Congress passes a tax-cut plan that's estimated to cost $855 billion over two years. The Treasury Department says November's budget gap was 25 percent more than the deficit in November 2009.
|
| Gold & the Overall Strength of the Market Posted: 12 Dec 2010 02:42 PM PST The past week has been interesting to say the least. Gold is trying to find support while the SP500 grinds its way higher. Let's jump into the charts and analysis to get better feel for what I feel is happening here. Gold 4 Hour Chart The current selling volume is not exactly a healthy sign if you are looking for higher prices in the near term. If this pattern breaks down I would expect $1340 to be reached very quickly. Keep in mind gold it in a strong up trend still. Shorting is not the best play in my opinion. I prefer to see pullback which washes the market of weak positions then jump on the long side for another bounce/rally.
SP500 Market Internal Strength – 10min, 3 days chart The red indicator in the top chart and the red indicator levels on the charts below that help us time the market as to when profits should be taken or to tighten our stops if we have any long positions. The broad market is still in a very strong uptrend so moving stops up and buying on oversold dips is the way to play it.
Weekend Market Analysis Conclusion: The overall strength of the market (SP500 and Gold) I think are starting to weaken but in no way am I going to short them. We continue to buy dips until proven wrong because indicators can stay in the extreme overbought levels for a long period of time. Generally the biggest moves happen in the last 10-20% of the trend. If you would like to get these weekly reports and my trading tips book free be sure to visit my website: www.thegoldandoilguy.com/trade-money-emotions.php
|
| I think I just shi# my pants again. Posted: 12 Dec 2010 12:50 PM PST A south park-like youtube 'documentary' on the concentrated net short silver position. |
| Posted: 12 Dec 2010 11:53 AM PST --The year began with everyone worrying about bank failures. It's ending with everyone worried about whole nations failing, or at least national governments. And it's not just Greece we're talking about. It's the Big Kahuna of the global economy, the United States. And to their credit, it looks like Australia's politicians know this. --You could view last week's rise ten-year bond yields as a kind of global fire alarm for dollar-denominated assets. You saw a politically weak U.S. President and a weak-willed U.S. Congress both agree to do nothing about spending less money. The rise in U.S. bond yield s is a vote of no confidence in America's bonds. --It might not look like that today. In fact the U.S. dollar rallied on higher retail sales figures in America. If you thought the spike in bond yields would lead to a rapid dollar crisis, that's not going to happen. So what is? --This is an important point for understanding what Treasurer Wayne Swan is up to with his bank reforms. The U.S. government is set to borrow so much money in the next few years that it will crowd out other borrowers (corporates and governments) and drive interest rates up. If you want to borrow money and you're, say, an Australian bank trying to grow your balance sheet, you're going to have to find some other source of funding. --It's kind of like if you knew that it wasn't going to rain next year at all. Or, if all the rainfall went to irrigate one farmer's crops, and that farmer was not you. If you knew the drought was coming, you'd do everything you could to stockpile water now or find other people willing to sell you water. --All the big reforms announced by the Treasurer this weekend are aimed at keeping Australia's housing bubble alive and booming. First was another $4 billion in government money to buy residential mortgage backed securities (RMBS). This is how smaller lenders finance mortgage lending. It's a clever way to channel tax-payer money directly into housing prices (and bank profits). --But the big reform was the introduction of covered bonds. It's a story we wrote about late last month. On the surface, finding more local sources of lending looks good. If you know you're going to have trouble borrowing from abroad, why not borrow closer to home? --The trouble with covered bonds, in our view, is that it puts bond holders in line for depositor's money ahead of depositors. Of course this would only happen in the case of a bank failure. And that could only happen in Australia if, say, the housing market collapsed. And that could never happen. So maybe we're all worried over nothing. --And after all the government says it's going to look after depositors. They will now be covered by the Financial Claims Scheme. That little ripper was an outgrowth of the GFC and provides government-backed deposit insurance in the case of a bank failure. Depositors don't get wiped out, even if secured creditors and equity investors do. --But once you waft away the smoke you can see what's happened. The liability for paying back depositors has shifted from the banks to the government. You are the government. So now if a bank fails, you're going to have to pay out depositors. --The banks and the government will tell you that the guarantee is there to provide confidence in the banks. As such, it will never be needed because just having it will reassure people they can always get their money from the bank, even if the bank fails. But this just conceals an obvious trend: more and more of Australia's wealth is being tied up and invested in residential housing. --This is precisely what doomed economies in Spain, Ireland, and the United States. Yet the banks and the government are essentially doubling down on housing as a national investment priority/get rich quick scheme. Even if you were to argue that this is just prudent provisioning for a world where the cost of credit is going up, it's still a national gamble on rising housing prices. --All of the measures taken over the weekend aim to funnel more money into the housing market—from covered bonds to the RMBS program to steps which allow the flow of retirement funds into the mortgage market. The rigmarole about exit fees was just bread and circuses for the media and the masses. The real aim was to keep the money flowing to housing and keep the bubble going. --This is a clear winner for the banks. For banks to keep growing they have to keep lending. And since they already have so much of their loan book tied up in housing, even more housing loans grow the loan book AND support the assets already on the book. --And it's always a win if a bank engineers a deal where all the profits are private but all the losses are fobbed off on investors and the public. But just why Australia would increase the financialisation of its economy when that same policy is failing everywhere else on the planet...that's a real had scratcher. Dan Denning
|
| One Word of Advice For Those Playing the Australian Boom Posted: 12 Dec 2010 11:52 AM PST We should have more thoughts. But to tell you the truth, many of our thoughts went out of our head on our recent round-the-world trip. You need constant air pressure in order to maintain thoughts. And regular hours. Start getting up at midnight and going to bed at noon; thoughts have a way of disappearing by late afternoon. If they were ever there in the first place. One thought that disappeared somewhere over the pacific was this: The suntanned country must be close to getting burnt. Australia is booming. Prices are high. It cost $38 for breakfast in the Crown Towers hotel. Even so, you could have only one cup of café latte. You'd have to pay extra for another one. Our total bill for 3 nights was over $2,000. Impossible? Well, we thought so too. But when you throw in a bit of laundry...transfer from the airport...and breakfast for a friend, not to mention a consumption tax of $184, you end up over 2,000 bucks - without even a single dirty movie. The boom has been going on Down Under for the last 19 years. Not even the Great Correction is stopping it. Each year, it sells more dirt to Asia... from 40% of its exports 10 years ago to 72% today. It should probably just sell all of Western Australia to the Asians and be done with it. Meanwhile, the Ozzies enjoy their boom...raise their glasses...and throw raw meat on the barbie. Our colleague's house in Melbourne has risen 200% in price since we sent her there four years ago. And it's still going up. Converted shipping containers, transformed into mobile homes, sell for as much as $1 million. And truck drivers in the mining areas earn more than $100,000 a year. How long can this go on? We don't know. But our advice to our colleague was simple enough: "Sell!" *** From The Daily Bell:
*** And here's the Bloomberg report on the tax deal. As you will see, Congress will do "whatever it takes" to continue spending money it doesn't have, including ignoring a law it passed last February:
Regards, Bill Bonner.
|
| Technology is the Best “Inflation Trade” Posted: 12 Dec 2010 11:52 AM PST As you know, we are about a month out from the Federal Reserve's decision to pump additional funds into a slow US economy. Of course, this decision has been controversial. Many people think that it might ignite an inflation bomb. Couple this with the more recent bailout of Irish banks (and speculation about more euro dominoes about to fall) and lots of folks are pretty scared. For the long-term technology investor, however, I don't think it really matters. From an orbital perspective, these panics come and go. They always have. The technological arc of human history, however, can be seen to move in only one direction, and that is upward. Granted, over the short term, it might have some negative effect, but even that remains to be seen. Breakthrough technologies, however, are an excellent way to weather an inflationary storm. We could even call breakthrough technology the ultimate hedge against inflation. Microsoft, for example, was founded in 1975, when inflation averaged over 9%. Granted, it wasn't publicly traded back then, but there were private investors. Imagine what a dollar invested in Microsoft in 1975 would be worth today. Just since its IPO in 1986, the company has turned a (split-adjusted) share price of 10.1 cents into over $26. That is a gain of more than 26,000%. Even with the dollar losing about half of its purchasing power since 1986, that is still an inflation- adjusted gain of 13,000%. I can live with that. The point is that early investing in companies that will transform the market will beat any devaluation caused by inflation. What kinds of technologies transform the market? Essentially, what we look for in Technology Profits Confidential are transformational innovators that reduce costs by making things cheaper and better. This investment theme extends to a wide variety of fields, from agriculture, to alternative energy, to computers and semiconductor fabrication. In the medical field, too, emerging technologies are going to reduce the cost of existing therapies. At the core of everything is materials science. In this, all the fields are converging on the basic building block of matter itself - the atom. Of course, there is a double benefit in the case of breakthrough medicine, too. Even if the overall measurable economic cost of health care increases, there is an unmeasurable noneconomic windfall, and this is human life itself. Better therapies improve the quality and enjoyment of our lives, as well as extend them. It is difficult to attach a price tag to this, but isn't all economic activity ultimately reducible to improving life in some perceived way? The famous quote (erroneously attributed to Emerson) that applies here is: "Build a better mousetrap and the world will beat a path to your door." This remains true during good or hard times. All that "door traffic" is lucrative, since people reward things of value. Investors that acquire ownership positions in the builders of better mousetraps stand to reap hefty profits, whether in good times or bad. Just this week, for example, IBM's global research labs revealed a new semiconductor technology that combines current electronic computing technology with optical technology. Optical circuitry, also called photonics, uses pulses of light, instead of electrons, to work. Photonic circuit elements can accomplish the same tasks as electronic ones while being smaller and faster. Power consumption could also be reduced to a fraction of what an equivalent electronic computer requires. Called CMOS Integrated Silicon Nanophotonics, IBM's tech would increase the processing speeds of the fastest computers from petascale to exascale. Petascale computers, which are currently the world's fastest supercomputers, can execute instructions at the rate of multiple petaflops (a quadrillion floating point operations per second). For example, China's current record holder, Tianhe-1, can do slightly more than 2.5 petaflops. Exascale computers, on the other hand, would be 1,000 times faster than that. We've already seen photonics revolutionize telecommunications over the last several decades. If you are reading this alert online, the data was delivered to you via fiber-optic links over large segments of the delivery route. We wouldn't have the modern Internet without this early photonics application. Just as recently as last December, exascale supercomputers were not expected for another eight years. IBM, however, says that the new technology will enable it to up the ante and ship out the first exascale chips in five years. This advancement is partly because IBM has figured out how to build integrated electronic/photonic circuits using conventional fabrication technology. Both types of circuits can be built on a chip at the same time. The recent eight-year estimate may prove to be just another case of underestimating the acceleration of technological change! Regards, Ray Blanco, Editor's Notes: Ray Blanco advanced in robotics and avionics... genomics and biotechnology... And now he's combined his passion for technology with financial and stock market expertise. Ray is the co-editor of Technology Profits Confidential. Similar Posts: |
| Posted: 12 Dec 2010 11:45 AM PST Gold and Precious Metals Gold Bullion. 6 Month Price Chart. Super Force Gold Bullion Analysis: Gold has a solid Super Force Buy Signal as of Friday Nov. 12th.
"EU rescue costs start to threaten Germany itself The escalating debt crisis on the euro zone periphery is starting to contaminate the creditworthiness of Germany and the core states of monetary union"
Gold Bullion. One Year Price Chart:
Gold Bullion. Weekly Chart.
Gold Juniors – GDXJ Chart Super Force Gold Juniors Analysis.
"I invest in real assets, therefore I don't book losses!" Positions in the SF60 program can also be part of your Core Positions Portfolio. GDX- 9 Month Chart GDX. Massive Breakout On 3 Year Chart Super Force Gold Stocks Analysis:
Silver Chart#7
Short the leveraged S&P etf SSO Chart #8
Send me your email address to: alerts@superforcesignals.com and I'll be sure you are on my free signals hotlist! The SuperForce Proprietary SURGE index SIGNALS: 25 Surge Index Buy or 25 Surge Index Sell: Solid Power. Stay alert for our surge signals, sent by email to subscribers, for both the daily charts on Super Force Signals at www.superforcesignals.com and for the 60 minute charts at www.superforce60.com About Super Force Signals: Frank Johnson: Executive Editor, Macro Risk Manager. Email:
|
| A Gold Correction is an Option Posted: 12 Dec 2010 11:31 AM PST In the past few weeks I have made the case that gold might be nearing a correction. I understand that people get defensive regarding gold (no pun intended), but I do not think vulgarities should be expressed towards someone who is pointing out the overbought nature of the daily and weekly charts. It seems any time that I discuss a possible pullback in gold I place a giant target on my back for people to make nasty public comments or send me hateful emails which in some cases I find particularly amusing. To each his own, but something tells me this article will be as well received as an oral reading of the history of the Illuminati at a Christian Christmas celebration. Before you all rush to berate me for saying gold may go through a mild correction, read this paragraph before you take my work and my name through the proverbial mud . . . AGAIN. Before discussing why gold may go through a short-term correction, I would point out that in the long term I believe gold is in a secular uptrend that could last much longer than many market pundits or traders might prognosticate. I do not hold myself out to be an economist, but it appears to me that there are several catalysts looking towards the future that likely will give gold a boost. Unfortunately, the reasons gold could continue rallying are not economically pleasant and certainly not exciting to discuss as by now they have been beaten into our psyches. Instead of pounding the table about all of the various reasons investors should own gold, I am going to focus on a potential opportunity to buy gold at lower prices. Based on a variety of technical indicators and analysis paired with some fundamental opinions, a trader could make the case that gold is in need of a downward price correction. Gold has been purchased with strong volume for more than a year as a result of several reasons. When looking at a weekly chart of the gold ETF GLD it becomes apparent that the shiny metal is overbought and in need of a pullback, or at a minimum some healthy consolidation.
As can be seen above, gold remains in a strong uptrend and price is well above the 50 period moving average. In fact, the 50 period moving average on the weekly GLD chart has not been tested since April of 2009. The long term trend remains bullish, but as stated above stated above not needed here a pullback is possible. If we take a look at the GLD daily chart we notice the same long term uptrend that that is needless here we witnessed when looking at the weekly chart. In contrast the daily chart does show potentially bearish formations beginning to work. While the bearish formations patterns, too close previous use of formations may fail or may turn out to be totally false why totally, just use false, it is strong enough on its own based on future price action, at this point a double top formation is possible as is a head and shoulders pattern. This is not to say that GLD cannot grind higher because the weekly chart looks quite strong, but the daily chart is at least posting a warning that lower prices or at least a period of consolidation may be coming to fruition in the not-so-distant future.
While I am expecting a meaningful pullback or correction at some point, I do not believe that gold is going to crash lower. In fact, I am viewing the possible correction in gold as an excellent potential long entry. Clearly traders could look to purchase GLD around the 50 period moving average on the daily chart ($133.06) and then add to the position if the neckline is tested. I do not believe that price will get to the neckline, but if it does I expect that level to hold and a new rally to take shape. Until gold gets below the 50 period moving average on the weekly chart, it remains in a technically constructive uptrend. There are a variety of ways to purchase GLD if an equity trader wanted to leg into the trade at a variety of price targets. One strategy would be to simply accumulate partial positions at predetermined price targets. When considering entering a longer term position, investors and traders should formulate a plan and then trade that plan. Through the use of a trading plan, the trader can remove emotion from the subsequent purchase(s) while managing risk. For those who would like to use options to acquire GLD common stock, the easiest strategy would be to sell cash secured naked puts. Secured naked puts do not require significant option trading experience and most option brokers will allow relatively inexperienced option traders to use this strategy. Each option contract represents 100 shares of GLD, so the trader sets aside a portion of his trading capital to purchase 100 shares of the underlying. As a basic example, if a trader sold a cash secured January 133 put the trader would be required to have the appropriate cash in the account to purchase 100 shares of GLD at $133/share. So in order to have the put totally secured, the trader in this example would need $13,300 to fulfill the required capital obligation. For a more speculative trader that was looking to collect option premium based solely on time decay (Theta) and had no intention of owning common stock, margin encumbrance would be required. Most option brokers will demand that option traders be able to post 15-20% of the total obligation (Reg T) and will allow more experienced option traders to use margin in order to cover the remaining portion. Traders using portfolio margin can use this strategy to add income to their portfolio without tying up a significant portion of their trading capital. Based on the weekly chart listed above, the target support areas are around $133/share and $130/share respectively. We will assume the trader wanted to purchase 100 shares at each price point. The trader in this example could sell 1 GLD January 133 Put and 1 GLD January 130 Put. Based on current prices, the trader would receive a credit of $235 for the GLD January 133 Put and a credit of $139 for the GLD January 130 put. Total credit on this trade would be around $374 not including commissions. If GLD does not sell off and continues to rally, the trader has the potential to collect a large portion of option premium from the two cash secured puts that he sold. In this case, the maximum gain would be the total credit received of $374 at expiration if the trader did not get assigned GLD common stock. It is critically important to understand that there is significant risk in this trade as the theoretical loss would be over $26,000 assuming that GLD were to go to 0 and the trader did not close out the position. Clearly gold is not likely to be worthless, and the odds of losing $26,000 are slim to none however it is theoretically possible. If the trader in the example gets assigned the stock he still gets to keep the option premium for which he sold the puts for which was $374. Since he was purchasing 200 shares of GLD, his total cost would be reduced by $1.87 a share (374 / 200 = 1.87). The average price he would pay for 200 shares of stock would be $131.50/share (133+130 / 2 = 131.50), thus his actual price per share would be $129.63 (131.50 – 1.87 = 129.63). The profit engine for the naked puts is time decay (Theta). Volatility and price risk exist and would become reality if a massive overnight sell off in gold took place. However, if the trade operated as is custom in traditional market conditions the option trader in this case either will earn a portion or potentially all of the premium he received for selling the puts or he will be assigned 200 shares of GLD with a total basis of $129.63. If the trader wishes to own 200 shares of GLD and has the capital to purchase the common stock, this is an excellent way to develop a trading plan that takes advantage of support levels and remains profitable if GLD continues higher. If you would like to receive my Free Options Strategy Guide & Trade Ideas join my free newsletter: http://www.OptionsTradingSignals.com/profitable-options-solutions.php J.W Jones
|
| Gold’s Gleam Will Not Fade Away Because of the Current Decline Posted: 12 Dec 2010 11:29 AM PST
This essay is based on the Premium Update posted on December 10th, 2010 We picked up the Asian addition of The Wall Street Journal this week and on the back page was an article titled "China reveals Huge Appetite for Gold." The article states: Gold's record rally has been attributed to everything from worries about inflation, the dollar and the emergence of exchange-traded funds. One big factor many may have missed: huge buying from China. We haven't missed it. We have been writing about the rising Chinese demand for gold in many previous updates. It used to be that America was the New World and Europe was Old. Now they both look frayed around the edges and the New World label seems to belong to China and other emerging market economies. This new growth has been accompanied by a voracious appetite for the yellow metal. Data cited last week by China's state-run Xinhua news agency showed that China imported 209.7 metric tons of gold in the first 10 months of the year, a fivefold increase compared with the same period last year. This is interesting. China is now the world's biggest producer of gold and consumes all its own production. China's booming mining industry produced 277 metric tons of gold so far this year, up 8.8% from the same period last year. This means that in addition to buying up everything from local production, they are also importing a hefty chunk for a total of at least 486 metric tons so far. Without a doubt, a good portion of this gold is finding its way into the vaults of the People's Bank of China gold reserves. Keep in mind that in April 2009 the People's Bank of China announced that it had added 400 tons to its reserves for a total of 1,054 metric tons making China the world's fifth-largest holder of gold, just ahead of Switzerland, and among the six nations plus the International Monetary Fund that have reserves of more than 1,000 metric tons. Over the past several years, China's money supply expanded by over 50%, due to a massive lending boom that helped generate record GDP growth. That boils down to a lot renminbis searching for somewhere to go. The Chinese are just as worried about inflation and the erosion of the value of paper money as the rest of us. They have been looking for tangible safe investments in which to park their cash. Their problem is that as individuals they are limited in where they can invest. Capital controls restrict investment opportunities for individuals abroad. In China they can place it in a standard bank account and receive a negative rate of return, given an inflation rate running at about 3%. They can also invest in the stock market, but Chinese equities are much more volatile than those in developed markets, so that carries some risk. That leaves real estate, gold and other tangible assets. Two things happened at about the same time recently. On the one hand the real estate market was beginning to look like a bubble and the government made all out efforts to slow it down, and on the other hand, the gold market opened up for Chinese citizens. The WSJ notes that up until a few years ago China's gold market was strictly controlled by the central bank, which bought all the gold mined domestically and then sold it to jewelry makers. Recently, the government loosened restrictions on buying, both by individual and institutional investors. Just this August China began allowing more banks to import and export gold, opening up the gold market to the institutions and their clients. Last week the Chinese approved the country's first gold fund designed to invest in overseas listed gold ETFs. This year many Chinese investors added gold to their portfolio and at the Shanghai Gold Exchange, trading volume rose 43% to 5,014 tons in the first 10 months of 2010. The major trends in any market are caused by changes in the fundamentals, and since we have just seen an improvement in the latter, let's see if the long-term charts reflect that (charts courtesy by http://stockcharts.com.) They do. The very-long-term chart that you can see above features the ratio of gold to corporate bonds. Here, we clearly see the distinction between long-term consolidation and long-term rallies. Once a consolidation has concluded, the breakout is generally quick and sharp to the upside. Of course, the rallies in the ratio correspond to the major rallies in gold itself, which is why it is important to analyze it today. We have seen the aforementioned rallies on two occasions both in 2005-2006 and again in 2007-2008. Based on prior trends, if this ratio breaks out above the resistance line, a bigger rally is likely to be seen. It appears that we are in such a situation today. There is a strong likelihood that once the consolidation is over gold may very well rise to the $1,600 level. Whether or not it's going to take place right away is a different story. Please take a look below for details. Zooming in slightly provides us with an estimate of the probable downside target level if the decline is to continue. Based on recent price movement and historical trends, a decline here could possibly be seen to the $128 level. This would correspond to a spot gold price close to the $1,300 level. Zooming further allows us to see that several support levels have together stopped a recent decline. This could be interesting phenomenon to those, who still doubt the usefulness of the analysis charts from the technical perspective. Volume levels have been higher on the downside and since the recent decline was quite small, it seems appropriate to wait for additional signals before any bullish sentiment surfaces. There's more to the analysis of volume than the above statement (available in the full version of this essay), but the main point remains unchanged. Meanwhile, let's move to the analysis of the ratio that should be included in the arsenal of every Gold and Silver Trader – specifically because of its accuracy in predicting local tops. The GDX:SPY is a measure of mining stocks performance relative to all other stocks. We have previously discussed the unique single spike in volume signal as one, which has been extremely reliable in finding local tops in the past. In last week's Premium Update, we wrote about not seeing the single spike in this ratio. It did not appear that the local top was in. Soon after that, however, such a spike in volume was indeed seen, and a local top emerged. Volume levels have been emphasized in the above chart. The high volume levels, which are noted by arrows, are very closely aligned with local tops. This is a clear indication of the importance of volume levels analysis with respect to prices. The suggestion here is for further weakness in the near-term. Summing up, the major trend appears to be up, and it may not be long before the massive rally resumes. Still, in the short run, a corrective phase is still not out of the question. Should it materialize, it should be viewed as an opportunity to add to one's gold and silver investments. To make sure that you are notified once the new features are implemented, and get immediate access to my free thoughts on the market, including information not available publicly, I urge you to sign up for my free e-mail list. Sign up today and you'll also get free, 7-day access to the Premium Sections on my website, including valuable tools and charts dedicated to serious PM Investors and Speculators. It's free and you may unsubscribe at any time. Thank you for reading. Have a great and profitable week! P. Radomski * * * * * Interested in increasing your profits in the PM sector? Want to know which stocks to buy? Would you like to improve your risk/reward ratio? Sunshine Profits provides professional support for precious metals Investors and Traders. Apart from weekly Premium Updates and quick Market Alerts, members of the Sunshine Profits' Premium Service gain access to Charts, Tools and Key Principles sections. Click the following link to find out how many benefits this means to you. Naturally, you may browse the sample version and easily sing-up for a free weekly trial to see if the Premium Service meets your expectations. All essays, research and information found above represent analyses and opinions of Mr. Radomski and Sunshine Profits' associates only. As such, it may prove wrong and be a subject to change without notice. Opinions and analyses were based on data available to authors of respective essays at the time of writing. Although the information provided above is based on careful research and sources that are believed to be accurate, Mr. Radomski and his associates do not guarantee the accuracy or thoroughness of the data or information reported. The opinions published above belong to Mr. Radomski or respective associates and are neither an offer nor a recommendation to purchase or sell securities. Mr. Radomski is not a Registered Securities Advisor. Mr. Radomski does not recommend services, products, business or investment in any company mentioned in any of his essays or reports. Materials published above have been prepared for your private use and their sole purpose is to educate readers about various investments. By reading Mr. Radomski's essays or reports you fully agree that he will not be held responsible or liable for any decisions you make regarding any information provided in these essays or reports. Investing, trading and speculation in any financial markets may involve high risk of loss. We strongly advise that you consult a certified investment advisor and we encourage you to do your own research before making any investment decision. Mr. Radomski, Sunshine Profits' employees and affiliates as well as members of their families may have a short or long position in any securities, including those mentioned in any of the reports or essays, and may make additional purchases and/or sales of those securities without notice.
|
| Posted: 12 Dec 2010 11:27 AM PST 
Nobody knows for certain how large the worldwide derivatives market is, but most estimates usually put the notional value of the worldwide derivatives market somewhere over a quadrillion dollars. If that is accurate, that means that the worldwide derivatives market is 20 times larger than the GDP of the entire world. It is hard to even conceive of 1,000,000,000,000,000 dollars. Counting at one dollar per second, it would take you 32 million years to count to one quadrillion. So who controls this unbelievably gigantic financial casino? Would it surprise you to learn that it is the big international banks that control it? The New York Times has just published an article entitled "A Secretive Banking Elite Rules Trading in Derivatives". Shockingly, the most important newspaper in the United States has exposed the steel-fisted control that the big Wall Street banks exert over the trading of derivatives. Just consider the following excerpt from the article....
Does that sound shady or what? In fact, it wouldn't be stretching things to say that these meetings sound very much like a "conspiracy". The New York Times even named several of the Wall Street banks involved: JPMorgan Chase, Goldman Sachs, Morgan Stanley, Bank of America and Citigroup. Why does it seem like all financial roads eventually lead back to these monolithic financial institutions? The highly touted "Wall Street reform" law that was recently passed will implement some very small changes in how derivatives are traded, but these giant Wall Street banks are pushing back hard against even those very small changes as the article in The New York Times noted....
So why should we be so concerned about all of this? Well, because the truth is that derivatives could end up crashing the entire global financial system. In fact, the danger that we face from derivatives is so great that Warren Buffet once referred to them as "financial weapons of mass destruction". In a previous article, I described how derivatives played a central role in almost collapsing insurance giant AIG during the recent financial crisis....
As the recent debate over Wall Street reform demonstrated, the sad reality is that the U.S. Congress is never going to step in and seriously regulate derivatives. That means that a quadrillion dollar derivatives bubble is going to perpetually hang over the U.S. economy until the day that it inevitably bursts. Once it does, there will not be enough money in the entire world to fix it. Meanwhile, the big international banks will continue to run the largest casino that the world has ever seen. Trillions of dollars will continue to spin around at an increasingly dizzying pace until the day when a disruption to the global economy comes along that is serious enough to crash the entire thing. The worldwide derivatives market is based primarily on credit and it is approximately ten times larger than it was back in the late 90s. There has never been anything quite like it in the history of the world. So what in the world is going to happen when this thing implodes? Are U.S. taxpayers going to be expected to pick up the pieces once again? Is the Federal Reserve just going to zap tens of trillions or hundreds of trillions of dollars into existence to bail everyone out? If you want one sign to watch for that will indicate when an economic collapse is really starting to happen, then watch the derivatives market. When derivatives implode it will be time to duck and cover. A really bad derivatives crash would essentially be similar to dropping a nuke on the entire global financial system. Let us hope that it does not happen any time soon, but let us also be ready for when it does. |
| Posted: 12 Dec 2010 11:25 AM PST  12/11/2010 Summary www.simplyprofits.org Disclosure
|
| Charting The US Fiscal Catastrophe Posted: 12 Dec 2010 10:46 AM PST With little fanfare, the November budget deficit of $150.4 billion was reported, which happened to be the worst fiscal November in the history of the US, and just out of the top 10 of worst deficit months ever, including the traditionally weak seasonal months of December, April and September (indicatively, the worst deficit month was the February 2010 $221 billion). The deficit was a major surprise to all those who had expected a pick up in income tax revenues. And as the charts below demonstrate, while there was indeed a modest pick up in tax collections, it was nowhere near enough to offset the surge in government outlays (even with interest payments still at near record low levels). What was also not broadly appreciated is that the cumulative debt issuance over deficit funding has hit a new all time high of $1,735 billion since our October 2006 starting point (4 fiscal years ago). And what is a bigger concern, is that the debt issuance continues to remain at almost exactly 50% over the deficit. Additionally we know that courtesy of Obama's latest stimulus for the wealthy (and everyone else) the latest projection for the 2011 budget deficit will hit $1.5 trillion (after it was just $1.1 trillion a few months prior). What this means is that should the US Treasury continue to issue 50% more debt than total deficit needs, by the end of fiscal 2011, the US will have issued another roughly $2.25 trillion in net debt. Granted this is a rule of thumb. But what it means is that the $900 billion in notional (not market) value of bonds to be bought back by the Fed through June will be woefully insufficient, and that as a result we expect that Ben Bernanke will be forced to monetize another $1.2 trillion in debt to continue with his course of monetizing every dollar of deficit spending, as he has been doing since the advent of QE2. It also means that unless something dramatically changes, through October 31, 2011, total US debt will be $15.9 trillion, up from the $13.9 trillion as of the end of last month, and will mean that the debt ceiling will have to be raised not only once, but likely twice in the next 12 months. We are now truly a banana republic you can believe in. Chart 1: Cumulative US Individual Income tax revenues and debt issuance. Since the failure of Lehman, through November 30, 2010, the US government has issued $3.8 trillion in debt, and collected $3.6 trillion in tax receipts. Uncle Sam continues to fund over 100% of every dollar received from taxes with his own credit card, which is somehow still stuck at an APR of about 2%.
Chart 2: The same as above, but also showing the cumulative differential between the two metrics. We fail to observe any green shoots, or any improvement in the cumulative delta.
Chart 3: While the debt to tax collection metric is deplorable, what is far more scarier, and has very profound implications for future US debt, is that the cumulative debt over deficit differential not only continues to rise, but has hit an all time high. Forgive us if we laugh in the faces of all those who claim that rising tax revenues are a certain indication of economic improvement. Nothing could be further from the truth: the only "improvement" is short-term economic stimulus (with an ever declining half life), purchased on Uncle Sam's credit card. Should the recent acceleration in interest rates higher persist, we expect that very soon the Uncle Sugar APR will no longer be quite as attractive as it has been during this period of drunken sailor borrowing.
And if you are not scared enough by the above figures, here is Bill Buckler of the Privateer fame's condemnation of what anyone with half a brain realizes is pure, unadulterated fiscal lunacy (dictated in no small part by the same people at Goldman who are now in charge of monetary policy as well):
That is the 64 quadrillion dollar question.
|
| Metals May Continue to Decline on Yields Posted: 12 Dec 2010 10:00 AM PST Gold fell 2% last week after US Treasury yields spiked almost 50 basis points. It is unlikely that yields will continue to rise so rapidly and it will be interesting to see whether gold continues to decline if yields merely maintain their new levels. |
| Posted: 12 Dec 2010 10:00 AM PST Now we know why silver dove from $30.60 to $28 in recent days, and gold backtracked from $1,430 to $1,374. |
| Gold & Overall Strength of the Market Posted: 12 Dec 2010 10:00 AM PST When we see a higher high getting sold into with big volume it typically means the big money is unloading large positions into the surge of breakout traders and short covering that occurs when a new high is reached. |
| Posted: 12 Dec 2010 08:37 AM PST HOUSTON – After first marking new highs on COT reporting Tuesday, both gold and silver seemed to be taking an overdue breather this week. Yearend profit taking seems dominant, and we think more vigorous profit taking might surface right after the new tax year begins. However, that is likely balanced by wealth seeking safe harbor from under-backed, highly volatile and competitively devalued fiat currencies. Sovereign debt and solvency issues are serious, currently in focus in Europe but our indicators are not reflecting the kind of warning that usually comes with irrational fear or panic about contagion – yet. |
| Oh Sh*t, here's a contrary indicator for gold Posted: 12 Dec 2010 07:59 AM PST Dave has left Kansas and is now following the yellow-brick road. :thumb.aspx:  Why Dave Is Now a Goldbug By DAVE KANSAS Want to get an investment debate started? Start talking about gold. The scrum surrounding the yellow metal ranges from those who deride it as an archaic investment ("a barbarous relic!") to those who believe it is the essential store of value through the ages (goldbugs). Gold elicits passion in a way that 100 shares of Consolidated Edison never could. Today, with gold seemingly riding high -- it hit records again this past week -- it might surprise that the bull case still has a lot of merit. Late last year, I was among the deriders, warning people to steer clear of gold. That was way back at $1,000 an ounce. Today gold trades at around $1,400 an ounce, a sweet 40% gain. (It closed last week at $1,384.) In the spring, I tried to claw back into the game with an apology for my prior naysaying. I warned of volatility and risk and said things looked a bit manic but manias can last a long time. All that still holds true. As an individual investor, plunking all your savings into any single thing, whether it be gold or a stock, is always unadvisedly risky. So, while I like a lot of the fundamentals around gold, a smart portfolio includes a diverse array of assets. Indeed, commodities, of which gold is a star player, should probably make up between 5% and 15% of your long-term investment mix. Commodities provide two basic things over time: diversification away from stocks and a hedge against inflation. With those items out of the way, let's look at the five themes supporting gold's rise: Quantitative easing: The Federal Reserve is spending $600 billion through next summer in a bond-buying program, and Chairman Ben Bernanke says he'll spend even more if required. The QE program is widely expected to weaken the dollar. All things being equal, one needs more of a weaker currency to buy the same commodity, such as gold. Goldman Sachs cites the Fed's QE program as driving gold to $1,670 an ounce in 2011. Euro-zone contretemps: Greece and Ireland have run aground, Portugal is next in line and leading lights in Germany are talking about abandoning the 16-nation common currency. The euro is, to use a precise economic term, a mess. And it's expected to remain a mess well into 2011. Gold as a "safe" investment benefits from currency turmoil (and other matters of fear and darkness). Last week, European finance ministers met to discuss a "big fix" for the euro. The result of the meeting: nothing. Small wonder gold shot higher. China: Indian citizens famously buy a lot of gold in the form of jewelry, often as a way to protect savings against inflation. Now it seems that the Chinese are starting to behave in a similar manner as inflation starts to ramp higher there. The head of the Shanghai Gold Exchange recently told a conference that China had imported 209.7 metric tons of gold through October, compared with 45 tons for all of 2009. That is a huge jump, partly driven by fears of inflation in China. India is still king -- according to The Wall Street Journal, India will import 700 tons of gold this year, up 46% from 2009. Put those two together and that's a lot of demand. Global debt: In the wake of the financial crisis, many countries have huge deficits, including the U.S. A common view is that governments will be sorely tempted to "inflate" the debt away. That fear of inflation drives people to gold since it's considered a safe store of value. Gold standard: Currencies used to have the backing of gold. If you took a note to the government, you could get gold (or silver) in return. But relatively recently, governments decided to abandon gold and instead issue "fiat" currency. Today, a dollar can be exchanged...for a dollar. With the advent of fiat currencies, the idea of holding gold seemed quaint. The U.K. sold half of its gold reserves from 1999 to 2002. More recently, however, the head of the World Bank wondered aloud if gold should play some role in a reorganized global financial system. With so much currency volatility, gold as a store of value and backer of government money is getting more attention than possible just a few years ago. Along with these themes, it's important to bear in mind that gold, adjusted for inflation, is well off its record high. That would be more than $2,300 an ounce -- in today's dollars, the level gold reached back during the last gold surge, which came at the end of the stagflation 1970s. And an ounce of gold is, according to legend, supposed to pay for a gentleman's tailored suit. In London, Saville Row bespoke suits start around $5,000. While gold's strong run has increased the number of skeptics, its sprint pales next to its poor cousin. Silver has gained more than 50% since August. Now that's a scary move. —Dave Kansas is European markets editor for The Journal in London. Email: dave.kansas@wsj.com http://online.wsj.com/article/SB1000...696048262.html |
| Weekender: The Von Mises Prophecy Explained Posted: 12 Dec 2010 05:55 AM PST
In short, while believing the Austrian school to be more or less correct — especially in respect to human nature — when it comes to real world implications (and trading decisions), there is a human psychology standoff that involves a time element. The Keynesian approach — which advocates government stepping into the breach — essentially overlooks the corrupt, inefficient nature of public policy, and also promises something for nothing. But people like promises of something for nothing… that's practically a foundational principle of politics… and persistent delusions can go on for a very long time. To put it another way, the market can be like an emotional spouse: For extended periods of time, "facts" don't matter so much as "feelings." Keynesians call these feelings "animal spirits," and there have been entire books (by Keynesian acolytes) on how important it is to revive animal spirits for the sake of the economy.
In capturing the tendency of markets to doggedly embrace Keynesianism — even when such a track seems delusional — Emanuel Derman nails it in his book My Life as a Quant:
To wit: In the same way that you can't "win" an argument with your overly emotional wife (or husband), nor can you "win" an argument with a persistently delusion-embracing market. Except, of course, by 1) going with the flow in the near term, and 2) waiting for the longer-term "facts" to actually pan out… The Von Mises Prophecy Despite very long interims, reality (and gravity) tends to eventually reassert itself. This is why the Austrian school will always have relevance. In that respect, there is something I think of as "the Von Mises prophecy," which is a sort of one paragraph summation of Austrian thought — anchored to a prediction — as put forth by Ludwig Von Mises himself:
The Von Mises prophecy can further be understood in the context of "exploding debt dynamics" (a highly useful term coined by an IMF staffer). To wit, your debt dynamics become explosive when debt service costs overtake your ability to arrange new financing. "A rolling loan gathers no loss," as the Wall Street wags say, but once that loan stops rolling? Game over man.
As credit expands, more and more unproductive debt is taken on in pursuit of marginal return investments. This process can play out over years, or even decades (as we have seen in the U.S. via a 25-year leverage and debt supercycle). The prophecy's "final and total catastrophe of the currency system" comes from last ditch emergency measures taken to forestall a debt mountain avalanche. An economy that is lightly (reasonably) leveraged can handle a slowdown without imploding. An economy that is leveraged to its eyeballs cannot. A catch-22 is thus created, in which the taking on of excess leverage requires the application of even more leverage (via the authorities) to save the system from itself. This feedback loop is, of course, unsustainable, barring the economy's ability to "grow its way out" of the problem. So the process by which the Von Mises prophecy is fulfilled can be generalized like this:
The "Von Mises prophecy" as described above is now in full swing in the United States and Europe, and coming to potentially spectacular fruition in Japan.  While there is heavy emphasis on the Fed and the $USD, the eurozone's sovereign debt crisis is perhaps an even clearer example of the "mountain of debt" phenomenon. Over a period of many years the peripheral eurozone countries were allowed to spend borrowed funds (on a borrowed credit rating) they could never pay back. Now there will prove no final option in saving the eurozone other than monetizing that debt (i.e. the ECB will eventually have to disavow its Bundesbank roots and print, taking up local debt issuances with fiat paper and massively devaluing the euro). The United States too, of course, is on a similar path. This is why bond yields have been rising, not falling, even as the Bernanke Fed has promised to keep bond yields low. As we wrote in the 12-2 Global Macro Notes:
Delayed Payback The dynamics of the Von Mises prophecy also help clarify why we have rough waters ahead. The problems of the "debt mountain" have not been dealt with — which means they will continue to press in future. Understand that the majority of market participants (as represented by CNBC and the like) do not actually understand economics. Worse still, they do not actually CARE about understanding economics. This reality is what makes it all too easy for misplaced optimism to take hold amid the crowd (with talking heads and banking house strategists cheering it on). When one's entire focus is on seeing "green shoots," and one's psychological orientation is towards justifying optimism whenever possible (rather than developing as realistic a worldview as possible), every extended period of temporary Keynesian relief becomes reason to believe that all is coming up roses and the worst is passed. Are the Bond Vigilantes Returning?
Above is a chart of 30 year t-bond interest rates, dating back to the mid-1990s. Though the actual trend goes back farther, you can see the key point illustrated here — interest rates have been falling for decades. The aberrational low point came at the height of the 2008 financial crisis, when seemingly the whole world piled into U.S. treasury bonds. In respect to this long, long trend, Fall 2010 represents a potential inflection point of great magnitude. Why? Because this is when two things happened:
In short: The bond vigilantes, long in Rip Van Winkle slumber, may now be waking up. The Von Mises prophecy, remember, involves panic fears of being crushed under a mountain of long-accumulated debt. As the authorities seek to alleviate presssure by monetizing that debt (turning it into paper currency), faith in the system on the whole (currency and debt) is eroded, and investor preference for holding said debt (or currency) shifts at the margins in favor of something else. There are, of course, other explanations for why bonds are falling (and rates rising) in the face of the Fed. Optimistic bulls will argue that rising rates are a function of a U.S. economy returning to health, and may go even further in arguing that rising rates will not derail a sustainable recovery. That is one possible interpretation of the future path. Another is that:
Of course, with all three of the major currencies ($USD, euro, yen) in various stages of this same cycle — just wait until Japan hits a loss of faith patch! — it's little wonder that forex forecasters are calling for "Super Volatility" in 2011. It's a great time to be a trader… JS |


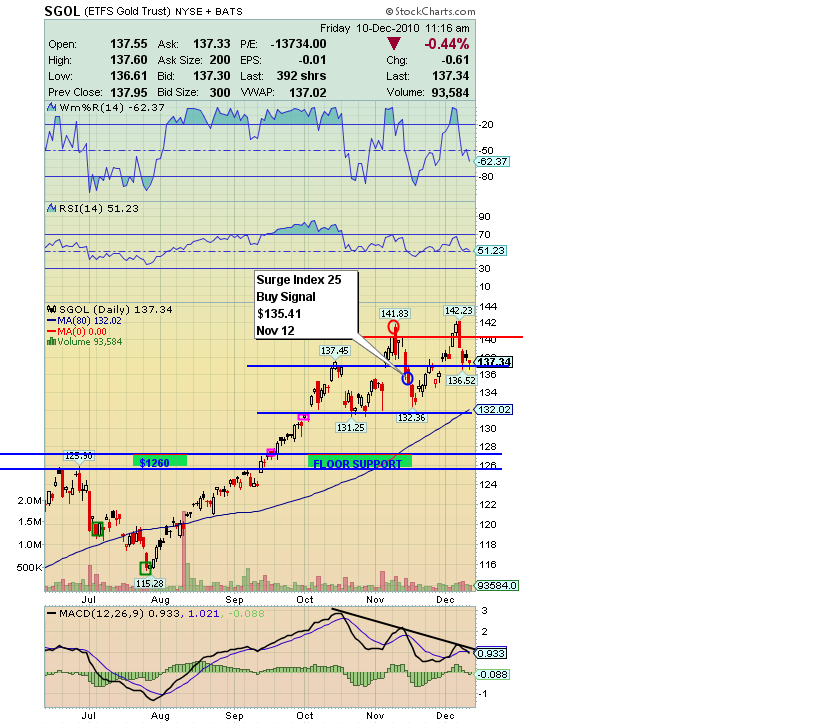
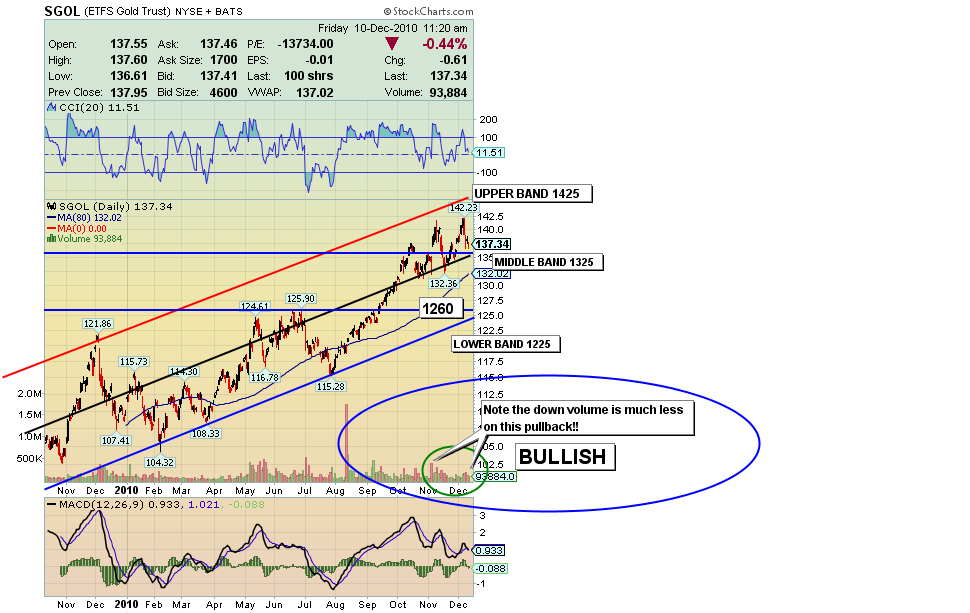
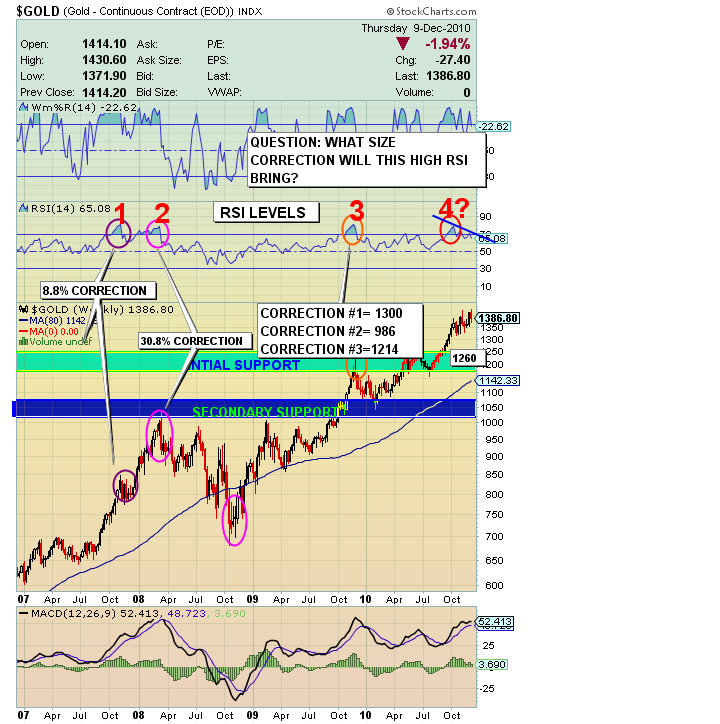
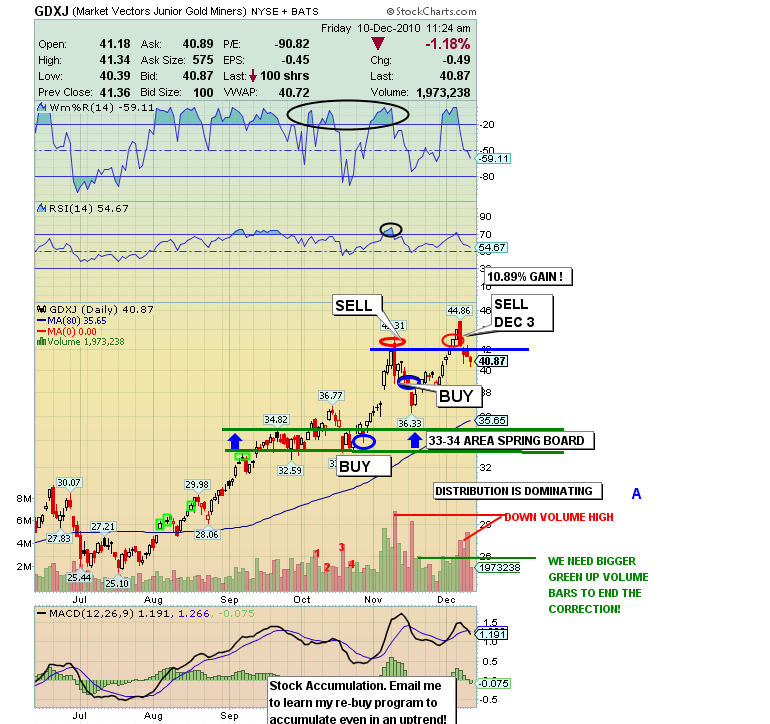
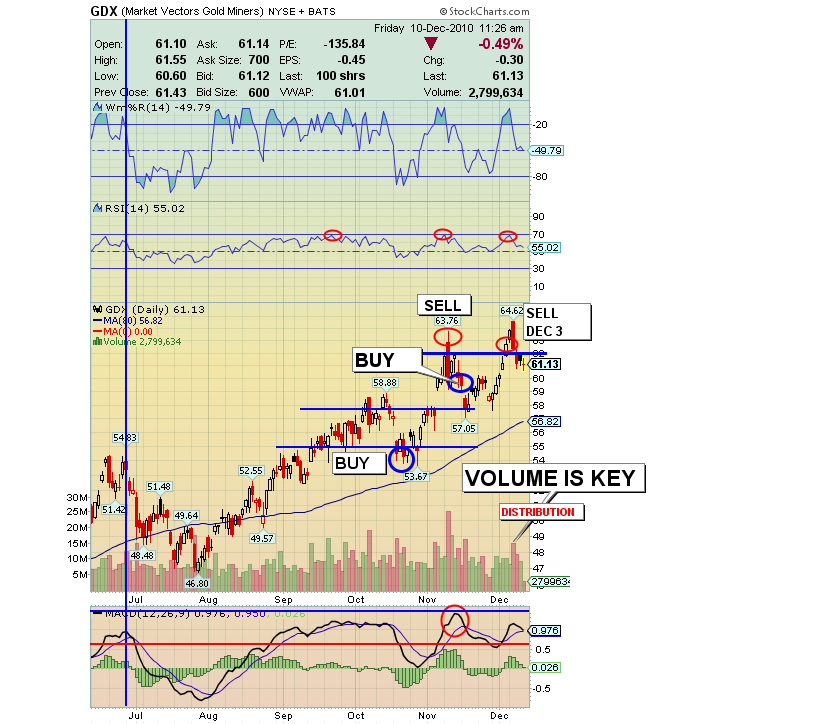
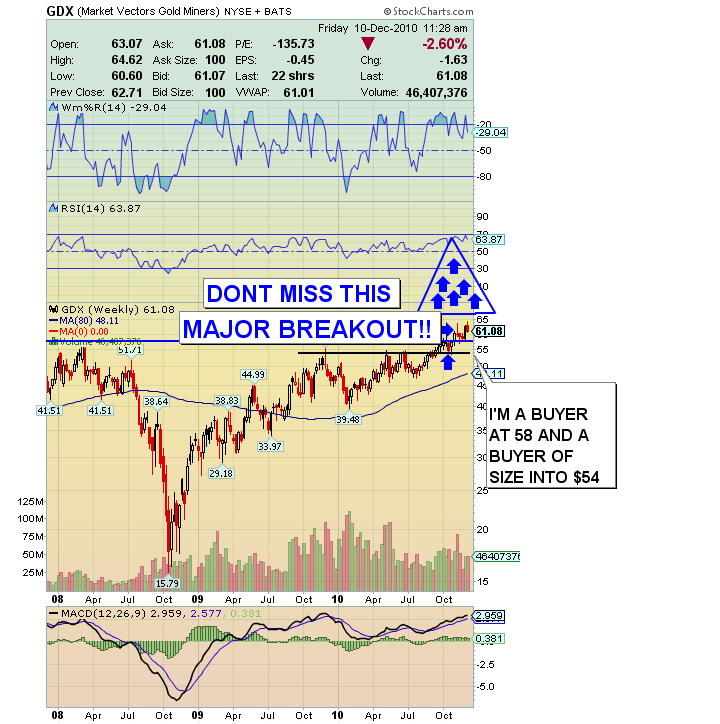
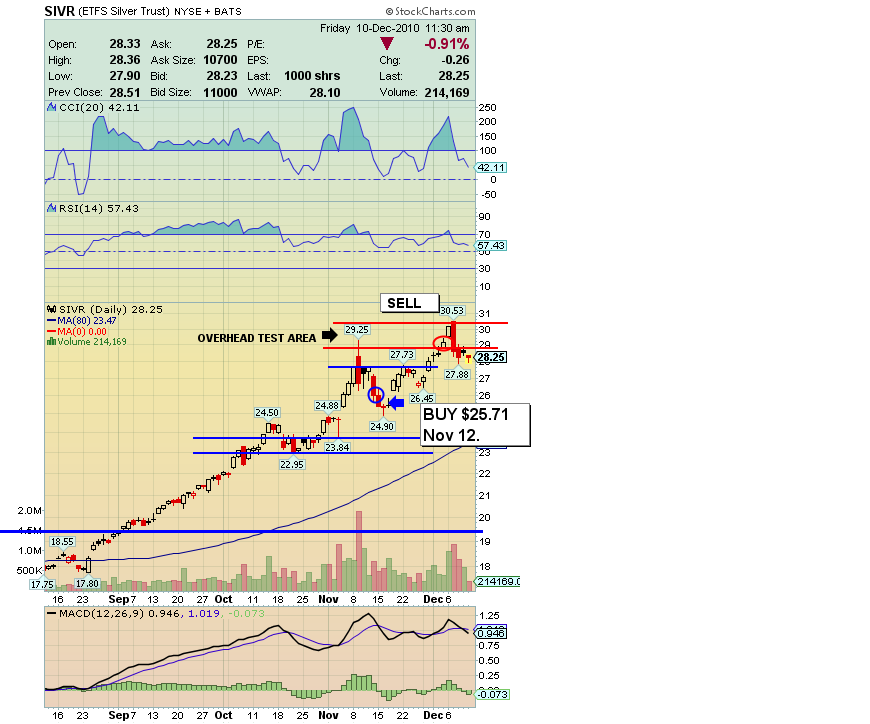
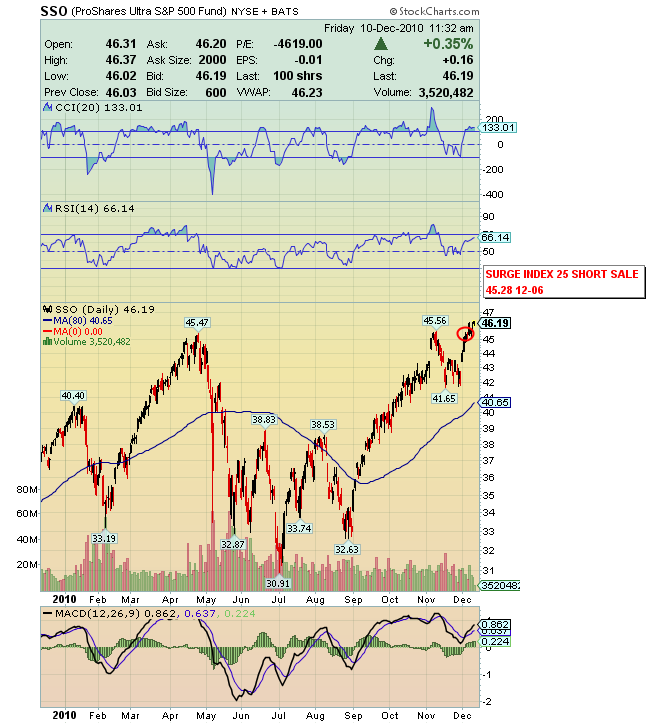


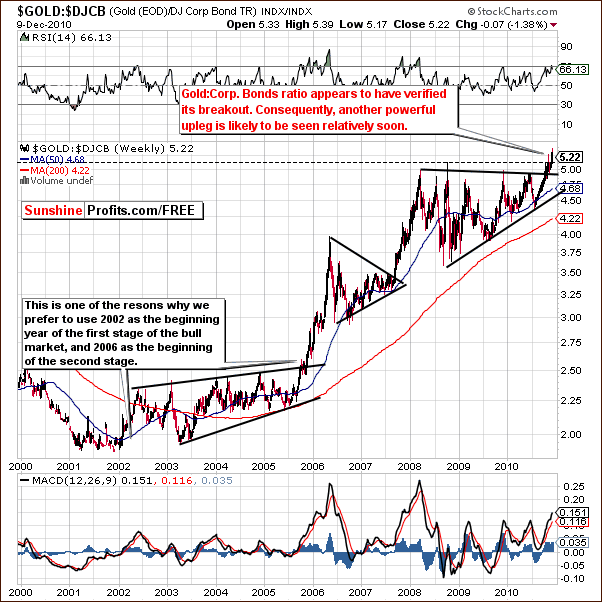
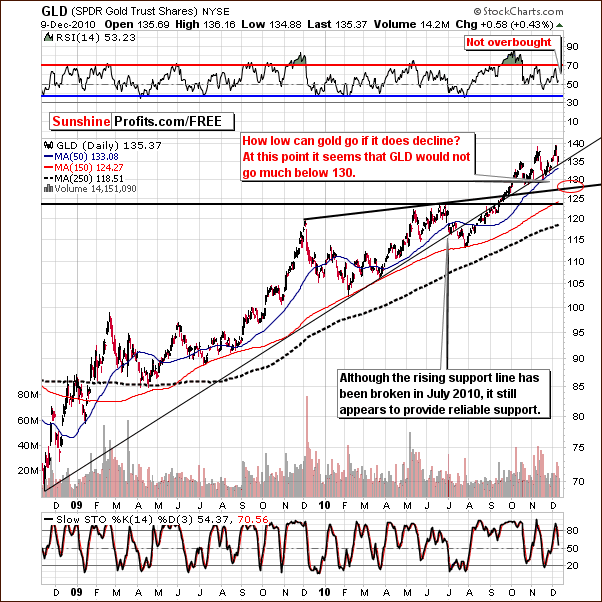
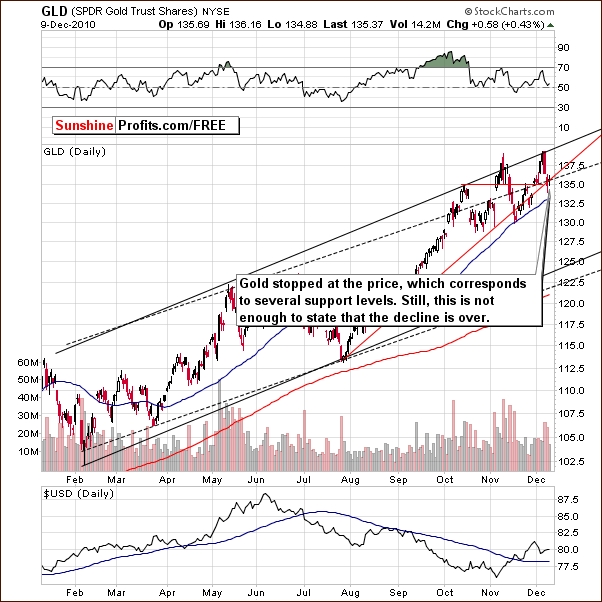
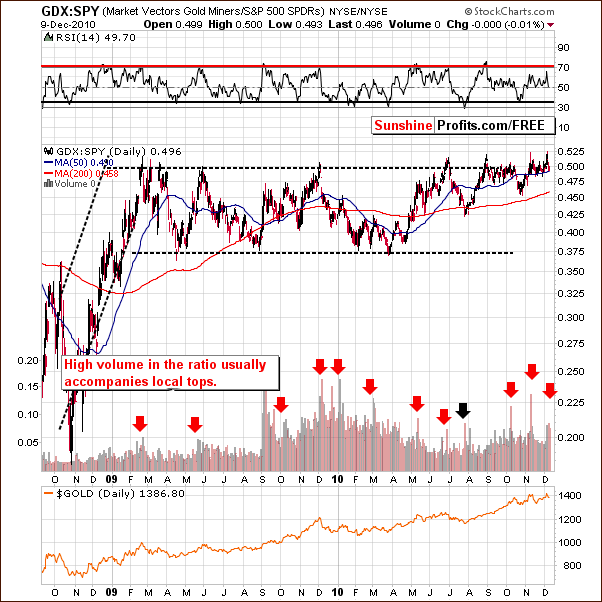


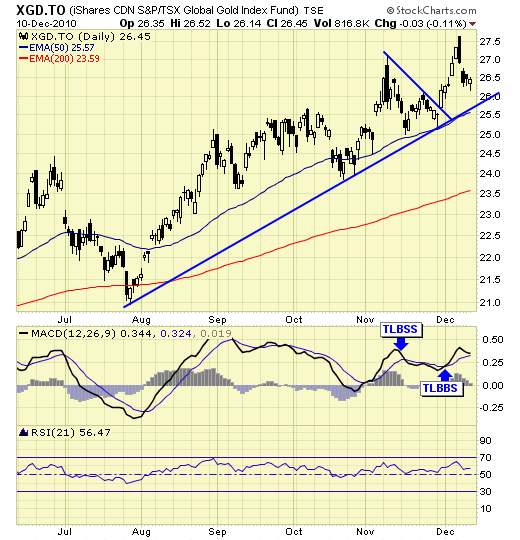


 In
In  The "boom expansion brought about by credit expansion" Von Mises refers to sits atop a mass pyramid scheme of leverage and debt.
| You are subscribed to email updates from Gold World News Flash 2 To stop receiving these emails, you may unsubscribe now. | Email delivery powered by Google |
| Google Inc., 20 West Kinzie, Chicago IL USA 60610 | |
No comments:
Post a Comment