


Gold World News Flash |

- Gold Seeker Closing Report: Gold and Silver Rise with the Dollar While Stocks and Bonds Fall
- Sell in May and Go Away, Will the Summer Doldrums knock the gold price?
- Daily Dispatch: We Have Nothing Left to Fear
- Ten Topics on Silver
- Doug Groh: Holding Gold
- Momentum Reversal, Guru’s Fears, Gold Demand, Housing Horrors and More!
- Got Gold Report – Caution Flags Still Flying for Gold, Silver
- How Low Will Silver Go?
- LGMR: Gold Rallies, Rises with US Dollar on "Perfect Storm" Investment Demand
- How to Trade Market Bottoms for SP500 & Gold
- Things
- Daily Dispatch: We Have Nothing Left to Fear…
- Derivative Manufacturers More Powerful Than Central Banks
- Daily Credit Summary: May 21 - Where's The Rally Monkey?
- The Importance of the Macro-Political Landscape and How David Einhorn Used It to Predict 2010
- Fact vs. Fiction on Today’s Economy
- New Forecast From NABE 'Professional' Economists
- Eric Sprott On Financial Farcism
- This Is Not A Good Sign:
- In Anticipation Of A Run On The Tri-Party Repo System
- ETFs and the “Flash Crash”
- Investing in Silver as China Enters its “Spend” Phase
- Market Turmoil Boosts Long-Term Government Bond ETFs
- Monday ETF Roundup: XLF Slides, GLD Surges
- In The News Today
- The BP Oil Leak Trade
- Amazing chart shows gold beats stocks and inflation
- Gold, Dow And The South African Rand
- Goldman Dissects The Equity Market Sell Off
- Was the GM Bailout a Success?
- Beauty is Truth, Part II
- MONDAY Market Excerpts
- Preferred Stock ETFs, High Yield Bond ETFs: Are They Flashing Signs of Increased Risk-Taking?
- Monday Options Recap
- Nouriel Roubini: From Macroeconomic Visionary to Reflexive Crank
- Weekly Market Calendar - May. 24-28
- Mutual Fund Monday Phenomenon Ends As Monday Close Is Mirror Image Of Friday
- 'Flash Crash' Highlights Differences in Way Mutual Funds, ETFs Operate
- BP (NYSE:BP) — Is BP Too Big to Fail?
- Trading in Precious Metal ETFs Hits All-Time High
- Guest Post: Growing Revolutionary Guard Spells Uncertainty For Oil Investors In Iran
- San Fran Fed On "Lessons [Un]Learned" From Loss Provisions And Bank Charge-offs
- Put On Your Selling Shorts This Summer
- Collins Amendment Will Eliminate $108 Billion From Bank HoldCo Regulatory Capital, Will Reduce Big Four Tier 1 Capital By 13%
- Too Big to Fail Means Too Big to Exist
| Gold Seeker Closing Report: Gold and Silver Rise with the Dollar While Stocks and Bonds Fall Posted: 24 May 2010 04:00 PM PDT Gold climbed to as high as $1190.85 in late Asian trade before it fell back to $1181.85 in London, but it then rose to a new session high of $1195.40 in New York and ended with a gain of 1.51%. Silver climbed to as high as $18.04 in late Asian trade before it fell back to almost unchanged at $17.698 in London, but it then rose to a new session high of $18.052 in New York and ended with a gain of 2.04%.
|
| Sell in May and Go Away, Will the Summer Doldrums knock the gold price? Posted: 24 May 2010 01:00 PM PDT The global gold market has always seen India as the largest individual source of demand for gold. It has reached 850 tonnes in the best years and even in the worst years has been over 300 tonnes. It has been possible to track the seasonality of this demand fairly easily during this time. This demand has been labeled as Jewelry demand, we believe wrongly.
|
| Daily Dispatch: We Have Nothing Left to Fear Posted: 24 May 2010 12:56 PM PDT May 24, 2010 | www.CaseyResearch.com We Have Nothing Left to Fear… Dear Reader, This is “crunch” week – the week I get serious about editing the June edition of The Casey Report. As a consequence, for much of today’s edition of this missive, I’m going to quickly comment and otherwise make snide remarks on some of the more interesting news stories now crossing over the screen. Most news, when reflected upon, is neither all that important nor nearly as urgent as the media would like you to think it is. However, similarly to the visible tip of an iceberg, some news does have significance in that it points to larger stories lurking just out of sight. Let’s see if we can spot some of the significant stories in today’s offerings. Story #1 – Big Money Moving into Gold.[INDENT] Headline: Gold Rising as Euro Weakens Spurs Mor...
|
| Posted: 24 May 2010 12:56 PM PDT (Each in exactly 101 Words!) Silver Stock Report by Jason Hommel, May 24th, 2010 Usury. Lending at interest (usury) is the bane of our era, the highest crime of the ages, condemned by prophets, regulated by God, and ignored by modern man. God said no usury, unless you loan to other nations, but every seventh year is supposed to be a time of debt forgiveness, thus, it's a plan to teach the nations about God, yet abused instead to enslave people into perpetual bondage. Usurers want the whole earth, plus 6%! Lending is not so much a problem as is the interest! When gold is money, gold grows more valuable over time, so "increase" is built in! The Big Picture for Silver. No nation on earth uses silver or gold as a circulating medium of exchange, or common currency. This trend to not use silver started over 150 years ago, and h...
|
| Posted: 24 May 2010 12:56 PM PDT Source: Brian Sylvester and Karen Roche of The Gold Report 05/24/2010 "We're seeing gold actually rise in all currencies. That seems to be a reflection of the concern and distrust for central bank authorities, political authorities and what's going in the world that we're living in," says Doug Groh, senior research analyst with the Tocqueville Gold Fund in this exclusive interview with The Gold Report. The fund is almost 10% bullion, which Groh says dampens the volatility of the fund's other holdings. He holds gold and thinks you should, too. The Gold Report: Gold is trading above $1,200 as financial markets across the world retreat. In several currencies, gold is trading at historic highs. Gold investors are declaring that gold is the only safe haven. What's your view of the current situation? Doug Groh: What we're seeing in the world is really quite dramatic, isn't it? I think people are beginning to recognize that there's a lot of uncertainty in the future for ...
|
| Momentum Reversal, Guru’s Fears, Gold Demand, Housing Horrors and More! Posted: 24 May 2010 12:56 PM PDT The 5 min. Forecast May 24, 2010 11:51 AM by Addison Wiggin & Ian Mathias [LIST] [*] “A complete reversal of market momentum” … Dan Amoss on how to play it [*] Why one longtime value guru is “more worried” than he’s ever been in his career [*] Another housing statistic that must be seen to be believed [*] Reflections from China: One perspective on why the property “bubble” is nothing like the bust in the U.S. [*] A BRIC country’s looming election… and two plays that’ll perform no matter the outcome… and more [/LIST] “Interesting week,” a reader wrote in, exasperated on Friday night. “What will happen next week one can only wonder. “The air is news sensitive, we wonder what any bad news… at all… will do.” To be sure, we chose an “eventful” week to be out of the country. “We’ve seen an almost complete reversal of market mom...
|
| Got Gold Report – Caution Flags Still Flying for Gold, Silver Posted: 24 May 2010 12:56 PM PDT Stand by, stay hunkered down, but get ready to reenter – maybe soon too. “Concerns of a full blown credit crisis have probably diminished some but cannot be ruled out.” – U.S. Global Advisors, Friday May 21. ATLANTA – In our last full Got Gold Report two weeks ago (May 9) we hauled out the caution flags because of the ominous signals then showing in the data, charts and ratios we follow closely here at GotGoldReport.com. The subtitle of that report said, “Rig for heavy weather and hope we don’t get it.” Well, we got a crazy sell-everything-now type typhoon and then some since then. Big, harsh moves down on the Big Markets (the DOW down more than 750 points), gold off nearly $70 from its pinnacle and $55 this week alone, silver manhandled about $1.67 lower this week, the HUI down 55 points or 11.4%, and the list just keeps on bleeding. We just wonder now whether we are about to enter the eye of the storm or the...
|
| Posted: 24 May 2010 12:56 PM PDT Jeff Clark, Casey’s Gold & Resource Report We released our 2010 Silver Buying Guide last week and the silver price promptly cratered. So does this change our view of gold’s shiny cousin? Hardly. While industrial uses comprise about half (53%, according to GFMS) of silver’s demand, making it susceptible to bigger falls than gold in a weak economy, it is equally clear silver also responds well to inflation, as well as serious financial “dislocations” (to put it nicely). There are many examples of this, perhaps the best being the late 1970s. The economy in the middle of that decade was going nowhere, so some investors dumped their silver holdings because demand would supposedly be weak. A big mistake, as we now know, because silver’s greatest advance occurred at a time industrial demand was, at best, flat. Instead, silver rose due to monetary concerns and rampant inflation, giving investors 500%+ returns in the latter part of that de...
|
| LGMR: Gold Rallies, Rises with US Dollar on "Perfect Storm" Investment Demand Posted: 24 May 2010 12:56 PM PDT London Gold Market Report from Adrian Ash BullionVault 09:35 ET, Mon 24 May Gold Rallies, Rises with US Dollar on "Perfect Storm" Investment Demand THE PRICE OF GOLD in all currencies ticked higher in Asia on Monday, briefly touching $1190 an ounce before easing back in London as a rise in Asian stock markets failed to spur European equities. The Euro and Sterling both fell hard vs. the Dollar. US crude oil contracts slipped below $70 per barrel. The rate of interest offered by government bonds fell yet again as prices rose, with 10-year US Treasury yields falling below 3.20% per year for the first time in 12 months. Silver prices today slipped back after rallying 3.7% from Friday's two-week low. "Gold looks to have found a short-term bottom last Friday near $1166," reckons a note from Mitsui's Hong Kong office. "Both physical and investment demand [are] picking up." "We have been looking for a retracement in gold," agrees Standard Bank's c...
|
| How to Trade Market Bottoms for SP500 & Gold Posted: 24 May 2010 12:56 PM PDT The stock market topped in April which was expected from analyzing stocks and the indexes. Back in April I posted a few reports explaining how to read the charts to spot market tops. Today’s report is about identifying market bottoms. It does not get much more exciting than what we have seen in the past 2 months with the market topping in April and the May 6th mini market crash. This Thursday we saw panic selling which pushed the market below the May 6th low washing the market of weak positions. For those of you who have been following me closely this year I am sure you have noticed trading has been a little slower than normal. This is due to the fact that the market corrected at the beginning of the year and we went long Feb 5th and again on Feb 25th. Since then the market rallied for 2 months and never provided another low risk entry point. In April the market became choppy and toppy and we eventually took a short position to ride the market down. Now...
|
| Posted: 24 May 2010 12:56 PM PDT The following is automatically syndicated from Grandich's blog. You can view the original post here May 24, 2010 04:43 AM [LIST] [*]$3,000 gold? [*]Better than paper money [*]Gold looking good [*]The dam about to burst? [*]Time to pay the piper [*]Hearing the sound of war drums [/LIST] [url]http://www.grandich.com/[/url] grandich.com...
|
| Daily Dispatch: We Have Nothing Left to Fear… Posted: 24 May 2010 12:43 PM PDT May 24, 2010 | www.CaseyResearch.com We Have Nothing Left to Fear… Dear Reader, This is “crunch” week – the week I get serious about editing the June edition of The Casey Report. As a consequence, for much of today’s edition of this missive, I’m going to quickly comment and otherwise make snide remarks on some of the more interesting news stories now crossing over the screen. Most news, when reflected upon, is neither all that important nor nearly as urgent as the media would like you to think it is. However, similarly to the visible tip of an iceberg, some news does have significance in that it points to larger stories lurking just out of sight. Let’s see if we can spot some of the significant stories in today’s offerings. Story #1 – Big Money Moving into Gold.[INDENT] Headline: Gold Rising as Euro Weakens Spurs Mor...
|
| Derivative Manufacturers More Powerful Than Central Banks Posted: 24 May 2010 11:36 AM PDT Dear Friends, The power of the derivative manufacturers is clearly stronger than the combined power of world central banks. The mockery made of the $1 trillion Shock and Awe of the euro rescue package is telling. The public relations that Monday had to be approved by the architects of what is now a joke. The real story is that the credit default swaps derivative dealers are stronger than all central banks put together. Soon markets will see this and rush to the side of the stronger which are the currency shorts of the Western world. Gold will be purchased for a very long time to come as currencies will offer no storehouse of value. The central banks have publicly lost the battle and no cover will serve to keep this realization away from international money. The euro pulled back almost, but not quite, to the base line of the flat bottom triangle and is now looking at $1.10 support. The size of the fortunes which are being made by the attacking forces boggles the imagination. Those that will make the largest profit in gold are just the same forces now attacking Western world currencies. You must stop being driven crazy by watching the day to day action of gold which is destined only to become increasingly volatile. Good gold shares in any category of production will at one point outperform gold 5 to 1. The end of confidence in the fiat money system is behind us. From here on it is structure after structure that is going to fall. The power of the derivative manufacturers is clearly stronger than the combined power of world central banks. Respectfully,
|
| Daily Credit Summary: May 21 - Where's The Rally Monkey? Posted: 24 May 2010 11:34 AM PDT Commentary courtesy of www.creditresearch.com Spreads closed the day weaker after clinging to gains until mid-afternoon and outperforming stocks. A slow-and steady decline in FINLs finally cracked the low activity rally in risk assets but we note IG underperformed HY as stocks sold off helped by the EUR stalling. Cash underperformed synthetic single-name credit once again but the late-day rush for protection suggests investors once again covering with macro overlays - not a good sign for bonds. Today's biggest absolute movers in IG were American International Group, Inc. (+29.5bps), Transocean Ltd. (+27.5bps), and SLM Corp (+20bps) in the wideners, and GATX Corporation (-10bps), RR Donnelley & Sons Company (-9bps), and Sempra Energy (-8bps) in the tighteners. Today's biggest percentage movers in IG were Transocean Ltd. (+12.94%), Marsh & McLennan Companies, Inc. (+6.9%), and American International Group, Inc. (+5.96%) in the wideners, and Duke Energy Carolinas, LLC (-7.42%), Devon Energy Corporation (-6.58%), and Sempra Energy (-6.5%) in the tighteners.
|
| The Importance of the Macro-Political Landscape and How David Einhorn Used It to Predict 2010 Posted: 24 May 2010 11:03 AM PDT (Original post here) Submitted by Qasim Khan Perhaps one of the most overlooked phenomena in this world is the relationship between cause and effect. Financial markets and economics in general are often noteworthy exhibitions of a lack of recognition of this principle. In just a few minutes watching CNBC, you are bombarded with statistics that PROVE our miraculous economic recovery. The macro data has become better; anyone who denies that is disconnected from reality. However, as the markets have vehemently demonstrated recently, the fact is that these numbers have become increasingly irrelevant. Why you ask? Because we don’t live in a society where these numbers represent organic, secular conditions anymore; instead, they reflect the increasingly contradictory and escalating political tension of the world.
Importance of Geo-Politics While CNBC talks about things like CPI, PMI, and Cramer’s PMS instead of bigger picture geo-political developments, their importance cannot be understated. And while many traders and investors do not heavily account for such macro elements (evidenced by the fact that the global economy could be brought to its knees by a largely unforeseen housing bubble), David Einhorn, whom I have had the fortune of meeting, perfectly explains the importance of this in a speech to the Value Investing Conference in October 2009. Einhorn, known for his bottom up investment style, found a greater appreciation for the importance of macro developments after the recent financial crisis. In the speech he offers several extremely poignant predictions based upon this macro-political perspective, almost completely vindicated by the events in 2010. He said:
Stimulus This ideological change has become apparent in the market more generally as well. CNBC can toot all the numbers and expectations they want, the truth is economic data has taken a back seat to political circumstances in the new market. To understand the causal dynamics of the current recovery it is necessary to ask “how” and “why” instead of asking the much trumpeted CNBC question of “what”. From this perspective it becomes clear that the “recovery” that we have experienced draws heavily on exceptionally generous intervention. The government response was in all likelihood necessary and has resulted in improved economic data; however, it seems that the stimulus improved the (certain) numbers simply for the sake of improving (certain) numbers. As this has become increasingly apparent, there has been a paradigm shift where political conditions and events increasingly overwhelm economic data and appear to continue to do so for the foreseeable future.
Perhaps the most pressing question is: “How much longer can sovereign governments afford to provide extremely loose conditions and subsidize private sector debt?” So how early is too early to remove stimulus? Einhorn wisely prophesied that government response to the financial crisis would make previously economic issues become subject to politics:
Austerity The unsustainable nature of the interventionist mandate is becoming increasingly apparent, evidenced by the explosion of sovereign debt concerns this year. This crisis has resulted in a reexamination of the importance of fiscal discipline and introduction of austerity plans in Europe. While the US states do not face the same difficulties as their European counterparts, their problems may be just as difficult to overcome.
This past week, the great city of Central Falls, Rhode Island was placed in receivership, which comes as a tremendous surprise because the city website’s slogan led me to believe that Central Falls was “A City with a Bright Future.” It’s funny that their website failed to mention that its public school system was universally accepted to be well below satisfactory standards; so poor in fact that in February the Board of Trustees voted to fire the ENTIRE teaching and administrative staff of the school system. As misplaced or harsh as this measure may have been (clearly such systemic problems have more than one causal source), being labeled as “persistently lowest-performing” and having a 48% graduation rate is simply unacceptable. It is not surprising to find this result was an product of monetary union conflict. The articles points out:
So let’s get this straight: the students were performing so poorly that in order demand more commitment from teachers, they should be paid an even greater amount? It’s no wonder why the school system would be so fundamentally unproductive. While I don’t believe a teacher would purposely sabotage their students, the breakdown of talks demonstrates that the teachers were not committed to the job they should already be doing. Talk about moral hazard. But it turns out that the problem of paying its current teachers was minor in comparison to the true problem of paying retired teachers, as this article points out:
And if you believe that Central Falls is the only municipality struggling with its pension commitments, you might find this NYT piece quite enlightening. While Central Falls may be insignificant in the larger scheme of things, make no mistake, austerity measures will take place within the US and they will result serious consequences.
Geo-political Tension
|
| Fact vs. Fiction on Today’s Economy Posted: 24 May 2010 10:38 AM PDT By David Galland, Managing Editor, The Casey Report There is a lot of "noise" being tossed out by the politicos and their preferred pundits about how the U.S. economy is on the mend. Thus it is important to try and separate fact from fiction about where things really stand.FICTION: Though sporadic, the U.S. economy will continue to improve. FACT: The U.S. is headed for a currency crisis. While having learned to cover their butts by adding some modest modifiers to their generally rosy forecasts, the administration's shills (Geithner, Bernanke, Summers, et al.) are unified in telling us that the worst is over. The fact is that the U.S., nay, the world, is headed for fiat currency crash. Let me push forward some evidence in support of that contention. In this fiscal year, the U.S. government will run its second trillion-dollar-plus deficit. Concerned about the political heat going into the November elections, the Democrats have been making noise about cleaning up their sloppy spending. A couple of months back, El Presidente of this banana republic intoned that his government… …[cannot] continue to spend as if deficits don't have consequences… as if the hard-earned tax dollars of the American people can be treated like Monopoly money. Which is to say, he acknowledged that the deficits have consequences. And what might those consequences be? For starters, rising interest rates. Because in order to finance its hyperactive spending, the government will have to sell a lot of debt – and because all the developed nations find themselves in the same boat, they'll have to manage those sales in an increasingly competitive environment. Of course, higher interest rates put yet more pressure on the many businesses that rely on access to capital to sustain themselves. And higher rates crush borrowing for houses and other large-ticket items… which means, they crush the economy. Especially one perched on a foundation of debt. Inflation is another consequence, because when the prospective debt buyers begin to stay home or, more likely, agree to show up but only for a more attractive yield, the Fed will increasingly be forced to monetize the debt. Leading to the demand for even higher yields. Once the monetization begins in earnest, and in plain sight, Obama's high-speed spending train will find itself on very wiggly tracks, leading in relatively short order to a debt-fueled currency crash. The point is that the only real hope for the country starts with deep cuts in government spending. Now, I am not talking about talking about cutting spending – you know, where you stand in front of a warmed-up audience and talk about spending cuts. But honest-to-goodness, real spending cuts. Which brings me to Mars. On April 15, the president gave a speech at Cape Canaveral where, ahead of time, it was advertised that he would announce serious cuts in the space program. That was the fiction spun out to the pundits. More Here.. Canadian Government Pays Organization To Troll Political Chat Forums More Here..
|
| New Forecast From NABE 'Professional' Economists Posted: 24 May 2010 10:22 AM PDT From The Daily Capitalist Remember the Bushism, "fool me once, shame on -- shame on you. Fool me -- you can't get fooled again." Or ... The National Association For Business Economics just came out with their latest forecasts for the economy. That's what brought up the old saying, "Fool me once, shame on you; fool me twice, shame on me" that George W. so magnificently bumbled. Here is what the NABE forecasts:
I guess the big question is: why should we listen to these folks? Here is what the NABE predicted in February, 2007:
In their February, 2008 forecast they said:
As we all know these outcomes were pretty far from the mark. These kinds of predictions are useless exercises and should be ignored. Most of the time these mainline economists can't see beyond their proverbial noses. What they do is look at past quarterly data and then, based on their feelings about how things are going, extrapolate from that a conclusion on what will happen in the future. If you must listen to anyone, including me, at least consider viewpoints 180° from the mainstream. You have a better chance of success, based on the poor track record of NABE 'professional' economists. I suggest you listen to Seth Klarman, or David Stockman for a starter. And read the article I just posted by Doug French on contrarian thinking ("Stock Markets, Cycles, and Dopamine"). Michael Panzer at Financial Armageddon just posted an excellent piece ("Alleged Experts vs. Those With Skin in the Game") comparing the upbeat forecasts of the NY and Philadelphia Fed banks with the contrary positions of traders with "skin in the game." Traders see dark clouds and they are putting their money on the line where it counts.
|
| Eric Sprott On Financial Farcism Posted: 24 May 2010 10:18 AM PDT A must watch two part interview of Eric Sprott by BNN, in which the Canadian asset manager shares his views on the economy, financial markets, sovereign overleverage, industrial commodities, and, of course, gold. The man who created the PHYS index to invest in physical gold, is, not surprisingly, not too excited about perspectives for stocks, and markets in general, which he qualifies as a "financial farce." Sprott is, and has been for a while, confident we will retest the March 2009 666 lows in the S&P. Slowly, more and more "experts" are moving to his camp. He also gives an advance glimpse of the topic of his upcoming May missive for all you Sprott groupies.
|
| Posted: 24 May 2010 10:07 AM PDT From Bloomberg: Banks Seek $10 Billion of Bids in Effort to Sell Bad Mortgages As more banks explore selling soured housing debt, a smaller share of the loans that they are considering off-loading are actually being sold, Daurio and Goodwin said. Instead of one in five potential deals turning into DebtX auctions, "that ratio has gotten worse recently," Goodwin said during the session. LINKDespite the lipstick put on this pig by "experts" quoted in the article, the reality is that mortgage delinquencies and defaults continue to climb and banks are looking to unload as much of this crap-ass paper as they can before they have to start tapping into their excess reserves at the Fed in order to monetize the problem. Let's not forget that a large part of bank profits since last year have been derived from marking up the holding value of assets like distressed mortgages. Although the banking sector was slammed today - the BKX bank index was down 3.2% - Wells Fargo stock was hammered for 4.6%. WFC is a large purveyor and holder of the nuclear explosion mortgages known as pay-option ARMs. The stock performance today in the financial sector likely reflects the deteriorating financial condition of the United States. On a related note, some idiot disguised as a financial expert on CNN Headline News, Clark Howard, was on today gleeflully explaining to viewers that the housing market was going lower now that the housing tax credit expired and it was great time to buy because prices were dropping by as much as 10% in some areas, as people who weren't able to sell to tax credit buyers now look just to sell before they default. How would you like to be one of those poor slobs who was aggressively cajoled into buying some beater of a home by his broker in order to take advantage of the tax credit and "good prices," and and then turn on CNN to hear that now your purchase closed, the value of your home has probably already dropped by about 10% - which factors in 8.5% for the tax credit plus another 1.5% because of the inventory that is now flooding the market. Many homes around my area in Denver are now sporting "price reduced" signs on top the realtor sign in front. The housing market is on the edge of another cliff dive. The policy makers have completely misjudged the effectiveness of the tax credit program as a means of "jump starting" the housing market. Expect the Fed to roll out another massive money printing program, using Europe's woes as the cover excuse. But we all know by now that the problems in Europe pale compared to the brewing financial/economic disaster in this country.
|
| In Anticipation Of A Run On The Tri-Party Repo System Posted: 24 May 2010 10:04 AM PDT A week ago the FRBNY's Task Force On Tri-Party Infrastructure came out with an exhaustive must read report discussing its concerns about the massive $1.7 trillion US tri-party repo market, and specifically proposing several ideas that could prevent a bank run on a shadow market that is second in size only to the money-market $2+ trillion US money market. Incidentally, both markets were on the verge in the days after Lehman. Their day of reckoning may be coming again soon, and with the FRBNY task force's explicit attention on Tri-Party repos, all is probably not well. In fact even Moody's today agreed that until the proposed fixes are implemented (likely many months, if not years away), the tri-party repo "market will remain a major source of systemic risk, especially given the current market volatility and the fact that the Federal Reserve’s primary dealer emergency lending facilities are no longer in place." This should be another bright red flashing warning to those who still have to realize that the liquidity situation from a month ago and now are diametrically opposite. For those interested in the cliff notes on Tri-Party repos, we present Moody's abridged thoughts on the matter. Others may read our previous observations on the topic here.
And to loosely paraphrase Troy McClure, now that you know how fragile the Tri-Party repo market is, try to not to panic too much.
|
| Posted: 24 May 2010 10:00 AM PDT Liquidity is one of the key selling points for exchange-traded funds (ETFs), but the Dow Jones "flash crash" of May 6 shows how that supposed advantage can turn into a huge liability for investors. A report this week from the SEC and the Commodities Futures Trading Commission (CFTC) found that ETFs accounted for the overwhelming majority of securities that fell at least 60 percent that day. Many of those ETFs fell all the way to $0.01 per share during trading. The SEC-CFTC report blames a lack of liquidity for the crash. Many registered investment advisors, brokers and institutional investors use ETFs in their hedging strategies, but this backfired when a spike in volatility caused a stampede of sellers that crushed prices. I don't believe ETFs caused the "flash crash" but the events of May 6 give investors a good reason to look closely under the hood of ETFs. When they do, they might be surprised by what they find.
Research shows that the tradability of ETFs can actually be a costly curse in terms of real returns. The chart above from MoneyWatch.com shows investor returns minus fund returns for both index mutual funds and ETFs in each available Morningstar "style box" for the five years ending June 2009. Negative figures mean investors lagged the mutual fund or ETF's return by buying at the wrong time and vice-versa for a positive return. For example, the average small-cap value ETF investor achieved a return 4.3 percent below what the ETF returned over the same time period. This happens by buying high and selling low. In contrast, the average small-cap value mutual fund investor return was only 0.2 percent below the fund's performance. The returns for index mutual fund investors were higher than the returns for the ETF investors for each of the nine style boxes. And an examination of the five-year returns of more than six dozen ETFs across a range of asset classes by the founder of Vanguard Group concluded that the ETF investors made 18 percent less than the returns of the ETF itself because of the investors' trading activity.
Unlike mutual funds, ETFs can trade at a premium or discount to their net asset value (NAV). When an ETF investor buys at a premium, he overpays for the asset. Likewise, if he sells at a discount, he receives less than the asset is worth. These premiums and discounts can be wide, especially on days with big NAV changes, and the premiums/discounts can swing very quickly from one extreme to another. The chart above shows the NAV trading premiums and discounts for the new Market Vectors Junior Gold Miners ETF (GDXJ). Going back to inception, investors have paid premiums to purchase as high as 3.23 percent and sold at discounts as much as 1.28 percent. For the SPDR Gold Shares Trust (GLD), investors paid a 2.15 percent premium to buy in on May 6 (the day of the "flash crash"), but that swung to a 1.3 percent discount just seven trading days later on May 17. This can work both for and against the investor. Bid-ask premiums or discounts to NAVs can both positively or negatively affect investor return depending on the timing of the transaction. An investor who purchases an ETF at a discount and sells at a premium will receive a higher return than the ETF over the same period of time. There's no such thing as a free lunch when it comes to investing. ETFs have relatively low expense ratios compared with actively managed funds in the same sectors, but that doesn't mean that in the end an ETF costs less to own or that an ETF generates better returns. They can be expensive to trade on volatile days and the events of May 6 uncovered some new weaknesses. ETFs can have a place in many investment strategies, but before buying, investors need to know what they are getting into so they can make the best decisions consistent with their investment goals. Regards, Frank Holmes, P.S. You can visit my blog, Frank Talk, for more daily insight and commentary. [Editor's Note: Frank Holmes will be back for the Agora Financial Investment Symposium this July, along with other speakers including Marc Faber, Bill Bonner, and Doug Casey. You can register for the event here.] ETFs and the "Flash Crash" originally appeared in the Daily Reckoning. The Daily Reckoning, offers a uniquely refreshing, perspective on the global economy, investing, gold, stocks and today's markets. Its been called "the most entertaining read of the day."
|
| Investing in Silver as China Enters its “Spend” Phase Posted: 24 May 2010 10:00 AM PDT Chris Mayer of Mayer's Special Situations is having a wonderful time cruising around China and marveling at the changes that the last 25 years have brought, and is thus driven to say, "One of the great investment opportunities of the next decade will be catering to the emerging middle class in China, India and Indonesia." Immediately, the Intrepid Entrepreneurial Mogambo (IEM) is planning and wondering how I am supposed to cater to these Asians with my new Mogambo Brand Lucky Tasty Eggrolls (MBLTE), who are half a world away. The logistics are boggling, but I am inspired to persevere in that he is not alone in that assessment, and he writes that CLSA, "an investment house with expertise in Asia" thinks that the future is even more stellar than that, and "predicts the consumer markets in China, India and Indonesia will enter a 'hypergrowth' phase as disposable incomes rise." And how high will Asian disposable incomes rise? Well, CLSA "notes that the number of Asians (excluding Japan) with disposable income of $3,000 will rise from 570 million people to 945 million by 2015. About 85% of that increase comes from just China and India." Wow! In 4.5 years! This is stunning stuff, but I groan in dismay, as multiplying 945 million people times $3,000 is a job for a calculator, and so I just unceremoniously stop and flop, hanging my head in weary anticipation of wrestling with a damned calculator using numbers so large that, deep down, I know that any number that comes up will be suspect, if not incomprehensible, and usually both. So I am busily rooting around on my desk, trying to find the damned calculator, and I get mad because I can't find it, and then I run across a memo from last week where my boss is informing me that some guys from the home office are going to be coming by – tomorrow! – to meet with me about my progress on some mysterious "report" that I was, apparently, supposed to be working on, and now I am mad AND scared out of my freaking mind, which I gather from finding my calculator only to hear it laughing rudely at me! My own calculator is mocking me! Its frightening rudeness cuts through me like a knife, although nobody else can hear it until I jam it right up against their ears and say, "Listen to it! Listen to the laughing! Say you hear it or I'll beat your brains out!" and then they all admit that, yes, they hear it, too, proving that I'm not crazy. So, reassured, I was, at last, ready for my ordeal with the laughing calculator, and I returned to Mr. Mayer's report for the data, where, to my delight and surprise, I see that he has done the math for me! Great! He writes that by 2015, by which I figure he means "on December 31, 1914" that the consumption spending of this Asian (ex-Japan) middle class will rise Investing in Silver as China Enters its "Spend" Phase originally appeared in the Daily Reckoning. The Daily Reckoning, offers a uniquely refreshing, perspective on the global economy, investing, gold, stocks and today's markets. Its been called "the most entertaining read of the day."
|
| Market Turmoil Boosts Long-Term Government Bond ETFs Posted: 24 May 2010 09:40 AM PDT Michael Johnston submits: Crumbling global equity markets have been the story of recent weeks, as investors around the world endure increased levels of volatility related to Europe’s deteriorating fiscal situation and concerns over government debt levels. Furthermore, tame inflation and a stronger dollar has tempered demand for inflation-protected securities as well as most precious metals. These recent events in the market have sent many investors running to the relative safety of Treasury bonds, especially long-term securities. This dash has driven down rates virtually across the board, sending bond prices sharply higher as a result. From May third to May 20th, the 1-year rate declined from 0.43% to 0.34%, while the ten year rate declined by 47 basis points and the the 30 year bond fell by 40 basis points. This sharp decrease in interest rates had a huge effect on many bond funds, but especially those that have the longest duration.
Complete Story »
|
| Monday ETF Roundup: XLF Slides, GLD Surges Posted: 24 May 2010 09:33 AM PDT Michael Johnston submits: Investors hoped that Friday’s momentum would carry over to the new week, but a late day dip erased all of the gains from the previous session. Worries over the fiscal situation in Europe continued to dominate trading, as investors digested the credit markets’ report that the chances of a Greek default stand around 75%. A jump in home sales, usually a welcome development, was written off as a byproduct of a tax credit set to expire this month. Elsewhere, Chinese leaders pledged to reform the yuan ahead of a highly-anticipated meeting with Treasury Secretary Geithner in Beijing this week.
Complete Story »
|
| Posted: 24 May 2010 09:30 AM PDT Jim Sinclair's Commentary Let's get those credit default swaps booming out Spanish debt. Hang on Italy and Ireland, the derivative monster is coming for you too! Wall Street needs money! IMF raises fresh concerns about the Spanish economy The International Monetary Fund (IMF) has raised fresh concerns about Spain's economy, saying "far-reaching" reforms are needed to ensure its recovery. It said the country faced "severe" challenges, including the need to urgently reform a "dysfunctional" labour market, and its banking sector. The IMF's comments came after Spanish authorities had to rescue regional lender Cajasur at the weekend. Last week, Spain's government passed austerity measures to cut its deficit. This deficit – the money the administration has to borrow to pay for public services due to insufficient tax returns and other revenues – currently equates to 11% of Spain's economic output. This is substantially higher than the eurozone ceiling of 3% and another concern that the IMF has highlighted.
Jim Sinclair's Commentary It is not what is reported here, but the use of EU credit default derivatives that brought about the dive in the euro. With CDS pounding and the Libor rising the bear play on the euro is successful. This mechanism will turn on all Western world currencies within 12 months, one by one. As CIGA Eric notes, this will turn money towards Gold. Euro's fall deals new hit to risk appetite Monday 16:35 BST. Another sharp drop in the euro is curtailing risk appetite, as traders again fret about the fragility of the eurozone economy. The FTSE All-World equity index is down 0.3 per cent, while the dollar and US Treasuries are higher on haven flows. Wall Street's S&P 500 is off 0.5 per cent, despite some supportive home sales data. The global session had begun in a more positive mood as some traders speculated that the regulatory and fiscal-funk induced flight from risky assets over recent days may have been overdone. The S&P 500 fell 4 per cent last week to a three-month low, measures of volatility jumped and high-yielding, growth-focused currencies such as the Australian dollar were battered as investors worried about the damaging impact of austerity measures required to tackle nations' huge budget deficits. Wall Street's late 1.5 per cent bounce on Friday also initially helped sentiment on Monday. So did a sharp rebound in Chinese stocks after hopes were raised that Beijing's moves to damp property market speculation would not be as heavy-handed as feared, and would therefore not crimp broader economic growth too severely.
Jim Sinclair's Commentary The contingent that went from Washington to China looks like half of the present administration's financial personalities and advisors. The result was nothing much. China cannot be cajoled into fulfilling the desires of the West. China will do what China wants to do when China wants to do it. US and China seek to strike conciliatory note The US and China tip-toed around each other at a summit in Beijing on Monday, going out of their way to avoid open disagreements on North Korea, exchange rates and other thorny issues that divide them. After a period at the start of the year when relations appeared to be deteriorating rapidly, raising the possibility of a trade war, both governments were at pains to strike a conciliatory note in their public comments even though there were few signs of progress on any of the major subjects. The annual summit, which began focusing on economic issues but which the Obama administration broadened to include security, is essentially a Washington-led effort to engage more with the Chinese government and to enlist its support in managing global issues, although China is less defensive these days than it used to be at such meetings and also brings its own wish-list. President Hu Jintao pledged that China would reform a currency policy that effectively pegs the renminbi to the US dollar – one of Washington's main priorities in its dealings with China – although he gave no hints about the timing of any policy shift. "China would continue to steadily advance the reform of the formation of the renminbi exchange rate mechanism under the principle of independent decision-making, controllability and gradual progress," he said.
Jim Sinclair's Commentary This is something we all know. There is no hope for a return to budgetary sense. Now think about this along with Volcker's position that time is running out. Running out of time for what? The US dollar in the end, literally. More Blank Checks to the Military Industrial Complex Congress, with its insatiable appetite for spending, is set to pass yet another "supplemental" appropriations bill in the next two weeks. So-called supplemental bills allow Congress to spend beyond even the 13 annual appropriations bills that fund the federal government. These are akin to a family that consistently outspends its budget, and therefore needs to use a credit card to make it through the end of the month. If the American people want Congress to spend less, putting an end to supplemental appropriations bills would be a start. The 13 "regular" appropriations bills fund every branch, department, agency, and program of the federal government. Congress should place every dollar in plain view among those 13 bills. Instead, supplemental spending bills serve as a sneaky way for Congress to spend extra money that was not projected in budget forecasts. Once rare, they have become commonplace vehicles for deficit spending. The latest supplemental bill is touted as an "emergency" war spending bill, needed to fund our ongoing conflicts in the Middle East. The emergencies never seem to end, however, and Congress passes one military supplemental bill after another as the wars in Iraq and Afghanistan drag on. Many of my colleagues argue that Congress cannot put a price on our sacred national security, and I agree that the strong, unequivocal defense of our country is a top priority. There comes a time, however, when we must take stock of what our blank checks to the military industrial complex accomplish for us, and where the true threats to American citizens lie. The smokescreen debate over earmarks demonstrates how we have lost perspective when it comes to military spending. Earmarks constitute about $11 billion of the latest budget. This sounds like a lot of money, and it is, but it is a drop in the bucket compared to the $708 billion spent by the Pentagon this year to expand our worldwide military presence. The total expenditures to maintain our world empire is approximately $1 trillion annually, which is roughly what the entire federal budget was in 1990!
Jim Sinclair's Commentary We are in a major leg in gold that will take us to $1650 and above. The Gold Council (mouthpiece and transparent beard spokesman for the majors) still needs to learn that gold is money, not jewellery, and has the price potential of multi thousand dollars per ounce. Speculators Grab Gold Faster Than Mines Can Produce It Speculators are buying gold faster than the world's biggest producers can mine it as analysts forecast a 27 percent rally that may extend the longest run of annual gains since at least 1920. Exchange-traded products backed by bullion added 41.7 metric tons in the week to May 14, the most in 14 months, data from UBS AG show. China, Australia and the 15 other largest mining nations averaged weekly output of 41.6 tons last year, researcher GFMS Ltd. estimates. Even though prices have fallen 5.1 percent to $1,185.30 from a record $1,249.40 an ounce May 14, the median in a Bloomberg survey of 23 traders, analysts and investors shows it will reach $1,500 by the end of the year. Buying accelerated as the MSCI World Index of 23 developed nations' stocks tumbled as much as 16 percent since mid-April and the euro weakened to a four-year low against the dollar. Holders of ETPs, including George Soros and John Paulson, accumulated a record 1,938 tons by May 21, eclipsing all but four of the biggest central-bank holdings. "You could see gold go up another $1,000," said Evan Smith, who helps manage $2 billion at U.S. Global Investors Inc. in San Antonio and in 2006 correctly predicted that gold would reach $700 within two years. "All of the turmoil and problems we've seen in Europe is just another reminder that there's a lot of value in gold as a safe haven." The risk to gold bulls lies in economic growth, which should buoy the prospects of metals linked to industrial demand, such as copper and silver. The world economy will expand 4.2 percent this year, the International Monetary Fund said April 21, raising its January projection from 3.9 percent.
Jim Sinclair's Commentary This is quantitative easing regardless of what is said by European financial personalities. Any statement to the contrary is ludicrous. ECB steps up emergency bond purchases The European Central Bank has stepped up its efforts to shore up eurozone debt markets by buying another €10bn of government bonds in the last week but bankers expect the programme will have to be intensified amid continued market fragility. The purchases – announced on Monday – bring the ECB's bond-buying to about €26.5bn since it announced the unprecedented programme two weeks ago, in support of a €750bn "shock and awe" rescue package adopted by eurozone governments and the International Monetary Fund to try to arrest a gathering sovereign debt crisis. So far the policy has had a limited effect, with confidence in the eurozone further hit by last week's surprise German ban on some types of short-selling. Market participants say nervous international investors are likely to sell at any sign of uncertainty or doubts over the eurozone economy and bond markets, suggesting the ECB will have to intervene regularly over the coming weeks.
Jim Sinclair's Commentary Nice fluff off to blame Europe for the entire Western world. One false move in Europe could set off global chain reaction If the trouble starts — and it remains an "if" — the trigger may well be obscure to the concerns of most Americans: a missed budget projection by the Spanish government, the failure of Greece to hit a deficit-reduction target, a drop in Ireland's economic output. But the knife-edge psychology currently governing global markets has put the future of the U.S. economic recovery in the hands of politicians in an assortment of European capitals. If one or more fail to make the expected progress on cutting budgets, restructuring economies or boosting growth, it could drain confidence in a broad and unsettling way. Credit markets worldwide could lock up and throw the global economy back into recession. For the average American, that seemingly distant sequence of events could translate into another hit on the 401(k) plan, a lost factory shift if exports to Europe decline and another shock to the banking system that might make it harder to borrow. "If what happened in Greece were to happen in a large country, it could fundamentally mark our times," Angelos Pangratis, head of the European Union delegation to the United States, said Friday after a panel discussion on the crisis in Greece sponsored by the Greater Washington Board of Trade. That local economic development boards are sponsoring panels on government debt in Greece is perhaps proof enough that Europe's problems are the world's. That the dominoes can tumble fast was shown Thursday when a new and narrowly drawn stock-trading policy in Germany helped trigger a sell-off on Wall Street.
|
| Posted: 24 May 2010 09:24 AM PDT Michael Kudrna submits: With crude oil being pressured and the BP plc (BP) oil leak still flowing strong, the consensus is split on which direction we will trend next. On one side you have skeptics saying to get out before all the markets crash even though CNBC called a bottom last week. Every day, it seems I am becoming more bearish (especially when CNBC calls a bottom) as I feel we could be one disaster away from a larger correction or possible crash. This disaster could be another serious volcano disruption or more than likely a hurricane as the hurricane season starts next week. If not a natural disaster, we still have the possibility of a collapse, reminiscent of Greece. Some say China’s economy might be significantly weaker than the media has been proclaiming, which would easily allow the bears to wreak havoc. This wouldn’t be the first time major media lead us in the wrong direction. On the other side of the argument, you have contrarians loading up with the hopeful expectation that BP will fix the leak before the markets crash, if they actually do. Crude oil has fallen lower, which I attribute to psychology rather than lack of global demand. With that being said, if BP does fix this leak shortly, we could see a strong rally in crude. This rally could slingshot many beaten oil stocks to new highs but time is against us in this trade. I am currently gambling on this oil trade and it has not been a trade for those with a weak stomach. BP could still fail in their attempt, which is likely to send crude prices down another leg. I have tight stops in place as not only could BP fail miserably, but we could see a market selloff before the fate of the leak is determined. If a hurricane develops anytime soon, we would see the repair efforts halt and a bad situation turn worse. Since I have been playing defensively over the past few weeks and now sitting in mostly cash, I feel as safe as I can doing this high risk/high reward oil trade. Again, this is not a trade for those with a weak stomach. Complete Story »
|
| Amazing chart shows gold beats stocks and inflation Posted: 24 May 2010 09:24 AM PDT By John Doody in The Gold Stock Analyst: As the chart shows, if Gold had simply kept up with inflation since freed from $35/oz in Mar-68, it would now be at $225/oz. But in fact, Gold has gained over 4X more to $1,193/oz, protecting investors from inflation and yielding a return 4% above the CPI!  (As an aside, [I] was recently asked how Gold did versus the S&P500 over the period. It's not on the chart, but S&P500 began the period at 89.11 and closed yesterday, 43+ years later, at 1115.05... a 6.05% compound rate of return. Over the long term, Gold has trumped stocks and inflation.) Crux Note: John Doody is the editor of Gold Stock Analyst, and his proprietary gold stock system has consistently beaten gold and other gold investments over the past 10 years. To learn more, click here. More on gold: The No. 1 thing to remember about gold Gold guru Turk: Gold to hit $8,000 by 2015 Gold could be headed higher... much sooner than you think
|
| Gold, Dow And The South African Rand Posted: 24 May 2010 09:23 AM PDT Last week was a very interesting week in the gold market. Those people who think that gold is going down from here have a big surprise coming. However, we will probably have more of these scary drops in the gold price as we continue ... Read More...
|
| Goldman Dissects The Equity Market Sell Off Posted: 24 May 2010 09:22 AM PDT From Goldman's Noah Weisberger, responsible for such pearls as Goldman's Top Trades for 2010
1. Overview Following another challenging week for risk assets, the US equity market closed up on Friday, with European markets mixed. Asian markets were mostly down to end the week, save for China, where A-shares rose more than 1%. Although LIBOR/OIS continued to widen, the Euro strengthened a bit at the end of last week and key cyclical FX crosses stabilized after some bruising moves earlier. Despite a better Friday, European sovereign risk and US financial reform continue to weigh on markets, causing some to connect the dots from these sorts of concerns to broader questions about the health and sustainability of the global cycle. Our baseline view remains that these fears are overdone. Indeed, in Wednesday’s Global Economics Weekly, Jim O’Neill argued that the world remains “Better than you think” with the needed austerity in peripheral Europe posing only minimal challenges to our above consensus global real GDP growth view. Importantly, conclusive economic evidence of a shift in the business cycle has yet to materialize. While data strength is certainly not as uniform as it has been in the recent past, May market damage has cut deeply. The SPX is down 12% over the last month and implied equity volatility (the VIX) is halfway back to 2008 peaks. Any shift in the data is still nascent and miniscule at best, while markets have priced in more significant economic weakness than is yet evident. As Kamakshya Trivedi and Fiona Lake discussed in last Thursday’s daily, markets have not been sweet on China growth for some time. And, in May, the US bond market rally and the more recent collapses in the AUD and copper prices all go hand in hand with economically driven jitters. Though macro themes are on the move again, it is worth mentioning that the macro shifts currently are not yet quite as pronounced as they were during the January / February sell off, and the index move this time around is more the focus. As we have done in the past, we use some of our macro-driven equity baskets – Wavefront GDP Growth, Wavefront Oil Prices and Wavefront Interest Rates -- as equity market “risk factors” – and then ask if top line market returns line up with tangible shifts in macro risk. We augment this set of risk factors with the GS Financial Conditions Index (ex-the SPX itself) too as an all in proxy measure for the economic growth impulse being delivered by financial easing in other asset markets. One other visible equity market effect of the extent of the risk off nature (as opposed to macro driven nature) of the current sell-off, has been the behavior of energy equities. Over the last month, the US energy equities have declined 16%, underperforming the market by “only” 4%. This modestrelative underperformance stands in stark contrast to energy itself. Oil prices have declined sharply all along the curve with the two-year oil swap (which prices off the average of the first 24 months of the strip) down about 17%. So, relative to the even more dramatic pullback in oil prices themselves, energy equities, though down about in line with the equity market overall, have not been doubly punished for their energy exposure as well. The following trading ideas from the Global Markets Group reflect shorter-term views, which may differ from the longer-term "structural" positions included in our "Top Trades" list further below.
On rates:
Equity Trading Strategies: Stay long German equities (DAX), opened at 5937.16 on 11 May 2010, with a target of 6550, and a stop 5650, now at 5829.25.
|
| Posted: 24 May 2010 09:08 AM PDT Chip Krakoff submits: General Motors’ return to profitability had to jostle for attention with other big stories in last week’s newspapers -- notably the burning of Bangkok, the resurgence of Iceland’s volcano, and the Greek crisis and bailout -- but it stood out nonetheless. Here was a bankrupt company, delisted from the New York Stock Exchange and deprived of its 83-year place in the Dow Industrial Average, now owned by an unholy trinity of the U.S. and Canadian governments and the United Autoworkers, showing a respectable first quarter profit almost exactly a year after it filed for bankruptcy protection. Although axing various brands like Hummer, Saturn, and Pontiac, closing plants, and laying off thousands of workers played a big part in the turnaround, no less significant was a nearly 50% increase in GM sales, from $22 billion in the first quarter of 2009 to over $31 billion in the first three months of this year. GM’s position – on its own and via several joint ventures – in the Chinese market is a big part of the story, but nowhere near as miraculous as the $1.2 billion quarterly profit of its North American operations, which seemed to exemplify all that was wrong about the company, from its arrogant and hidebound management to its ruinous labor practices and retirement benefits that by some estimates added $1,500 to the cost of every car. Who would have predicted that such a potent example of irreversible industrial decline could be so quickly…reversed? I was skeptical about the GM bailout/takeover from the beginning, and I gave voice to my apprehensions in this blog and elsewhere. I believed, and I still believe, that government has no business being in business, something the Swedes were ready enough to say when faced with the collapse of Saab, but which the Obama White House and the Congress were not. I also objected because GM’s senior creditors got a tiny fraction of what they were owed (and were denounced by the President as greedy speculators when they dared complain) while the union was handed a 17.5% ownership stake in the company (not worth much at that time, but likely to be worth a great deal if and when GM recovers). Honesty, however, obliges me to ask if my original assessment was wrong; if my view that government should keep its nose out of business is nothing more than a quaint superstition – like abolishing the Fed or returning to the gold standard – in an evolving “post-capitalist” world. Leaving aside the question of whether last quarter’s results confirm a rosy future for GM, shouldn’t the results be allowed to speak for themselves? Shouldn’t we judge the bailout at least a qualified success? Not so fast. As a shareholder, albeit minimally and involuntarily, I of course hope GM will succeed, but its success would prove nothing. Remember the $7,600 coffeemaker, the $700 toilet seat, and the $436 hammer that caused a military procurement scandal in the 1980s? No doubt the coffeemaker served up a perfectly adequate cup of java, but it probably wasn’t the most effective or least costly option. So the question is not so much whether the bailout will succeed, but how it stacks up against the alternative, which would have been to let GM go into bankruptcy without government assistance. First, we would have saved not only the $56.7 billion official price tag of the bailout, but also the $17 billion in TARP funds poured into the restructuring of GMAC (GMA), the finance arm of GM, as well as other items that may leave little change from $100 billion. Before going into Chapter 11, GM employed 91,000 people in the U.S., and has since cut nearly 23,000 jobs, bringing the current total to around 68,500. Supporters of the bailout argued that job losses would have been much greater if GM went into an unstructured bankruptcy, which could have led to liquidation, eliminating all 91,000 jobs plus as many as a million more in parts suppliers and other companies that depend on GM for their livelihood. But that outcome was never remotely likely; Americans buy a certain (if smaller) number of cars each year, most of which will be assembled in the U.S. with a high proportion of U.S. components. Whether those cars bear a GM or a Honda (HMC) nameplate is almost beside the point. Most of the famous British automobile marques that still exist are owned by foreigners and built mainly in places like China and India, but the auto industry employs an estimated 800,000 people in Britain, less than the one million plus of the 1960s, but a substantial number all the same. It’s just that they are making Nissans and Hondas instead of Morris Minors. My worst fears about the consequences of a government takeover of GM may never come to pass, but it’s probable that the most apocalyptic fears of the supporters of the bailout would not have materialized either. Having spent a fair chunk of my career nosing through the wreckage of state-owned companies in Africa and Eastern Europe, I can attest that the odds are highly stacked against the success of state ownership and management of businesses. So was I wrong? In the specific case of GM the answer is "maybe," partly. But in general, "no." A far more likely outcome of government bailouts is what happened to Chrysler, which in 1979, technically bankrupt, received government loan guarantees of $1.2 billion, and then limped along from one ill-conceived deal to the next for the subsequent 30 years until it went bankrupt for real, at which point the government once again stepped in with over $3 billion in loans and emerged sharing majority ownership with the UAW. It turns out that what our parents told is true, for companies as well as individuals. If you never have to suffer the consequences of your mistakes, you will go on making them over and over again. Disclosure: No positions Complete Story »
|
| Posted: 24 May 2010 09:00 AM PDT Simplicity and honesty are essential investment attributes. Complexity and deception are fatal. Most publicly traded financial firms, for example, reside at the complex and deceptive end of the investment spectrum. They are complicated and highly leveraged…which means the chances of a costly deception (whether intentional or accidental) are very high. The corporate histories of Countrywide Financial, Washington Mutual, Lehman Bros. and Bear Stearns illustrate the point. But we do not gather here today to mourn the dead; rather to scorn the living. In this case, Goldman Sachs. Once upon a time, Goldman Sachs was a revered moneymaker – the can-do golden child of Wall Street. During the 1990s, Goldman was the American financial firm nonpareil. Its over-the-top success epitomized the feel-good vibe of the market. Accordingly, Robert Rubin, the former CEO of Goldman Sachs joined the Clinton Administration to become one of the most admired Treasury Secretaries of all time. But then things changed. The stock market slumped, the housing market tanked and the economy stumbled. Through it all, Goldman Sachs made money. Lots of it. This one fact angered politicians and average Americans alike. "How dare Goldman Sachs make so much money by betting against the housing market, while so many average Americans were losing their homes!" the hoi polloi exclaimed. But making money is no crime…unless you are committing crimes to make money, which is exactly what the SEC's suit against Goldman Sachs alleges. According to the SEC's complaint, Goldman failed to disclose material information about a security it sold to clients. The SEC calls that "fraud" – always has, always will. Berkshire Hathaway's Warren Buffett, along with other Goldman cheerleaders, assert that the company did no wrong. "Goldman is in the business of buying and selling securities for profit," the cheerleaders declare. "It has a duty to its shareholders." This argument misses the point. The only point that matters is this: Beauty is truth; truth beauty. It's true that Goldman Sachs not only possesses the right, but the obligation, to make money for its shareholders. But it's also true that this obligation is subordinate to Goldman's fiduciary obligation to its clients. In other words, clients first; shareholders (and options-laden management) second. As one of America's largest purveyors of toxic collateralized debt obligations (CDOs), Golden played the role of financial cigarette salesman. Nothing wrong with that…so far. But this particular cigarette salesman took out insurance policies on its biggest customers. Okay, so maybe that's a bit morally ambiguous, but it is still perfectly legal…as long as the cigarette salesman didn't lie to his customers about the potential consequences of smoking cigarettes. But Goldman did lie. To continue our metaphor, Goldman not only "whited out" the Surgeon General's warning on every pack it sold, it also substituted its own warning that read something like: "These cigarettes are full of sugar and spice and everything nice, just like little girls." Goldman informed its clients that John Paulson – the guy who secretly helped construct the Abacus CDO that is at the heart of the SEC's complaint – was a large buyer of this security, when in fact he was a large short-seller of the security. That was a lie. Importantly therefore, Paulson did not utilize his legendary expertise of the CDO market to select the securities that would succeed, he used his expertise to select the securities that would fail. Goldman's failure to disclose this very material fact was a fraud…big time. If Goldman had merely informed its customers that the "cigarettes" it sold were full of "frogs and snails and puppy dog tails" and/or that the guy who helped select the securities comprising this particular CBO was selling it short, Goldman could have purchased life insurance on its customers all day long in full compliance with every applicable securities law. Every seasoned investment advisor and securities lawyer – or investment bank – understands that the SEC's Everest of regulations and no-action letters would boil down to three words: "Disclose, disclose, disclose." Disclosure is the key component of almost every statute. And it would be impossible to be in a position of power and influence on Wall Street without understanding this fact. A failure to disclose is the essence of the SEC's complaint against Goldman Sachs. And if, as your editor suspects, additional SEC charges emerge, "Failure to disclose" will likely play a key role in those as well. No one is exempt from this obligation – least of all the only financial firm that is a major market maker in all of America's largest financial markets. The "remedy" to this problem is not complex. Enforce the laws that exist. Insist on disclosure. Prosecute those who don't disclose. The financial markets do not need "more regulation," they need the same old regulation they've already got…rigorously and blindly enforced. Justice possesses too much eyesight. She needs to put her blindfold back on – and ditch her "Goldman" golf cap – and let a dispassionate analysis of the facts lead wherever it may. Whatever the outcome of the Goldman prosecution/inquisition, we investors must insist on truth or stay away. The best investments are those that are easy to understand…and trustworthy. Both Goldman and Greece would fail this simple test. Our advice: stay away from both of them. "Sell risk, buy caution. Sell complexity, buy simplicity," your editor advised in a July 2008 presentation to the Vancouver Investment Symposium. "The Era of Peak Greed is over; the Era of Caution is upon us. That's not such a bad thing. Caution sounds boring, but it's not nearly as boring as it sounds. In fact, I think being cautious is kind of an uncelebrated virtue. It's a little bit like being free of venereal disease. You can't really brag about it at a cocktail party, but it's still a pretty darn good thing at the end of the day." Two months after this presentation, Lehman Brothers came crashing down, and the entire investment world learned to its chagrin about all the mortgage-backed detritus the nation's banks had been squirreling away on their balance sheets. Lots of risk; lots of complexity…amplified by lots of leverage. Share prices have improved dramatically since the lows of one year ago, but many of the deceptive structures that created the financial crisis remain in place. The financial sector remains a minefield of complexity, leverage and questionable pricing of balance sheet assets. In other words, the risks remain because the deceptions remain. Therefore, sell risk, buy caution. Sell complexity, buy simplicity. Place your hard-earned investment capital in the hands of individuals who will respect and reward it; not in the hands of individuals who will abuse it. Eric J. Fry Beauty is Truth, Part II originally appeared in the Daily Reckoning. The Daily Reckoning, offers a uniquely refreshing, perspective on the global economy, investing, gold, stocks and today's markets. Its been called "the most entertaining read of the day."
|
| Posted: 24 May 2010 08:49 AM PDT Gold pops higher again on euro concerns The COMEX June gold futures contract closed up $17.90 Monday at $1194.00, trading between $1176.80 and $1195.90 May 24, p.m. excerpts: see full news, 24-hr newswire… May 24th's audio MarketMinute
|
| Preferred Stock ETFs, High Yield Bond ETFs: Are They Flashing Signs of Increased Risk-Taking? Posted: 24 May 2010 08:35 AM PDT  Gary Gordon submits: Gary Gordon submits: The “euro-dollar” sits near a four-year low. Perhaps that’s good for European exporters, but few seem to think broad regional European stocks are worth the risk. China’s willingness to curb double-digit GDP to slow above-trend inflation and excessive housing speculation makes long-term sense. Short-term, though, equities may struggle during the tightening process. Moreover, resource-rich countries that serve China’s demand must contend with that slower growth. Complete Story »
|
| Posted: 24 May 2010 08:30 AM PDT Frederic Ruffy submits: SentimentStocks are trading mixed on a relatively slow news day Monday. The major averages opened modestly lower and once again tracked European benchmarks to the downside. However, the action had turned mixed midday, with strength in the tech sector helping to lift the Nasdaq. Housing related names also showed relative strength on better existing home sales numbers (See Bearish Flow). However, persistent worries about the European Debt Crisis are keeping a lid on any real rally attempts. The industrial average is down 85 points heading into the final hour. The tech-heavy Nasdaq is flat. The CBOE Volatility Index (.VIX) is down 2.89 to 37.21 and trading in the options market is much slower than in recent days. About 6.2 million calls and 5.6 million puts traded so far. Bullish FlowDow component Hewlett Packard (HPQ) is off 41 cents to $46.17 and one player collects $2.13 on the Jan 40 put – 60 call “risk reversal”, 8000X. They sold puts at $3.03. The risk reversal was tied to 363K shares at $46.35. 10K now traded in both contracts, but less than existing open interest. So, today’s action might close a bearish reversal. However, it’s interesting to note the same play was initiated 10000X on May 12 to open new positions, at 82 cents. The activity surfaced six days ahead of HP earnings. Shares are down 1.3 percent since those results were reported on May 18. This strategist might view the weakness as an opportunity for a bullish trade, and is selling puts, buying calls as a cheaper way to play the stock. Complete Story »
|
| Nouriel Roubini: From Macroeconomic Visionary to Reflexive Crank Posted: 24 May 2010 08:22 AM PDT  Tom Brown submits: Tom Brown submits: As the cycle turns higher, Nouriel Roubini is returning to his role as a reflexive, tendentious crank. Dr. Doom was in classic form in BusinessWeek last week in his interview with Charlie Rose. Some highlights, along with some comments from yours truly. [Emphasis added]:
Complete Story »
|
| Weekly Market Calendar - May. 24-28 Posted: 24 May 2010 08:14 AM PDT SA Editor Mohit Manghnani submits: Monday, May. 248:30 Chicago Fed National Activity Index • Notable premarket earnings: CPB, YGE Complete Story »
|
| Mutual Fund Monday Phenomenon Ends As Monday Close Is Mirror Image Of Friday Posted: 24 May 2010 08:06 AM PDT Just as Friday saw a massive ramp in the last 30 minutes of trading, so Monday saw a mirror image of Friday's half an hour action, once volume picked up in ES toward the end of the day. And with that the most ridiculous statistical phenomenon in recent history, better known as the Mutual Fund Monday ramp, is now over. This is bad for algos as yet another reliable correlation ends with a bang.
|
| 'Flash Crash' Highlights Differences in Way Mutual Funds, ETFs Operate Posted: 24 May 2010 08:05 AM PDT Tom Lydon submits: The market’s sudden drop on May 6 was stunning for investors to watch. While it had a far-reaching effect, it primarily has thrust ETFs into the spotlight. But is that fair? Chuck Jaffe for MarketWatch reports that the meltdown only highlighted the differences between ETFs and mutual funds, showing why some investors may choose one or the other: Complete Story »
|
| BP (NYSE:BP) — Is BP Too Big to Fail? Posted: 24 May 2010 08:00 AM PDT London-based BP (NYSE:BP), is the world's third largest public oil and gas company. However, positioned at the heart of the oil leak in the Gulf of Mexico, and with a weakening market cap now around $130 billion, the question must be asked… is BP too big to fail? To answer the question we turn to Byron W. King, Agora Financial's editor of Outstanding Investments, who has explored exactly this topic in his letter to readers today: "Keep in mind, though, that BP is a critical part of the U.S. energy system. By extension, BP is important to the U.S. government and national energy policy. "The fact is that BP is the largest oil producer in the U.S., at over 400,000 barrels per day just from the Gulf of Mexico. Up north, BP has a dominant position at Prudhoe Bay, Alaska, a field that lifts about another 400,000 barrels of oil per day. BP has a controlling interest in the Alaska Pipeline. "Then there's BP's nationwide, downstream refining and product-marketing system. Think about how many cars, trucks, buses, railway locomotives and airplanes run on BP fuel, delivered under one contract or another. Try sorting that mess out if BP goes down hard. "Consider that BP is a large, global concern. Every day, across the world, BP produces about 4 million barrels of oil equivalent (BOE). That's about 4.7% of the world's liquid energy supply. Also, BP has 42 major, new oil projects under development, and scheduled to be online by 2015, producing another 1 million BOE per day. Screw that up by putting BP out of business, and we'll probably see those $200 per barrel oil prices sooner than we thought… "…If push comes to shove, you should expect that BP will have the full backing of the UK government. BP is a huge employer in Britain. BP pays an immense amount of taxes to the UK government, and the UK government needs those funds. Pres. Obama may have returned a bust of Winston Churchill to the British, early in his presidency. But the British will want Obama's head on a platter if BP goes down under his administration. "Right now, the dividend yield for BP is 7.4%. That's nice, but the high return probably includes the risk that the BP board will — sooner or later — slash the dividend. It would be unseemly for BP to be paying large dividends, at the same time that it's also diverting funds to well-control and cleanup costs, not to mention handling damage claims. So the dividend is no longer safe, in my view. "Here's something else. BP may as well change its business model to include being a professional defendant. In years to come, BP will devote immense amounts of money and management time to litigation. "BP may even have a hard time making future energy development deals, due to the Deepwater Horizon legacy issues. I can hear it now. 'Oh yes, you're the company that blew out that well in the Gulf of Mexico.' The image problem may extend to BP having a hard time recruiting talent in years to come, due to the stigma. "So we come back full circle to that question. Is BP too big to fail? I don't think BP will 'fail.' That is, BP is going to 'pay' but not fail." King recognizes the damage to BP's reputation and credibility that this disaster has caused. Yet, he also sees the firm as too important to the UK government as a taxpayer, and to the US as a producer, for this leak alone to destroy BP's future prospects. To keep following King's evolving perspective on BP in Outstanding Investments you should visit the Agora Financial reports page, found here. Also, keep in mind that Byron King will be speaking live in person at the Agora Financial Investment Symposium taking place in Vancouver during the month of July. You can register for the event here. Best, Rocky Vega, [Nothing in this post should be considered personalized investment advice. Agora Financial employees do not receive any type of compensation from companies covered. Investment decisions should be made in consultation with a financial advisor and only after reviewing relevant financial statements.] BP (NYSE:BP) — Is BP Too Big to Fail? originally appeared in the Daily Reckoning. The Daily Reckoning, offers a uniquely refreshing, perspective on the global economy, investing, gold, stocks and today's markets. Its been called "the most entertaining read of the day."
|
| Trading in Precious Metal ETFs Hits All-Time High Posted: 24 May 2010 07:54 AM PDT Tom Lydon submits: The markets are still feeling the fear of a contagion effect from Europe’s debt problems. It has sent gold prices to new records and trading in exchange traded commodities (ETCs) to all-time highs. It’s a full-on trading frenzy. Market fears have pushed gold to record prices this month while ETF Securities‘ popular platinum and palladium funds saw heavy outflows. ETF Securities now says that trading volumes in ETCs are up more than 90% in the last month alone and that 70% of the surge is because precious metals trading. Another 50% is attributable to gold, reports John Kenchington at The Financial Times. Complete Story »
|
| Guest Post: Growing Revolutionary Guard Spells Uncertainty For Oil Investors In Iran Posted: 24 May 2010 07:33 AM PDT Submitted by www.oilprice.com Growing Revolutionary Guard Spells Uncertainty For Oil Investors In Iran Source: http://oilprice.com/Geo-Politics/Middle-East/Growing-Revolutionary-Guard-Spells-Uncertainty-For-Oil-Investors-In-Iran.html
|
| San Fran Fed On "Lessons [Un]Learned" From Loss Provisions And Bank Charge-offs Posted: 24 May 2010 07:25 AM PDT One of the very few "green shoots" pertaining to our extremely unstable financial system, that had been greeted by bulls far and wide was the alleged decline in loss provisions and charge-offs by banks and credit card companies in recent months. In fact, JPMorgan's rose-colored commentary on trends observed in this area during Q1 was supposed to be the catalyst to push financials to a new high during this earning season, until we uncovered that Europe is broke, and that everyone decided to sue Goldman, which had a slightly more adverse reaction on stocks. Amusingly enough, and in confirmation that no lessons have been learned, the San Fran Fed has released a mistitled paper called "Loss Provisions and Bank Charge-offs in the Financial Crisis: lesson learned" which confirms that banks are once again blindly rushing to repeat the very same mistakes that were part and parcel of the array of flawed judgments that led to the bursting of the credit bubble built on a house of cards of good intentions and optimistic projections. The paper concludes: "The recent financial crisis and recession have painfully demonstrated the vulnerabilities associated with the bank loss-provisioning process. It’s clear that provisioning should be more forward looking. However, even a more forward-looking provisioning process would not have fully addressed bank vulnerability to the extraordinary events of the past few years. By definition, loan loss reserves are designed to absorb expected losses. Even if banks had better forecasts and more discretion in setting reserves, they would probably still be unable to adequately provision against unexpected large economic shocks. Guarding against such shocks is the role of capital. The lesson of the financial crisis is that the buffer against downside risk must come in the form of higher bank capitalization." Amusingly, just as various amendments seek to cut regulatory cap ratios, banks are once again rushing to lower their loss provisions, soundly refuting the FRBSF's thesis that the US financial system can ever learn from anything that occurred more than 24 hours prior. We are confident that as the "priced to perfection" scenario unravels, even such overly optimistic captains of industry as Jamie Dimon will once again be forced to readjust their loss provisions materially higher, leading to a new regime in financials, in a direction which however will not be to the bulls' liking.
|
| Put On Your Selling Shorts This Summer Posted: 24 May 2010 07:00 AM PDT We've seen an almost complete reversal of market momentum, with the 'deflation trade' of late 2008 once again growing popular:
Thing is, moves to the downside often unfold five or 10 times faster than rallies – a sign that there's little desire to buy into weakness. The decline in risky assets has been violent. Treasury securities – of which there will never be a shortage – have been bid up aggressively. Yields on 10-year Treasuries have declined from 3.9% to 3.2% in a little over a month. This adds to the anecdotal evidence that carry trades – shorting Treasuries and buying corporate bonds and stocks – funded much of the rally in the S&P 500. This summer should be the best environment for short selling we've seen since early 2009. Dan Amoss Put On Your Selling Shorts This Summer originally appeared in the Daily Reckoning. The Daily Reckoning, offers a uniquely refreshing, perspective on the global economy, investing, gold, stocks and today's markets. Its been called "the most entertaining read of the day."
|
| Posted: 24 May 2010 06:45 AM PDT With hundreds of amendments crammed into the Senate version of Financial Reform, the dust is only now settling on what the impact of all these will be for Wall Street firms. One of the less discussed amendments is that of Maine Senator Collins, which would result in the disqualification of Trust Preferred Securities from Tier 1 regulatory capital, and which if passed into law, will trim about $108 billion from bank holdco Tier 1 capital, an amount which is about 13% of the "Big 4" banks' total Tier 1 capital according to Moody's. The resulting need to shore up bank holdco balance sheets would be substantial and would require additional equity infusions and/or debt dispositions, as well as more FASB suspensions of various Mark-To-Market rules. Additionally, the enactment of this amendment would likely result in future downgrades of holdcos by discredited rating agencies such as Moody's. Here is Moody's itself discusses this potential hit to Tier 1 capital in detail:
h/t Nolsgrad
|
| Too Big to Fail Means Too Big to Exist Posted: 24 May 2010 06:41 AM PDT Dear CIGAs,
Both the House of Representatives and the Senate have passed their versions of financial reform legislation. Now, the process of reconciliation takes place between both bodies of Congress to iron out a final bill the President can sign into law. There is plenty in the bill such as new consumer protection, increased power given to regulators to prevent systemic risk, and new powers to oversee the $600 trillion derivatives market. These are just a few of the highlights, and there is no telling what will actually end up in the final bill. (The derivatives problem alone can kill the U.S. economy. I wrote about this in a post called "Can The Financial System Really Be Fixed? Some Say No.") "Too big to fail" The most important issues that could cause another financial crisis are not covered in the pending legislation. The biggest problem is the enormous size of the institutions being regulated. "Too big to fail" means they are simply too big, and shrinking them is not on the table. Last month, Senator Sherrod Brown (D-Ohio) explained the size problem this way: "Fifteen years ago, the assets of the six largest banks in this country totaled 17 percent of GDP. The assets of the six largest banks in the United States today total 63 percent of GDP, and that's too (big)–we've got to deal with risk to be sure, but we've got to deal with the size of these banks, because if one of these banks is in serious trouble, it will have such a ripple effect on the whole economy." After the Senate passed its version of financial reform, Representative Alan Grayson said, "Too big to fail means too big to exist. We have to systematically dismantle the institution that caused the systemic risk to the economy and that, for sure, the Senate bill does not do." I don't see any way we are going to see a breakup of the banks. There are some amendments that will force banks to spin off risky trading operations. The banks are against any trading restrictions or spin-offs. So, getting that into a final bill is going to be tough. I don't think the big banks will get appreciably smaller until after the next meltdown, and one is coming sooner than later. Big institutions take big risks. There was a time when banks were not allowed to take on too much leverage. The max was about 10 or 12 times capital. During the Bush Administration, the caps on leverage were unlocked and banks took on insane amounts of risk. During the last financial crisis, it was not uncommon for banks to be leveraged 40 times capital (sometimes even higher!) The pending financial reform legislation doesn't really address limits on leverage. To be fair, President Bill Clinton signed into law the Gramm-Leach-Bliley Act (GLBA) in 1999. That legislation repealed the Depression era laws of the Glass-Steagall Act and allowed banks to have unlimited growth and take on much more risk. Without GLBA, also know as the Financial Services Modernization Act, the banks would have never grown "too big to fail." Fannie and Freddie Neither the House nor Senate bills address failed mortgage giants Fannie Mae or Freddie Mac. The government took over these two institutions in 2008. They have a combined taxpayer liability of more than $6 trillion! There is not a mention of reform or how we are going to budget for this slow motion train wreck. I guess if Congress just ignores a problem, it doesn't exist or it will vanish all on its own. Omitting this from financial reform legislation is too stupid to be stupid. The Fed gets more power! Finally, the big winner in all of this is the Federal Reserve. The regulator who stood by and watched as the financial system spun out of control is going to be rewarded by getting more power! These are the same people who fought regulation of the derivatives market and pushed for repeal of the Glass-Steagall Act. The Fed will likely get authority to oversee a new consumer protection division for businesses such as mortgages and credit cards. Also, the Fed will supervise the biggest and most complex financial companies. This is like the proverbial fox guarding the hen house. The pending legislation may force an audit of the central bank, but I wouldn't count on any meaningful look at the secret deals of the Federal Reserve. I hope I am wrong. Congressman Grayson recently summed up the importance of financial reform by saying, "We have a basic choice we have to make. Do we want a government of the people, by the people and for the people, or of Wall Street, by Wall Street and for Wall Street? It is disturbing how much this government is by Wall Street and, therefore, you end up with bills that are for Wall Street."
|


 Duration is a measure of how long, in years, it takes for the price of a bond to be repaid by its internal cash flows. It is an important measure for investors to consider, as bonds with higher durations carry more risk and have higher price volatility than bonds with lower durations. As a result, two Government Bond ETFs with ultra-long durations, Vanguard Extended Duration Treasury ETF (
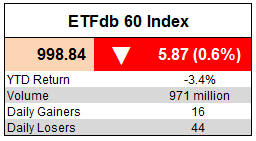 The
The  "People are going back to the perceived safety of gold because the euro is getting pummeled," said Matt Zeman, trader at LaSalle Futures Group. "People who were forced to liquidate last week to meet margin calls are coming back in." The euro fell as much as 1.8% against the dollar after the Bank of Spain appointed a provisional administrator to run CajaSur, a savings bank crippled by defaults on property loans. "People are worried that the Spanish lender is the first in a long line of dominos to fall," Zeman said…


| You are subscribed to email updates from Gold World News Flash To stop receiving these emails, you may unsubscribe now. | Email delivery powered by Google |
| Google Inc., 20 West Kinzie, Chicago IL USA 60610 | |
No comments:
Post a Comment