


saveyourassetsfirst3 |
- Belgium “Adds” Another $40 Billion Of Treasuries – Russia Is The Seller – The Fed Is The Buyer
- Future For Gold As Uncertain As It Is Certain. Silver Will Lead/Follow.
- Mining Shares Looking for Friends
- PM Fund Manager: Smoking Gun on The Fed’s Money Laundering T-Bond Purchases
- PM Fund Manager: Smoking Gun on The Fed’s Money Laundering T-Bond Purchases
- How Long Can Phase II of the Gold Pool Be Sustained?
- At big-ticket dinners, a blunt Bernanke sounds theme of low rates
- U.S. demand may derail nuclear talks
- Two King World News Blogs
- Babe Ruth Hits Another Homer in Auction for his Gold Watch
- Alasdair Macleod: Technical analysis vs. value in gold
- New Indian Government Seen Easing Gold Import Rules But Not Right Away
- How Long Can Phase II of the Gold Pool Be Sustained?
- Exeter Resources: Investors Should Expect A Higher Share Price Or A Buyout
- Links 5/16/14
- Randy Wray: What are Taxes For? The MMT Approach
- Current Problems Associated with the End of the Third Industrial Revolution
- Jim Willie: Germany Preparing Gold-Backed Nordic Euro!
- Potential Catalyst for Precious Metals
- Beneath The Headline Reports, Housing Starts Data Appear Bearish
- May 16.2014/slight decrease in gold inventory at GLD/no change in silver/gold holds steady/silver down in price/India will now have a gold friendly prime Minister/Putin visits China next week in order to cement "holy grail" gas deal/
- Gold Is Forming A Golden Triangle. Major Breakout Coming?
- Alasdair Macleod on Technical analysis versus value in gold
- Was Silver In a Bubble in 2011?
| Belgium “Adds” Another $40 Billion Of Treasuries – Russia Is The Seller – The Fed Is The Buyer Posted: 17 May 2014 11:30 AM PDT
Reports broke this week that Belgium had added another $40 billion worth of US Treasury bonds. The buyer of these bonds is undoubtedly the US Fed. The Fed engaged in a large dollar/euro currency swap facility with the ECB (European Central Bank) a few years ago. It is highly probable the dollars were used [...] The post Belgium "Adds" Another $40 Billion Of Treasuries – Russia Is The Seller – The Fed Is The Buyer appeared first on Silver Doctors. |
| Future For Gold As Uncertain As It Is Certain. Silver Will Lead/Follow. Posted: 17 May 2014 10:12 AM PDT Based on several thousand years of history, and based on the last 100 years of fiats, gold will continue to rise as a store of value, and almost all fiats will fail, massively. Which fiats will continue? The Yuan and the Ruble, for two. The Panama Balboa is another possibility, but Panama will have to do some sorting out to get rid of the fiat US dollar, its paper currency. The official money of account is the Panama balboa, but it ceased printing around 1941, in favor of the US dollar. This little Central American country has been making preparations to disassociate from the fiat Federal Reserve Notes. For all the gold China has been accumulating this past decade, it is unlikely that China will back the yuan by gold. It would be too problematic for what it would do to its economy. Russia has been a lesser buyer of gold, but it also has tremendous reserves that it mines every year, adding to its holdings. Its natural gas resource has taken center stage as a backing for the ruble. Russia will also unlikely want to back the ruble by gold. There have been numerous articles from reliable sources that have been calling for a new gold-backed currency to replace the waning Federal Reserve petrodollar as the world's reserve currency, many thinking a gold-backed yuan as a prime candidate. In this regard, gold's future is uncertain. It will undoubtedly play a significant role, but not likely linked to one specific country as a new world reserve currency. From the solidifying financial and economic ties between China and Russia, China and several other natural resource rich countries, and the BRICS alliance, a strong possibility lies in contractual ties amongst all these countries, and not a single nation gold-backed currency. A perfect example is what will likely be concluded next week between China and Russia, the largest ever natural gas deal. The deal is between Russia's Gazprom and China National Petroleum Corporation. All that needs to be finalized is the price. What will decidedly not be a part of the deal is any Federal Reserve Dollar as a part of the pricing mechanism, nor any use of the fiat "dollar." Expect to see more and more international dealings by Eastern and BRICS nations that preempt the soon-to-be-former world reserve "dollar." Obama does not "speak softly," nor does he carry a "big stick." ["Speak softly and carry a big stick," was first used by Theodore Roosevelt when he wanted Congress to increase the amount of money he needed to carry out and define his foreign policy, using "diplomacy" backed by military might, America's [outdated] foreign policy to this day.] So Obama's sanctions and threats against Russia ring hollow, and all parties concerned know it. Russia has more than enough natural resources and more than enough willing customers to not worry about Obama, the US, or its fiat "dollar." Russia's Ministry of Finance has already announced plans to use the ruble in all future contracts as Russia takes more steps toward "de-dollarization." China has been acting in a similar capacity as it has been making deals with several other countries, outside of the "dollar." Prior to the Rothschild elites forcing the US into official bankruptcy in 1933, [from which point in time forward, the US has been owned by a few select international bankers...a fact about which almost all American remain ignorant], prior to 1933, the US used gold as a backing in it contracts with other nations, so there is a viable history for using gold, and any other natural resource, [oil, copper, natural gas, as a few other examples] as an integral part of contracts and foreign exchange. The deal with China may require backing with gold, to some degree, as a guarantee. There may be a clause that exchanges yuan or rubles for gold, silver, copper, etc, without the necessity of any country having a gold-backed currency. A soon-to-be relegated-to- third-world-status country, like the United States, would not be able to participate, by virtue of the fact that it will be unable to bring anything to the bargaining table. All other countries will engage based upon a relatively hard currency and/or a natural resource to act as collateral. China, Russia, Panama, other BRICS, Turkey, Iran, et al, can keep their fiat currency, but simply back up any contract with acceptable collateral, oil for gold, gold or some acceptable equivalent for whatever is being sold. This will eliminate the stronghold that the US and UK have maintained for the past century, and the military might will become a whisper of what it used to be. For now, however, the military remains very much a tool of desperation as the once mighty West continues its unabated slide into a decline from which it cannot recover. The time frame between now and then remains an unknown, and it is very likely that the elites will cause major disruptions, like Ukraine, aiming for what it knows best, profitable war. Countries and people suffer, but the Rothschild formula for creating chaos, leading to war, provides incredible wealth for themselves. With the US Gestapo Homeland Security purchasing billions of bullets, 7,000 NATO personal defense weapons, aka the kind of assault weapons used by civilians that the Obama/United Nations wants to outlaw, and now the Department of Agriculture wanting to buy submachine guns, it is very apparent that the elite-controlled corporate federal government is preparing for war…against Americans in their own country. This will not end well, and perhaps for the first time, the ravages of war will be confined to the US. Over a year ago, we were going to do an article on the Department of Homeland Security, [If you guess the Homeland to be secured is the US, you would be wrong. The Homeland to be secured, at all costs, is the corporate federal government.] The reason for not doing the article was the content, the fact that Homeland Security has hundreds of "camps" around the country, where, thanks to the Bush Patriot Act and Obama's National Defense Authorization Act, on top of the 1933 amendment to the Trading With The Enemy Act, [the Amendment made U S citizens the enemy within their own country...read the Act.], the corporate federal government can declare anyone an enemy and held without rights of any kind, and for any duration. Think of Guantanamo Bay coming to roost on US soil. There was more. Homeland Security has also purchased tens of thousands of caskets, stacked up, row after row after row. Draw your own conclusion as for whom they are intended. No country at war has a history of bringing back war victims to be buried in special camps. The uncertainty for the role of gold has yet to be defined. Expectations for a gold-backed currency may be misplaced. It could happen, but it seems unlikely that the largest holders of gold have an interest in putting themselves at an economic disadvantage by pricing out their exports. However, within whatever the realm of uncertainty for gold's specific role is, it will undoubtedly remain pivotal. Rising from the ashes of central banker suppression for the past several decades, it is certain that the price will go higher. Will it be $10,000, or as high as $50,000 the ounce, the price range so often speculated on as its next level of price reality? Who knows? It will be determined by a freer market than it has been for over eight decades, or more. Regardless of where the prices of both gold and silver finally reach, it should not matter to anyone who is prepared. The best way to participate is to be prepared. The best way to be prepared is to already own physical gold and silver. The handwriting is on the wall. Western fiats are destined to fail, not next week, not next month, maybe not even this year, but failure is coming, and the unelected European "officials" are doing whatever they can to steal whatever they can get away with. In the United States, the foreign-owned Federal Reserve has been stealing wealth through the harder to detect, but equally as insidious inflation. With the fiat Federal Reserve Note worth about 3 cents today, relative to 1913 dollars, that means the Fed stole 97 cents of every dollar over the past century. If you do not understand inflation, it is the debasement of money, and the value debased goes to the benefit of the issuer. The Fed does nothing if it is not for its own benefit. Expectations that gold would respond to the Rothschild-inspired, US-led Ukrainian situation have been proven wrong. For as long as the US/UK/EU troika can exert any degree of control over those governed, for as long as central bankers control all Western countries and fiat purse strings, gold and silver will remain in their bottoming phase, and the bottoming process can last for longer than most expect. Neither gold nor silver appear to be turning up, and for that look, we turn to our favorite topic, charts. If gold or silver appear to be unresponsive to known news, be it how much China is buying, potential war breakout in Ukraine, financially flagging EU, the US losing control on so many fronts, it is because both are still under the control of relatively unseen forces that continue to exert pressure, like a helium-filled balloon being kept under water. Many say that the charts are irrelevant, but no one is pointing to anything else that is. For as long as we have been following markets via charts, those of gold and silver have told the most accurate story in the face of news and events that would suggest otherwise. Before gold can rally, it has to first turn the trend from down to up. We see no evidence of a change in trend. The bearish spacing is repeated, again, as a reminder that it represents a weak market within its down trend. How anyone can posit a bullish scenario from what the charts show flies in the face of known facts, as depicted in the charts. The biggest fact upon which almost all can agree is that the trend remains down. Within that context, there are slight signs of bottoming activity, such as the current two month TR holding near a 50% retracement of the last swing low to swing high. For this to occur in a down market is a plus; not enough to turn the trend, but what could lead to a change in trend. Also, within the past two months the weekly closes are clustering, a sign of a pause before the previous trend resumes, or a resting period that can begin a market turn. For now, there is no confirmation, either way. The shorter perspective of a daily chart indicates a recent up trend that has turned neutral. The most important elements for reading developing market activity in any charts are price and volume. Everything else can almost be ignored. Three weeks ago was the 3rd highest volume of the month, occurring on a lower close, indicating sellers "won" the battle for that day. Volume is important. The volume increase should lead to a lower market. Yet, when you look at that specific day, it was an inside day, relative to the previous up day. The question to ask then is, why did all of that increase in volume not take out the low of the previous day, and why was that day's range slightly narrower? While sellers won the battle that day, in context to the increased volume, it was buyers that prevented the effort of the sellers from achieving a lower level. Friday was a lower low, but notice this time, volume declined, and the close was mid-range the bar, a stand-off between buyers and sellers, but more of an edge to buyers for stopping the momentum of the sellers. Price closed just about dead center of the two month TR, and that says balance. From balance comes unbalance, and the further price moves along the RHS, [Right Hand Side], of a TR, the closer is the TR resolve, in either direction. Instead of having to guess in which direction price may move, it is better to be prepared for either event and then act accordingly. From the August 2013 swing high, price went into a protracted and labored retreat until the beginning of February 2014. After a three-week rally, from the February swing high, price once again was in a labored 12 week decline. When it takes sellers four times as long to correct a market that is in a clear down trend, it tells us sellers are generally weak. Last week, it was mentioned that when an area is continually retested, it becomes weaker and subject to being broken, unless buyers, in this instance, can show more strength. A look at a more detailed daily chart may be helpful in getting greater clarity on the chance of silver make a new recent low. There have been a few attempts to sell silver to yet lower levels, since late April, and on each occasion, silver was able to rebound and close well on strong rally days. One would not expect to see that kind of relative strength in a down market. The decrease in trading volume on Friday indicates relative weakness by sellers for not being able to drive price lower than occurred. Price needs to get above 20, and hold, if buyers want to wrest control from sellers. If not, sellers will see this buyer inability, and that may prompt sellers to try for new lows. Silver will also be certain in seeing eventual higher prices. With the gold/silver ratio at the high end, favoring gold, and silver tending to lead PM rallies, silver could outperform gold to the upside, once the trends change. For this reason, silver may be the one to watch. |
| Mining Shares Looking for Friends Posted: 17 May 2014 09:58 AM PDT Here is the weekly price chart of the HUI. It did not end the week on an encouraging note, with the close being the lowest since the week of January 27 this year. As such, it is in serious danger of falling further and testing the support zone noted on the chart beneath it.  For the bulls to be able to have the least chance at mounting something to the upside, the downsloping trendline will need to be breached. That could form the basis of an actual reverse head and shoulders pattern but the big downside gap that formed last year in April near 300 would have to be closed for any serious upside fireworks to occur. The pattern of lower highs since that month is suggesting that a "Sell the Rally" mentality currently exists in the mining sector. Downside support is also suggesting value-based buying is taking place but the question is whether or not these buyers have sufficient clout to ward off opportunistic sellers. The index is range trading with bears having a minor advantage for the time being. With the ETF, GLD, losing gold, and with this continued weakness in the mining shares, the signals are not promising for the moment. Time will make things a bit clearer but for now, this sector has fallen out of favor with investors. |
| PM Fund Manager: Smoking Gun on The Fed’s Money Laundering T-Bond Purchases Posted: 17 May 2014 06:41 AM PDT
|
| PM Fund Manager: Smoking Gun on The Fed’s Money Laundering T-Bond Purchases Posted: 17 May 2014 06:37 AM PDT
 Precious Metals Fund Manager Dave Kranzler joins the show this week to discuss: Cartel capping gold at $1300 and silver at $20 London silver fix to end in August after 117 years- is the end of the silver manipulation at hand? Kranzler discusses the Smoking Gun on The Fed’s money laundering US Treasury purchases through [...] The post PM Fund Manager: Smoking Gun on The Fed’s Money Laundering T-Bond Purchases appeared first on Silver Doctors. |
| How Long Can Phase II of the Gold Pool Be Sustained? Posted: 17 May 2014 05:11 AM PDT "The current situation won't last indefinitely" ¤ Yesterday In Gold & SilverExcept for the fact that "da boyz" and their algorithms showed up at the New York open, it was pretty much a nothing sort of day in the gold market yesterday. With the gold price on an obvious very tight leash, it was a given that the price wasn't going to be allowed above the $1,300 spot price mark, or the 200-day moving average. The high and low ticks were recorded by the CME as $1,298.30 and $1,287.70 in the June contract. Gold finished the Friday trading session in New York at $1,292.70 spot, down $4.10 from Thursday's close. Net volume was very quiet---only 84,000 contracts. Silver was under a bit more selling pressure in late Far East and early London trading yesterday---and it got hit a bit in early New York trading as well. Ever since the price touched $20 the ounce at the New York open on Wednesday, JPMorgan et al have been chipping away at it ever since. The high and low ticks were reported as $19.53 and $19.255 in the July contract. Silver closed on Friday at $19.345 spot, down 11.5 cents from Thursday. Volume net of May and June was 35,500 contracts. There was also 3,000 contracts traded in September and December---and whether that was roll-over/spread related, is impossible to tell. The platinum price traded within a one percent price range all day on Friday---and closed down three bucks. Palladium was under pressure in early London trading, but rallied sharply around 12:30 p.m BST---and the traded flat for the remainder of the day, closing up five bucks. Here are the charts. The dollar index closed at 80.04 late on Thursday afternoon in New York. It dipped slightly below the 80.00 level a few times, but manged to rally back to unchanged, finishing the Friday session at 80.05. The gold stocks gapped down a bit at the open---and chopped lower for the remainder of the day, closing just off their lows---and the HUI finished down another 1.00%. The silver equities sold off just over a percent at the open---and the chopped higher all day, actually finishing in the black, as Nick Laird's Intraday Silver Sentiment Index closed up 0.23%. The CME Daily Delivery Report showed that zero gold and 63 silver contracts were posted for delivery within the Comex-approved depositories on Tuesday. The only two short/issuers in silver were Jefferies once again, along with ABN Amro, with 38 and 25 contracts respectively. And, once again, it was "all the usual suspects" as long/stoppers, with JPMorgan being the tallest hog at the trough with 42 contracts in total. The link to yesterday's Issuers and Stoppers Report is here. There was a small 8,620 troy ounce withdrawal from GLD yesterday, which I would guess was a fee payment of some kind. And, as of 7:31 p.m EDT yesterday evening, there were no reported changes in SLV. Once again there was no sales report from the U.S. Mint. There was no in/out activity in gold over at the Comex-approved depositories on Thursday and, in silver, there was 613,090 troy ounces reported received---and 24,900 troy ounces were shipped out. The link to that activity is here. I was happy to see that the Commercial net short positions in both silver and gold showed declines in yesterday's Commitment of Traders Report. It wasn't a lot in silver, as the Commercial net short position dropped by only 915 contract, or 4.58 million troy ounces---and now sits at 97.2 million ounces. Ted Butler says that JPMorgan's short-side corner in the Comex silver market remained basically unchanged at 100 million ounces, which represents over 100% of the entire Commercial net short position in silver in the Commercial category. The word "grotesque" is a barely adequate description of this situation. Ted also mentioned that the 10,000 contract non-technical fund long position hiding in the bushes in the Manged Money category hasn't moved an inch, which is wonderful news, as they're obviously in this to make a big killing when we get a price rally of some significance. In gold, the Commercial net short position declined by a respectable 8,150 contracts, or 815,000 troy ounces of paper gold. The Commercial net short position in this precious metal now stands at 10.23 million troy ounces. Ted said that JPMorgan sold 5,000 long contracts during the reporting week---and their long-side corner in the Comex gold market now stands at 36,000 contracts, or 3.6 million troy ounces of the stuff. Here's Nick Laird's "Days of World Production to Cover Short Positions" of the 4 and 8 largest traders on all physical commodities traded on the Comex. And just as a point of interest, JPMorgan's short position in silver is equivalent to about 50 days of world silver production on this chart. I have a reasonable number of stories for a Saturday column, including a couple that I've been saving for most of the week because of content or length issues. ¤ Critical Reads NAR forecasts 2014 existing-home sales won't match last year's tallyStock market investors may have been spooked today by news that Wal-Mart is expecting its smallest quarterly sales growth in almost five years, but the National Association of Realtors issued a rosy housing forecast blaming a “subpar” first quarter in part on “severe weather patterns.” NAR sees sales picking up with “healthy underlying demand” for homes “over the balance of the year and through 2015.” The slower-than-expected spring homebuying season means that, even if there is gradual improvement for the rest of the year, Yun is now projecting that slightly more than 4.9 million existing homes will change hands in 2014, down 3 percent from last year. Factors weighing on the market today include inventory shortages, tight mortgage credit, and rising home prices and mortgage rates. This story showed up on the inman.com Internet site on Thursday---and I found it yesterday's edition of the King Report.  Larry Summers: Fed's 'Low Interest Rates Could Become Source of Instability' Harvard economist Larry Summers, a former top adviser to President Barack Obama, is concerned that the Federal Reserve's easing program could hurt the economy.  At big-ticket dinners, a blunt Bernanke sounds theme of low ratesIn a series of quarter-million-dollar dinners with wealthy private investors, Ben Bernanke has been clearer than he ever was as chairman of the Federal Reserve on his expectations that easy-money policies and below-normal interest rates are here for a long time to come, according to some of those in attendance. Bernanke, who retired from the U.S. central bank in January, has predicted the Fed will only very slowly move to raise rates, and probably do so later than many forecast because the labor market still has a lot more room to recover from the financial crisis and recession. The accounts of the discussions come from attendees as well as those who heard second-hand what was said at the dinners, where hedge fund managers and others willing to foot the roughly $250,000 bill for each event asked the former Fed chairman questions in a free-flowing round-table fashion over recent weeks. Bernanke has no constraints on expressing his views in public or private, providing he does not talk about confidential Fed matters. He declined to comment on any of his remarks at the private events. This Reuters story put in an appearance on their Internet site early Friday evening EDT---and I thank reader Harry Grant for sliding it into my in-box in the wee hours of this morning.  Doug Noland: Nervous Time But when it comes to the Summer of Discontent thesis, let me throw this unappetizing morsel out as food for thought: bear market. Bull markets are all about optimism and self-reinforcing speculation and liquidity excess. Bear markets are the creatures of unmet expectations, disappointment and waning liquidity. I have made the case that desperate monetary stimulus from the world’s central bankers has created a dangerous divergence: inflated and highly speculative securities market Bubbles (and the associated distorted “Truman World” view of reality) versus very real deteriorating fundamental prospects and heightened global risk. I’ve tried to make the case that with Fed balance sheet expansion winding down, the markets have become extraordinarily vulnerable to a bout of “risk off” de-risking and de-leveraging. Huge U.S. firms afraid of blowback from sanctions on Russia over Ukraine crisisU.S. businesses are in fear of a backlash from sanctions on Russia over the current conflict in Ukraine. The Obama administration has stated that it can use economic levies on Russia but the game plan has run into numerous speed bumps, according to analysts. Specialists have pointed out that if the White House reacts in too much of an aggressive way, it could create a blowback for major US firms with close knit ties to Russia's flourishing economy. Should the Obama administration zero in on entire sections of the Russian economy, those very businesses may have no other choice but to face severe losses. Experts claim that prospect exposes the paradoxical limitations of relying on sanctions to show off its American strength, as stated in a Washington Times article. Already, Moscow has decided to ban the US from using the International Space Station after 2020 and block off the export of crucial rocket engines to the US military as an answer to the sanctions which have been more recently put in place. The mounting ordeal is being carefully watched by US executives, including the employees of J.P. Morgan Chase & Co., which made $56 million in investment banking transaction fees alone in Russia during the 2013 year. Pepsico Inc. also has a lot at stake with the Eastern European country, which has been noted as the largest food and beverage firm dealing in Russia since 2011. This news item put in an appearance on The Voice of Russia website on Thursday sometime, Moscow time---and it's the first offering of the day from South African reader B.V.  Edward Snowden and Laura Poitras Take on America's Runaway Surveillance StateOn April 30, in a ceremony at the National Press Club in Washington, the Nation Institute and the Fertel Foundation awarded their annual Ridenhour Prize for Truth-Telling to NSA whistleblower Edward Snowden and filmmaker Laura Poitras. The bestselling author and journalist James Bamford, one of the world’s foremost authorities on the US intelligence community, presented the award to Snowden and Poitras, who were present by live video link. Here are excerpts from their remarks. James Bamford: I’m very honored to be here to introduce two extraordinary people, Laura Poitras and Edward Snowden. Many years ago when my first book about the NSA, The Puzzle Palace, was published, the joke was that “NSA” stood for “No Such joke was that “NSA” stood for “No Such Agency” or, for those on the inside, “Never Say Anything.” Recently I’ve heard from some of my deep-cover sources up at Fort Meade that the old joke has changed. “NSA,” they say, now stands for “Not Secret Anymore.” Having warned of the dangers of the NSA for the past three decades, I very much prefer the latest definition. And no one is more responsible for that than Edward Snowden and Laura Poitras. This essay was posted on the alternet.org Internet site last Sunday---and for content and length reasons had to wait for today's column. It's the first contribution of the day from Roy Stephens.  Bob Mazur: A former undercover DEA Agent who infiltrated The Medellin Drug Cartel Bob wrote a book entitled "The Infiltrator: My Secret Life Inside the Dirty Banks Behind Pablo Escobar's Medellin Cartel".  Hosts Brazil hit by anti-World Cup protestsOfficers in Brazil’s largest city fired tear gas and rubber bullets at protesters who set piles of trash alight. Demonstrators blasted the billions spent to host next month’s soccer tournament and said they wanted to draw attention to what they called a lack of investment to improve poor public services. “We are beginning to gain strength to go against the injustices of the World Cup,” said Luana Gurther, a social sciences student demonstrating in Sao Paulo. “We are the ones who should decide where the public money goes. More funding for schools, hospitals, housing, transportation – not the Cup.” Gurther and a thousand other mostly young protesters gathered on a main business avenue in the city of 11 million, loudly beating drums and cans and raising banners with messages such as “less money for the Cup and more for housing.” This news item showed up on the france24.com Internet site on Friday---and I thank Roy Stephens for his second offering in today's column. Puppetry Canada reduces sanctions against Russia to secure its business interestsCanada abandons some of the imposed sanctions against Russia to save its business interests, putting the US, who initiated the sanctions over the Ukrainian crisis, in an awkward political situation. Thus, Canada has not imposed sanctions against Sergei Chemezov, who heads state-owned industrial and defense conglomerate Rostec, and Igor Sechin, CEO of oil giant Rosneft. Both men have highly-profitable business ties to Canada. Canada, home to 1.2 million people of Ukrainian descent, has imposed sanctions on more than 80 Russian and Ukrainian officials and businesses, compared to about 60 by the United States. Rosneft owns some 30 percent of a Canadian oil field, while Rostec has an aircraft assembly joint venture lined up with Bombardier Inc. The venture is vital to the Canadian plane and train maker, as the fate of a roughly $3.4 billion aircraft sale deal is tied to it. Asked about the decision not to go after either Sechin or Chemezov, a Canadian government source familiar with Ottawa's sanctions strategy told Reuters: "Our goal is to sanction Russia, it is not to go out of our way to sanction or penalize Canadian companies." This article was posted on The Voice of Russia website Friday morning Moscow time---and I thank South African reader B.V. for his second contribution of the day.  Recovery stalls in Europe as austerity grinds onGrowth wilted across large swathes of the eurozone in the first quarter, dashing hopes of durable recovery and prompting demands |
| At big-ticket dinners, a blunt Bernanke sounds theme of low rates Posted: 17 May 2014 05:11 AM PDT At big-ticket dinners, a blunt Bernanke sounds theme of low rates In a series of quarter-million-dollar dinners with wealthy private investors, Ben Bernanke has been clearer than he ever was as chairman of the Federal Reserve on his expectations that easy-money policies and below-normal interest rates are here for a long time to come, according to some of those in attendance. Bernanke, who retired from the U.S. central bank in January, has predicted the Fed will only very slowly move to raise rates, and probably do so later than many forecast because the labor market still has a lot more room to recover from the financial crisis and recession. The accounts of the discussions come from attendees as well as those who heard second-hand what was said at the dinners, where hedge fund managers and others willing to foot the roughly $250,000 bill for each event asked the former Fed chairman questions in a free-flowing round-table fashion over recent weeks. Bernanke has no constraints on expressing his views in public or private, providing he does not talk about confidential Fed matters. He declined to comment on any of his remarks at the private events. This Reuters story put in an appearance on their Internet site early Friday evening EDT---and I thank reader Harry Grant for sliding it into my in-box in the wee hours of this morning. |
| U.S. demand may derail nuclear talks Posted: 17 May 2014 05:11 AM PDT  U.S. demand may derail nuclear talks U.S. demand may derail nuclear talks As diplomats began drafting a comprehensive agreement on the Iranian nuclear program and Western sanctions in Vienna, US officials were poised to demand a drastic cut in Iran's enrichment capabilities that is widely expected to deadlock the negotiations. |
| Posted: 17 May 2014 05:11 AM PDT  Two King World News Blogs Two King World News Blogs The first blog is with market veteran Richard Russell---and it's headlined "Shorts May Get Crushed in the Silver Market". The second interview is with Hong Kong fund manager William Kaye---and it's headlined "We're Headed For An Apocalypse - A Financial Armageddon". [Please direct any questions or comments about what is said in these interviews by either Eric King or his guests to them, and not to me. Thank you. - Ed] |
| Babe Ruth Hits Another Homer in Auction for his Gold Watch Posted: 17 May 2014 05:11 AM PDT  Babe Ruth Hits Another Homer in Auction for his Gold Watch Babe Ruth Hits Another Homer in Auction for his Gold Watch That's one more home run for the Babe. The gold pocket watch George Herman "Babe" Ruth was given at the 25th anniversary of Yankee Stadium in 1948 -- his last appearance there before his death -- is expected to fetch at least $750,000 at auction. The 14-karat pocket watch is the only significant Ruth artifact ever offered directly to the public by the Ruth family. At the ceremony on June 13, 1948, the Yankees retired Ruth's No. 3 uniform and presented him with the gold Longines pocket watch featuring an engraving on the back: “Babe Ruth – Silver Anniversary – Yankee Stadium 1923-1948 ‘The House That Ruth Built.’” Well, dear reader, I don't know about you, but I'd be prepared to be a chunk of dough that the watch sells for quite a bit more than that. This NBC story appeared on their website on Thursday morning EDT---and it's anther contribution from reader M.A. If you want to learn more, you can check out the auction site linked here. This story is another contribution from reader M.A. |
| Alasdair Macleod: Technical analysis vs. value in gold Posted: 17 May 2014 05:11 AM PDT  Alasdair Macleod: Technical analysis vs. value in gold Alasdair Macleod: Technical analysis vs. value in gold GoldMoney research director Alasdair Macleod contrasts technical analysis of financial markets with value analysis and sides with the latter. Of course neither are very good in a market that is as comprehensively manipulated by central bank intervention as the gold market is, but as happened with the collapse of the London Gold Pool in 1968, eventually the metal available to the market manipulators runs out and value manifests itself, sometimes overnight. Whether "eventually" will cover part of the lifespan of anyone now alive is the big question. GATA continues to do what it can. The link to this commentary by Alasdair is embedded in a GATA release from yesterday---and the above paragraphs of introduction were courtesy of Chris Powell. |
| New Indian Government Seen Easing Gold Import Rules But Not Right Away Posted: 17 May 2014 05:11 AM PDT  New Indian Government Seen Easing Gold Import Rules But Not Right Away New Indian Government Seen Easing Gold Import Rules But Not Right Away Analysts look for gold-import restrictions in India to ease following the election of a new government, although later in the year. Authorities may be somewhat cautious easing rules seen as onerous to the gold industry as they try to balance the repeal against making sure the current account deficit does not start widening again, market watchers said. “There is the possibility that they scale back those import restrictions,” said Rohit Savant, senior commodity analyst with CPM Group. “But I don’t think that’s going to be one of the first things on their agenda. But it’s something that might happen maybe sometime in the second half (of the year).” India historically was the world’s largest gold-consuming nation before China took the top spot in 2013 on a combination of its own strong demand and measures by Indian authorities to curb the amount of gold entering that country. The government took these steps in response to the current account. This Kitco News item found a home over at the forbes.com Internet site early yesterday afternoon EDT---and it's the final offering of the day from reader M.A. |
| How Long Can Phase II of the Gold Pool Be Sustained? Posted: 17 May 2014 05:11 AM PDT How Long Can Phase II of the Gold Pool Be Sustained? "The London Gold Pool was the pooling of gold reserves by a group of eight central banks in the United States and seven European countries that agreed on 1 November 1961 to cooperate in maintaining the Bretton Woods System of fixed-rate convertible currencies and defending a gold price of US$35 per troy ounce by interventions in the London gold market. This wonderful overview of the current situation in the gold market was posted by the proprietor over at thejessescrossroadscafe.blogspot.ca Internet site yesterday---and it's an absolute must read. I thank reader U.D. for bringing it to my attention---and now to yours. |
| Exeter Resources: Investors Should Expect A Higher Share Price Or A Buyout Posted: 17 May 2014 04:45 AM PDT (Editor's Note: Investors should be mindful of the risk of transacting in securities with limited liquidity such as XRA. Exeter's Canadian and European listing offer additional ways to trade the company, although also with limited liquidity.) Hall of fame hockey player Wayne Gretzky used to say that in hockey you have to skate to where the puck is going to be, not where it is. While investing, investors need to anticipate where that puck is heading and not where it currently is - that is the best way to look at the current gold sector. A great way to do this is to follow the words of industry insiders as the words of corporate executives during conference calls, presentations, and industry events give excellent clues on the future direction of the industry. The more investors know about the direction of the industry the better they will do with their investments. |
| Posted: 17 May 2014 03:55 AM PDT A reader request from a friend of a Andrew Dittmer, who edited ECONNED and is a sometime contributor to NC:
I’ve given him some leads. If readers have any contacts (and sympathetic journalists could be a good avenue), please write me at yves@nakedcapitalism.com with “Activists in Europe” as the headline. Thanks! Hero Meteorologist Rescues Kitten from Tornado Rubble in Ohio Gawker. This was a good deed, but I must churlishly note the degrading of the term “hero”. Heros take risk of harm to help others. This rescue was kind, not heroic. Rapture index closes up 1 on wlld weather, near record high Lambert ‘Biggest dinosaur ever’ discovered BBC Recycling the Leftovers New York Times. While this is a positive development, notice it’s driven by increasing recognition of food scarcity. Tech poison killing Chinese Asia Times Vietnam Tries Damage Control After Anti-Chinese Riots Business Week Narendra Modi’s difficult road ahead DW No changes to 'umrah' schedules despite MERS scare, says minister Jakarta Post (Lambert) Investors continue to pull out of Greece over political risks ekathimerini Guantánamo force-feeding halted Guardian New Revelations About GITMO "Suicides", Attorneys for Families of the Deceased Call for International Tribunal To Investigate Center for Constitutional Rights Ukraine
Big Brother is Watching You Watch
Veterans scandal risks engulfing Obama Financial Times Is this Any Way to Discuss Health Care Policy? – Television Advertising about US Health Care Reform Cost $445 Million from 2010 -2014 Health Care Renewal Shocker: Cable TV prices went up four times the rate of inflation. ars tecnica. Chuck L: “And Wheeler wants to hand these guys more rent!” TRNN Debate: Should The Internet Be Regulated Like A Utility? Real News Equal Rights to Profit from Impoverishing People and Causing a Great Extinction Event Ian Welsh 6 reasons treasury yields should be higher Walter Kurtz Regulators Fine G.M. Over Safety, Calling It a Lawbreaker New York Times Goldman fears fallout if rivals plead guilty Financial Times. Wow, Lawsky is pressing for BNP Paribas to have its dollar clearing suspended for a period of time. That would be a very big deal. Momentum Stock Fiasco Pricks San Francisco Housing Bubble Wolf Richter Spring Thaw? The State of Housing in Five Charts Nick Timiraos, WSJ Economics Housing Is Recovering. Single-Family Homes Aren't. New York Times Class Warfare The Minimum Wage Isn’t Just a Wage: It’s a Standard Jared Bernstein Wal-Mart Says It Won’t Oppose Increase in Minimum Wage Wall Street Journal Piketty’s Old News US News Faith-Based Markets Adam Levitin, Credit Slips Today’s Must Reads. I was tempted to put up only these two links to make sure you read them:
Antidote du jour. MK: “From an Earth Day event at the Chatsworth Nature Preserve in Chatsworth, CA.” See yesterday’s Links and Antidote du Jour here.       |
| Randy Wray: What are Taxes For? The MMT Approach Posted: 17 May 2014 12:29 AM PDT By L. Randall Wray, Professor of Economics at the University of Missouri-Kansas City, Research Director with the Center for Full Employment and Price Stability and Senior Research Scholar at The Levy Economics Institute. Originally posted at New Economic Perspectives This is part of a series, following on from the last installment that asked "Do We Need Taxes?". Previously we have argued that "taxes drive money" in the sense that imposition of a tax that is payable in the national government's own currency will create demand for that currency. Sovereign government does not really need revenue in its own currency in order to spend. This sounds shocking because we are so accustomed to thinking that "taxes pay for government spending". This is true for local governments, provinces, and states that do not issue the currency. It is also not too far from the truth for nations that adopt a foreign currency or peg their own to gold or foreign currencies. When a nation pegs, it really does need the gold or foreign currency to which it promises to convert its currency on demand. Taxing removes its currency from circulation making it harder for anyone to present it for redemption in gold or foreign currency. Hence, a prudent practice would be to constrain spending to tax revenue. But in the case of a government that issues its own sovereign currency without a promise to convert at a fixed value to gold or foreign currency (that is, the government "floats" its currency), we need to think about the role of taxes in an entirely different way. Taxes are not needed to "pay for" government spending. Further, the logic is reversed: government must spend (or lend) the currency into the economy before taxpayers can pay taxes in the form of the currency. Spend first, tax later is the logical sequence. Some who hear this for the first time jump to the question: "Well, why not just eliminate taxes altogether?" There are several reasons. First—as we said last time–it is the tax that "drives" the currency. If we eliminated the tax, people probably would not immediately abandon use of the currency, but the main driver for its use would be gone. Further, the second reason to have taxes is to reduce aggregate demand. If we look at the United States today, the federal government spending is somewhat over 20% of GDP, while tax revenue is somewhat less—say 17%. The net injection coming from the federal government is thus about 3% of GDP. If we eliminated taxes (and held all else constant) the net injection might rise toward 20% of GDP. That is a huge increase of aggregate demand, and could cause inflation. Ideally, it is best if tax revenue moves countercyclically—increasing in expansion and falling in recession. That helps to make the government's net contribution to the economy countercyclical, which helps to stabilize aggregate demand. So, we covered those points last time, in part due to a silly twit by Doug Henwood, who likened this to "astrology". Not one to be bothered with embarrassment he responded to the last blog with this exchange: Well, no. Taxes on the rich might take "resources" from people who have too much—if he means that their demand deposit account is debited. But taxation does not "give them (the resources) to people who have too little". Rather government spending directed to those who "have too little" is what gives the poor access to resources (they can use their demand deposit credits to buy food, clothing, shelter, and so on). These are functionally two entirely separate activities. Government can spend to help the poor without taxing the rich or anyone else. And anyone who can understand balance sheets knows that there is no longer any balance sheet operation in which government "spends" its tax revenues. Henwood seems to imagine that the rich roll their wheelbarrows full of coins up to the Treasury Department's steps, where armored trucks load the cash up and take it out to make payments to the poor. Doesn't work that way. Tax payments debit the accounts of taxpayers. If you've ever gone to a ballgame you know that when the scorekeeper awards a run to Boston, he does not take it away from New York. Rather, he keystrokes runs to Boston. If after review of the video, the umpire has made an error, he "debits the account" of Boston. Where does the run taken away go? That's a question for the physicist, not the economist. Where do the taxes payments go? Nowhere—a bank account is debited. I think it has something to do with electrical charges changing from negative to positive, although some commentators told me it is all photons now. All I know is that taxes do not and cannot "pay for" spending. All of this was recognized by Beardsley Ruml, a New Dealer who chaired the Federal Reserve Bank in the 1940s; he was also the "father" of income tax withholding and wrote two important papers on the role of taxes ("Taxes for Revenue are Obsolete" in 1946, and "Tax Policies for Prosperity" in 1964). Let's first examine his cogent argument that sovereign government does not need taxes for revenue, and turn to his views on the role of taxes. In his 1964 article, he emphasizes that "We must recognize that the objective of national fiscal policy is above all to maintain a sound currency and efficient financial institutions; but consistent with the basic purpose, fiscal policy should and can contribute a great deal toward obtaining a high level of productive employment and prosperity." (1964 pp. 266-67) This view is similar to that propounded in by MMT. He goes on to say that the US government gained the ability to pursue these goals after WWII due to two developments. The first was the creation of "a modern central bank" and the second was the sovereign issue of a currency that "is not convertible into gold or into some other commodity." With those two conditions, "[i]t follows that our federal government has final freedom from the money market in meeting its financial requirements….National states no longer need taxes to get the wherewithal to meet their expenses." (ibid pp. 267-8) Why, then, does the national government need taxes? He counts four reasons:
The first of these is related to the inflation issue we discussed above. The second purpose is to use taxes to change the distribution of income and wealth. For example, a progressive tax system would reduce income and wealth at the top, while imposing minimal taxes on the poor. The third purpose is to discourage bad behavior: pollution of air and water, use of tobacco and alcohol, or to make imports more expensive through tariffs (essentially a tax to raise import costs and thereby encourage purchase of domestic output). These are often called "sin" taxes—whose purpose is to raise the cost of the "sins" of smoking, gambling, purchasing luxury goods, and so on. The fourth is to allocate the costs of specific public programs to the beneficiaries. For example, it is common to tax gasoline so that those who use the nation's highways will pay for their use (tolls on throughways are another way to do this). Note that while many would see these taxes as a means to "pay for" government spending, Ruml vehemently denies that view in the title to his other piece, "Taxes for Revenue are Obsolete". Government does not need the gasoline tax to "pay for" highways. That tax is designed to make those who will use highways think twice about their support for building them. Government does not need the revenue from a cigarette tax, but rather wants to raise the cost to those who will commit the "sin" of smoking. Many would say that it is only fair that those who smoke will "pay for" the costs their smoking imposes on society (in terms of hospitalizations for lung cancer, for example). From Ruml's perspective this is not far from the truth—the hope is that the high cost of tobacco will convince more people never to smoke, which thereby reduces the cost to society. However, the point is not the revenue to be generated—government can always "find the money" to pay for hospital construction. Rather, it is to reduce the "waste" of real resources that must be devoted to caring for those who smoke. The ideal cigarette tax would be one that eliminated smoking—not one that maximized revenue to government. He said "The public purpose which is served [by the tax] should never be obscured in a tax program under the mask of raising revenue." (1964 p. 268) We can then use this notion of the public purpose to evaluate which taxes make sense. I won't go through that today, but let me say that Ruml used the corporate income tax as an example of a particularly bad tax. He's right. My professor Hyman Minsky always argued for abolishing that tax—and I wouldn't be surprised if he got the idea from Ruml. Of course, which tax do "liberals" love? Corporate income tax. They all want to increase it to "pay for" all the goodies they want to shower on the poor. In other words, they compound their confusion—not only do they insist on being wrong about the purpose of taxes, but they also embrace one of the worst ones! Maybe a good topic for another blog? Ruml concluded both of his articles by arguing that once we understand what taxes are for, then we can go about ensuring that the overall tax revenue is at the right level. "Briefly the idea behind our tax policy should be this: that our taxes should be high enough to protect the stability of our currency, and no higher…. Now it follows from this principle that our tax rates can and should be lowered to the point where the federal budget will be balanced at what we would consider a satisfactory level of high employment." (1964 p. 269) This principle is also one adopted in MMT, but with one caveat. Ruml was addressing the situation in which the external sector balance could be ignored (which was not unreasonable in the early postwar period). In today's world, in which some countries have very high current account surpluses and others have high current account deficits, the principle must be modified. We would restate it as follows: tax rates should be set so that the government's budgetary outcome (whether in deficit, balanced, or in surplus) is consistent with full employment. A country like the US (with a current account deficit at full employment) will probably have a budget deficit at full employment (equal to the sum of the current account deficit and the domestic private sector surplus). A country like Japan (with a currrent account surplus at full employment) will have a relatively smaller budget deficit at full employment (equal to the domestic private sector surplus less the current account surplus). I'll continue this thread.    |
| Current Problems Associated with the End of the Third Industrial Revolution Posted: 17 May 2014 12:01 AM PDT Yves here. Regular readers will notice that this post overlaps somewhat with Grommen’s post last week, The Dow Jones Industrial Average is a Hoax, but this article is broader and makes more fundamental arguments. One bone of contention is that in one chart, he conflates government debt on gold standard or equivalent terms with a fiat currency. And I suspect NC readers will have strong points of view on his claim at the end regarding the foundations of a stable society. Nevertheless, I thought this article would serve as useful grist for thought and discussion. By Wim Grommen, a teacher in mathematics and physics and later a trainer of programmers in Oracle software. He has also studied and written about transitions, social transformation processes, the S-curve and transitions in relation to market indices. Originally presented at an international symposium in Valencia: “The Economic Crisis: Time for a Paradigm Shift” ABSTRACTThis paper advances a hypothesis of the end of the third industrial revolution and the beginning of a new transition. Every production phase or civilization or human invention goes through a so- called transformation process. Transitions are social transformation processes that cover at least one generation. In this paper I will use one such transition to demonstrate the position of our present civilization. When we consider the characteristics of the phases of a social transformation we may find ourselves at the end of what might be called the third industrial revolution. The paper describes the four most radical transitions for mankind and the effects for mankind of these transitions: the Neolithic transition, the first industrial revolution, the second industrial revolution and the third industrial revolution. The Dow Jones Industrial Average (DJIA) Index is the only stock market index that covers both the second and the third industrial revolution. Calculating share indexes such as the Dow Jones Industrial Average and showing this index in a historical graph is a useful way to show which phase the industrial revolution is in. Changes in the DJIA shares basket, changes in the formula and stock splits during the take-off phase and acceleration phase of industrial revolutions are perfect transition-indicators. The similarities of these indicators during the last two revolutions are fascinating, but also a reason for concern. In fact the graph of the DJIA is a classic example of fictional truth, a fata morgana. History has shown that five pillars are essential in a stable society: Food, Security, Health, Prosperity and Knowledge. At the end of every transition the pillar Prosperity is threatened. We have seen this effect at the end of every industrial revolution. Societies will have to make a choice for a new transition to be started. 1 INTRODUCTIONEvery production phase or civilization or other human invention goes through a so-called transformation process. Transitions are social transformation processes that cover at least one generation. In this paper I will use one such transition to demonstrate the position of our present civilization. When we consider the characteristics of the phases of a social transformation we may find ourselves at the end of what might be called the third industrial revolution. Transitions are social transformation processes that cover at least one generation (= 25 years). A transition has the following characteristics:
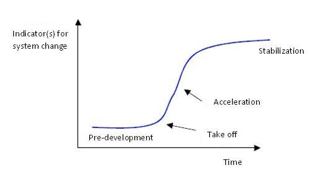
Examples of historical transitions are the demographical transition and the transition from coal to natural gas which caused transition in the use of energy. A transition process is not fixed from the start because during the transition processes will adapt to the new situation. A transition is not dogmatic. 2 TRANSITIONSIn general transitions can be seen to go through the S curve and we can distinguish four phases (figure 1):
A product life cycle also goes through an S curve. In that case there is a fifth phase: Figure 1. The S curve of a transition Four phases in a transition are best visualized by means of an S curve: Pre-development, Take-off, Acceleration, Stabilization. The process of the spreading of transitions over civilizations is influenced by a number of elements:
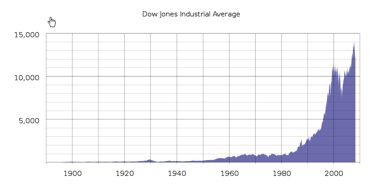
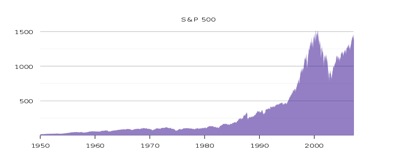
When we look back over the past, we see four transitions taking place with far-reaching effects. 2.1 THE NEOLITHIC TRANSITIONThe Neolithic transition was the most radical transition for mankind. This first agricultural revolution (10000 – 3000 BC) forms the change from societies of hunter gatherers (20 – 50 people) close to water with a nomadic existence to a society of people living in settlements growing crops and animals. A hierarchical society came into existence. Joint organizations protected and governed the interests of the individual. Performing (obligatory) services for the community could be viewed as a first type of taxation. Stocks were set up with stock management, trade emerged, inequality and theft. Ways of administering justice were invented to solve conflicts within and between communities and war became a way of protecting interests.The Neolithic revolution started in those places that were most favorable because of the climate and sources of food. In very cold, very hot or dry areas the hunter gatherer societies lasted longer. Several areas are pointed out as possible starting points: southern Anatolia, the basins the Yangtze Kiang and Yellow river in China, the valley of the Indus, the present Peru in the Andes or what is now Mexico in Central America. From these areas the revolution spread across the world. The start of the Neolithic era and the spreading process are different in each area. In some areas the changes are relatively quick and some authors therefore like to speak of a Neolithic revolution. Modern historians prefer to speak of the Neolithic evolution. They have come to realize that in many areas the process took much longer and was much more gradual than they originally thought. 2.2 THE FIRST INDUSTRIAL REVOLUTIONThe first industrial revolution lasted from around 1780 tot 1850. It was characterized by a transition from small scale handwork to mechanized production in factories. The great catalyst in the process was the steam engine which also caused a revolution in transport as it was used in railways and shipping. The first industrial revolution was centered around the cotton industry. Because steam engines were made of iron and ran on coal, both coal mining and iron industry also flourished. Britain was the first country that faced the industrial revolution. The steam engine was initially mainly used to power the water pumps of mines. A major change occurred in the textile industry. Because of population growth and colonial expansion the demand for cotton products quickly increased. Because spinners and weavers could not keep up with the demand, there was an urgent need for a loom with an external power unit, the power loom. A semi-automatic shuttleless loom was invented, and a machine was created that could spin several threads simultaneously. This "Spinning Jenny", invented in 1764 by James Hargreaves, was followed in 1779 by a greatly improved loom: 'Mule Jenny'. At first they were water-powered, but after 1780 the steam engine had been strongly improved so that it could also be used in the factories could be used as a power source. Now much more textiles could be produced. This was necessary because in 1750, Europe had 130 million inhabitants, but in 1850 this number had doubled, partly because of the agricultural revolution. (This went along with the industrial revolution; fertilizers were imported, drainage systems were designed and ox was replaced by the horse. By far the most important element of the agricultural revolution was the change from subsistence to production for the market.). All those people needed clothing. Thanks to the machine faster and cheaper production was possible and labor remained cheap. The textile industry has been one of the driving forces of the industrial revolution. Belgium becames the first industrialized country in continental Europe. Belgium was "in a state of industrial revolution" under the rule of Napoleon Bonaparte. The industrial centers were Ghent (cotton and flax industries), Verviers (mechanized wool production), Liège (iron, coal, zinc, machinery and glass), Mons and Charleroi. On the mainland, France and Prussia followed somewhat later. In America the northeastern states of the United States followed quickly. After 1870 Japan was industrialized as the first non-Western country. The rest of Europe followed only around 1880. The beginning of the end of this revolution was in 1845 when Friedrich Engels, son of a German textile baron, described the living conditions of the English working class in "The condition of the working class in England". 2.3 THE SECOND INDUSTRIAL REVOLUTIONThe second industrial revolution started around 1870 and ended around 1930. It was characterized by ongoing mechanization because of the introduction of the assembly line, the replacement of iron by steel and the development of the chemical industry. Furthermore coal and water were replaced by oil and electricity and the internal combustion engine was developed. Whereas the first industrial revolution was started through (chance) inventions by amateurs, companies invested a lot of money in professional research during the second revolution, looking for new products and production methods. In search of finances small companies merged into large scale enterprises which were headed by professional managers and shares were put on the market. These developments caused the transition from the traditional family business to Limited Liability companies and multinationals. The United States (U.S.) and Germany led the way in the Second Industrial Revolution. In the U.S. there were early experiments with the assembly line system, especially in the automotive industry. In addition, the country was a leader in the production of steel and oil. In Germany the electricity industry and the chemical industry flourished. The firms AEG and Siemens were electricity giants. German chemical companies such as AGFA and BASF had a leading share in the production of synthetic dyes, photographic and plastic products (around 1900 they controlled some 90% of the worldwide market). In the wake of these two industrial powers (which soon surpassed Britain) France, Japan and Russia followed. After the Second Industrial Revolution more and more countries, on more continents, experienced a more or less modest industrial development. In some cases, the industrialization was taken in hand by the state, often with coarse coercion – such as the five-year plans in the Soviet Union. After the roaring twenties the revolution ended with the stock exchange crash of 1929. The consequences were disastrous culminating in the Second World War. 2.4 THE THIRD INDUSTRIAL REVOLUTIONThe third industrial revolution started around 1940 and is nearing its end. The United States and Japan played a leading role in the development of computers. During the Second World War great efforts were made to apply computer technology to military purposes. After the war the American space program increased the number of applications. Japan specialized in the use of computers for industrial purposes such as the robot. From 1970 the third industrial revolution continued to Europe. The third industrial revolution was mainly a result of a massive development of microelectronics: electronic calculators, digital watches and counters, the compact disc, the barcode etc. The take off phase of the third industrial revolution started around 1980 with the advent of the microprocessor. The development of the microprocessor is also the basis of the evolution and breakthrough of computing. This had an impact in many areas: for calculation, word processing, drawing and graphic design, regulating and controlling machines, simulating processes, capturing and processing information, monetary transactions and telecommunications. The communication phase grows enormously at the beginning of the new millennium: the digital revolution. According to many analysts now a new era has emerged: that of the information or service economy. Here the acquisition and channeling of information has become more important than pure production. By now computer and communication technology take up an irreplaceable role in all parts of the world. More countries depend on the service sector and less on agriculture and industry. 2.5 EFFECTS OF THREE INDUSTRIAL REVOLUTIONSThe first (and second revolution) transformed an agricultural society into an industrial society where mechanization (finally) relieved man of physical labor. The craft industry could not compete with the factories that put products of the same or even better quality on the market at a lower price. The result was that many small businesses went bankrupt and the former workers went to work in the factories. The effects of industrialization were seen in the process of rapid urbanization of formerly relatively small villages and towns where the new plants came. These turned into dirty and unhealthy industrial cities. Still people from the country were forced to go and work there. Because of this a new social class emerged: the workers, or the industrial proletariat. They lived in overcrowded slums in poor housing with little sanitation. The average life expectancy was low, and infant mortality high. The elite accepted the filth of the factories as the inevitable price for their success. The chimneys were symbols of economic power, but also of social inequality. You see this social inequality appear after each revolution. The gap between the bottom and the top of society becomes very large. Eventually there are inevitable responses that decrease this gap. It could be argued that the Industrial revolutions have created the conditions for a society with little or no poverty. The third revolution transformed an industrial society into a service society. Where mechanization man relieved of physical labor, the computer relieved him of mental labor. This revolution made lower positions in industry more and more obsolete and caused the emergence of entirely new roles in the service sector. 3 INDUSTRIAL REVOLUTIONS AND STOCK MARKET INDICESThe Dow Jones Industrial Average was first published halfway through the second Industrial Revolution, in 1896. The Dow Jones Industrial Average Index is the oldest stock index in the United States. This was a straight average of the rates of twelve shares. A select group of journalists from The Wall Street Journal decide which companies are part of the most influential index in the world market. Unlike most other indices the Dow is a price-weighted index. This means that stocks with high absolute share price have a significant impact on the movement of the index. Figure 2. Exchange rates of Dow Jones Industrial Average during the latest two industrial revolutions. During the last few years the rate increases have accelerated enormously. The S & P Index is a market capitalization weighted index. The 500 largest U.S. companies as measured by their market capitalization are included in this index, which is compiled by the credit rating agency Standard & Poor's. Figure 3. Third industrial revolution and the S&P 500 3.1 WHAT DOES A STOCK EXCHANGE INDEX LIKE DOW JONES OR S&P 500 REALLY MEAN?In many graphs the y-axis is a fixed unit, such as kg, meter, liter or euro. In the graphs showing the stock exchange values, this also seems to be the case because the unit shows a number of points. However, this is far from true! An index point is not a fixed unit in time and does not have any historical significance. Unfortunately many people attach a lot of value to these graphs which are, however, very deceptive. An index is calculated on the basis of a set of shares. Every index has its own formula and the formula results in the number of points of the index. However, this set of shares changes regularly. For a new period the value is based on a different set of shares. It is very strange that these different sets of shares are represented as the same unit. After a period of 25 years the value of the original set of apples is compared to the value of a set of pears. At the moment only 6 of the original 30 companies that made up the set of shares of the Dow Jones at the start of the take-off phase of the last revolution are still present. Even more disturbing is the fact that with every change in the set of shares used to calculate the number of points, the formula also changes. This is done because the index which is the result of two different sets of shares at the moment the set is changed, must be the same for both sets at that point in time. The index graphs must be continuous lines. For example, the Dow Jones is calculated by adding the shares and dividing the result by a number. Because of changes in the set of shares and the splitting of shares the divider changes continuously. At the moment the divider is 0.132319125 but in 1985 this number was higher than 1. An index point in two periods of time is therefore calculated in different ways:
In the nineties of the last century many shares were split. To make sure the result of the calculation remained the same both the number of shares and the divider changed. An increase in share value of 1 dollar of the set of shares in 2012 results is 7.5 times more points than in 1985. The fact that in the 1990-ies many shares were split is probably the cause of the exponential growth of the Dow |
| Jim Willie: Germany Preparing Gold-Backed Nordic Euro! Posted: 16 May 2014 08:30 PM PDT
 Europe is the grand prize. And it's always been the grand prize. Well, due to NATO and World War II considerations, the United States is pretty much captured, colonized, integrated Europe. That's about to change. I think Europe is going to turn its attention eastward. They have a parade of gold-backed currencies coming. It's not [...] The post Jim Willie: Germany Preparing Gold-Backed Nordic Euro! appeared first on Silver Doctors. |
| Potential Catalyst for Precious Metals Posted: 16 May 2014 07:15 PM PDT The Daily Gold |
| Beneath The Headline Reports, Housing Starts Data Appear Bearish Posted: 16 May 2014 03:34 PM PDT While the headline reports announced a 13.2% increase in housing starts for the month of April vs. March, an examination of the detailed line-items beneath the headline numbers shows an entirely different view of the report. With single-family home sales clearly in decline - as I've detailed in previous articles - a closer look at the rising inventories of housing units, both for purchase and rental - suggests that an oversupply of housing is developing which will lead to the re-collapse of the housing market. In looking at the line-item breakdown of the housing starts report (see Table 3), 99% of the month to month increase in housing starts was for multi-family units - primarily rental buildings. As you can see, the month to month increase in single family homes was just .8% - or 5,000 units annualized. In contrast, the multi-family segment showed a 28.7% increase month to |
| Posted: 16 May 2014 03:14 PM PDT |
| Gold Is Forming A Golden Triangle. Major Breakout Coming? Posted: 16 May 2014 02:44 PM PDT This is a technical view on the gold price, written by analyst Matt Weller. He sees a chart pattern arising, better known as the golden triangle. We reported a similar finding earlier this week in Gold Price About To Break Higher Or Lower. Gold rallied from below $1,200 to nearly $1,400 over the first 10 weeks of the year. Next, the yellow metal pulled back to 1,300 in late March and has been consolidating in that area ever since. Despite the exasperating trading conditions of late, a developing technical pattern suggests a breakout and possible new trend could form as soon as next week. As the daily chart below shows, the yellow metal has been putting in a series of lower highs and higher lows over the last month, creating a textbook symmetrical triangle pattern. This pattern is analogous to a person compressing a coiled spring: as the range continues to contract, energy builds up within the spring. When one of the pressure points is eventually removed, the spring will explode in that direction. Beyond the symmetrical triangle in the price of gold itself, the RSI indicator is also forming its own corresponding triangle pattern. As a general rule of thumb, a breakout in an indicator tends to lead, or at least confirm, a breakout in price, so traders may want to keep a close eye on the RSI heading into next week. While it's notoriously difficult to determine the breakout direction in advance, knowledge that a strong continuation is likely is still valuable for gold traders. For instance, more aggressive traders could consider a "straddle" trade (looking to go long on a break above resistance or short on a break below support), whereas more conservative traders may want to wait for a confirmed breakout before trying to take advantage of a continuation in the same direction. If we see a bullish breakout above the top of the triangle and the 50-day MA next week, Gold could quickly rise to the top of the triangle at $1,330 or Fibonacci retracement resistance around $1,345 or $1,365. On the other hand, a bearish break would likely target the 3-month low near 1,270, followed by longer-term Fibonacci support at $1262 (61.8%) or $1230 (78.6%).  gold price
About the author: Matt Weller has actively traded various financial instruments including stocks, options, and forex since 2005. Each day, Matt creates research reports focusing on technical analysis of the forex, equity, and commodity markets. In his research, Matt utilizes candlestick patterns, common indicators, and Fibonacci analysis to predict market moves. |
| Alasdair Macleod on Technical analysis versus value in gold Posted: 16 May 2014 01:45 PM PDT
 Technical analysts assume past prices are a valid basis for predicting what investors will pay tomorrow. The Warren Buffetts of this world act differently: they care not what others think and use their own judgement of value. This means that value investors often buy when the trend is down and sell when the trend is up, [...] The post Alasdair Macleod on Technical analysis versus value in gold appeared first on Silver Doctors. |
| Was Silver In a Bubble in 2011? Posted: 16 May 2014 12:15 PM PDT
 Using the 144 week moving average data, the silver peak (weekly closing data) in early 1980 was 10.4 standard deviations above the norm. The April 2011 peak was 4.12 standard deviations above the norm. The current price for May 2014 is about 0.75 standard deviations BELOW the norm. Current 144 week moving average of the [...] The post Was Silver In a Bubble in 2011? appeared first on Silver Doctors. |


| You are subscribed to email updates from Gold World News Flash 2 To stop receiving these emails, you may unsubscribe now. | Email delivery powered by Google |
| Google Inc., 20 West Kinzie, Chicago IL USA 60610 | |
No comments:
Post a Comment