


Gold World News Flash |
- European Gold Nears Brexit Highs As Elections Loom
- Gold Prices – What Next?
- Dr. Doom's Back: Marc Faber Warns Markets Will Fall "Like An Avalanche... Trump Can't Stop It"
- BofAML Explains Why The Ag Economy Isn't Likely To Get Much Better In 2017
- SHOCKING : Donald #Trump admits 9/11 was a cover up.
- YOU-KNOW-WHO HAS FIGURED OUT THE FED IS BEHIND THE CURVE
- Shorts digging in against silver, Turk tells KWN
- Bullion Star's gold charts suggest that demand is strong
- We’re at a Critical Point in the Military-Tech Cycle
- Gold Seeker Closing Report: Gold and Silver Reverse Lower on Fedspeak
- Will Gold Prices Finally Pull Back or Continue Marching Ahead?
- Will Gold Prices Finally Pull Back or Continue Marching Ahead?
- Obama Has Tied Trump’s Hands
- Stockman: Expect a Government Shutdown
- Acacia Mining strikes gold in Kenya
- US Dollar Rolling Over
- Chart of the Day - The US Dollar
- SWOT Analysis: Record Number of Fund Managers Believe Gold Is Undervalued
- Oscars Debacle – Movies More Costly As US Dollar Devalued
- Reasons Why Investors Should Avoid Gold ETFs
- Breaking News And Best Of The Web
- Canada Zinc: Right Time, Right Metal
- Top Ten Videos — February 27
- Do Gold Miners Need to Lead the Metals?
| European Gold Nears Brexit Highs As Elections Loom Posted: 28 Feb 2017 01:15 AM PST While gold prices in dollars has been on a tear - almost erasing its post-Trump losses - the price of the precious metal in euros has soared as European elections loom. As Bloomberg notes, in the Netherlands, Geert Wilders' anti-Islam Freedom Party is holding a slim lead in polls before elections next month, and French presidential candidate Marine Le Pen has campaigned on overturning France's ruling elites.
February is set for the biggest gains (almost 6%) since June 2016 (pre-Brexit) nearing the Maginot Line of EUR1200 once again. It's not just precious metals that are bid as a safe-haven. Short-dated German bonds are seeing an avalanche of safe haven flows...
And equity protection costs are soaring...
|
| Posted: 27 Feb 2017 11:01 PM PST Guest Post from Stefan Gleason, Originally Published on Money Metals Exchange Gold prices are up more than 11% since bottoming last December. Their gains last week took the gold market right... {This is a content summary only. Click on the blog title to continue reading this post, share your comments, browse the website, and more!} |
| Dr. Doom's Back: Marc Faber Warns Markets Will Fall "Like An Avalanche... Trump Can't Stop It" Posted: 27 Feb 2017 08:15 PM PST "One man alone cannot make 'America great again'. That you have to realize," warns Marc Faber, the editor of "The Gloom, Boom, & Doom Report," reminding the world that the US stock market is vulnerable to a seismic sell-off that won't be caused by any single catalyst. His argument: Stocks are very overbought and sentiment is way too bullish for the so-called Trump rally to continue.
Faber, a supporter of President Donald Trump, isn't blaming the new administration for his bearish forecast:
Faber lists rising interest rates and record earnings and margins as additional risks to the historic rally. The Dow Jones Industrial Average closed at a record level for a twelfth consecutive session today with the S&P 500 to see the fewest declines in February than in any month since May 1990.
The investor said that markets in Mexico, Brazil, and Asia also have been picking up significant gains so far this year. However, Faber doesn’t expect the worst-case scenario for all countries that have been benefiting from a strong run.
Faber says that resource commodities such as copper and gold would probably bring the traders solid profits this year.
|
| BofAML Explains Why The Ag Economy Isn't Likely To Get Much Better In 2017 Posted: 27 Feb 2017 07:15 PM PST The fact that farm incomes have come under increasing pressure over the past couple of years should come as little surprise to our readers (for those who missed our latest update, see: "Midwest Farm Bubble Continues Collapse As Farm Incomes Expected To Crash In 2017"). Unfortunately, at least according to Bank of America's Global Ag Chemical team led by Steve Byrne, farmers shouldn't expect a reprieve any time in the near future. As BAML points out, the grain commodity farmers of the U.S. are locked in a vicious cycle, the result of which is a perpetually oversupplied market. To summarize the key takeaways, farmers continue to plant so long as cash profits are positive (because depreciation isn't a real cost and who cares about returns on capital anyway...silly finance people) while yield growth continues to outpace demand growth which leaves markets perpetually oversupplied and commodity prices well below what would be required to provide a normalized profit level for farmers. Meanwhile, since farmers seem to be incapable of unilaterally reducing supply, an external supply shock (e.g. a weather-related event) seems to be the only hope of the industry ever normalizing again. With that, here is a little more detail on the vicious ag cycle per BAML... Yield growth per acre continues to average 1-2% per annum...
...which continues to drive new record highs in production despite an already weak pricing environment.
Meanwhile, global corn demand is expected to recover somewhat in 2016/2017 but no where near the expected 7% supply increase.
All of which is expected to keep global grain stocks at all time highs for the foreseeable future...
And, of course, as long as cash margins remain positive then farmers keep planting...which doesn't do much for that weak pricing environment.
But, at least farmers have that whole trade war with Mexico to look forward to...luckily Mexico is just our second largest corn importer...
It's pretty rough when your only hope of making money in your chosen profession will come only after a devastating weather event that may or may not force you into bankruptcy. |
| SHOCKING : Donald #Trump admits 9/11 was a cover up. Posted: 27 Feb 2017 07:00 PM PST Hopefully, President Trump still has doubts about the official story of the government. Or he folded to the influence of the elite. The Financial Armageddon Economic Collapse Blog tracks trends and forecasts , futurists , visionaries , free investigative... [[ This is a content summary only. Visit http://financearmageddon.blogspot.com http://www.figanews.com for full links, other content, and more! ]] |
| YOU-KNOW-WHO HAS FIGURED OUT THE FED IS BEHIND THE CURVE Posted: 27 Feb 2017 04:34 PM PST
I must admit, I had been expecting the Fed to be a little more hawkish over the past couple of months. Given how tone deaf they seemed during previous tightening periods when the US dollar was screaming higher and oil plunging to levels that would have resulted in entire states going bankrupt, |
| Shorts digging in against silver, Turk tells KWN Posted: 27 Feb 2017 04:29 PM PST 7:30p ET Monday, February 27, 2017 Dear Friend of GATA and Gold: GoldMoney founder and GATA consultant James Turk tells King World News that while the silver shorts were pushed back at $18 they are digging in. Turk thinks this will slow silver's advance but not stop it, since inflation is breaking out. His comments are excerpted at KWN here: http://kingworldnews.com/james-turk-the-shorts-are-choosing-to-fight-des... Also at KWN, Swiss gold fund manager Egon von Greyerz argues that banks in Germany and Luxembourg are in greater danger than banks in southern Europe, as the German and Luxembourg banks have lent huge amounts to borrowers who can't pay: http://kingworldnews.com/greyerz-this-may-crash-europes-financial-system... CHRIS POWELL, Secretary/Treasurer ADVERTISEMENT K92 Mining Drills Multiple High-Grade Gold Intersections Company Announcement K92 Mining Inc. (TSXV–KNT) announces the latest results from the ongoing grade control drilling program at its high-grade Kainantu Gold Mine in Papua New Guinea. K92 is ramping up the Kainantu gold mine toward commercial production, with its longest continuous production run to date now commenced. In September 2016 K92 began a campaign of close-spaced underground diamond drilling as part of a comprehensive grade-control strategy. The current grade-control drilling program is focused on the areas of Irumafimpa and is designed to bring a high degree of confidence to the production planning and scheduling. K92 plans to mine this area in the coming six months. The closed-space drilling pattern of approximately 15 metres by 15 meters has significantly increased the confidence in this sparsely drilled area, with most holes recording high-grade intersections. Approximately 80 percent of the holes completed to date have recorded multiple high-grade intersections indicating the presence of multiple parallel to sub parallel high-grade veins. ... ... For the remainder of the announcement: http://www.k92mining.com/2017/01/k92-drills-multiple-high-grade-gold-int... Join GATA here: Mining Investment Asia Mines and Money Asia * * * Help keep GATA going: GATA is a civil rights and educational organization based in the United States and tax-exempt under the U.S. Internal Revenue Code. Its e-mail dispatches are free, and you can subscribe at: To contribute to GATA, please visit: |
| Bullion Star's gold charts suggest that demand is strong Posted: 27 Feb 2017 04:16 PM PST 7:18p ET Monday, February 27, 2017 Dear Friend of GATA and Gold: Bullion Star tonight posts nine charts that in general suggest that demand for physical gold is strong. They're posted at Bullion Star here: https://www.bullionstar.com/blogs/gold-market-charts/gold-market-charts-... CHRIS POWELL, Secretary/Treasurer ADVERTISEMENT USAGold: Coins and bullion since 1973 USAGold, well known for its Internet site, USAGold.com, offers contemporary bullion coins and bullion-related historic gold coins for delivery to private investors in the United States, Europe, Canada, Australia, and New Zealand. It is one of the oldest and most respected names in the gold industry, with thousands of clients and an approach to investment that emphasizes guidance and individual needs over high-pressure sales tactics. The firm's zero-complaint record at the Better Business Bureau makes it an ideal match for the conservative, long-term investor looking for a reliable contact in the gold business. Please call 1-800-869-5115x100 and ask for the trading desk, or visit: USAGold: Great prices, quick delivery -- all the time. Join GATA here: Mining Investment Asia Mines and Money Asia * * * Help keep GATA going: GATA is a civil rights and educational organization based in the United States and tax-exempt under the U.S. Internal Revenue Code. Its e-mail dispatches are free, and you can subscribe at: To contribute to GATA, please visit: |
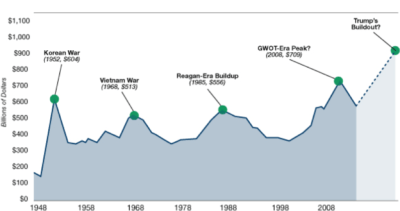
| We’re at a Critical Point in the Military-Tech Cycle Posted: 27 Feb 2017 01:53 PM PST This post We're at a Critical Point in the Military-Tech Cycle appeared first on Daily Reckoning. [Ed. Note: Jim Rickards' latest New York Times bestseller, The Road to Ruin: The Global Elites' Secret Plan for the Next Financial Crisis, is out now. Learn how to score your free copy here. This vital book transcends geopolitics and media rhetoric to prepare you for the next crisis in the event of an ice-nine lockdown.] Today, February 27th 2017 marks a critical point in the military tech long cycle for U.S. investors. Donald Trump has signaled one of his chief policy aims is to substantially increase defense spending. His $54 billion request from Congress may go down as a watershed moment — a window of opportunity that's only opened five times in the past 60 years. There are maybe five eras in U.S. history after the obvious case of WWII that you can point to as a preview of what's just ahead: Right before the Korean War…before Vietnam… during the Reagan-Era buildout… and after 9/11.
Military technology advances in long-cycles driven by politics and procurement. After the Vietnam War, for example, the American military drew down and spending was cut in the late 1970s. This was followed by the shock of the Russian invasion of Afghanistan. A new procurement and development cycle began in the 1980s with Reagan's Strategic Defense Initiative ("Star Wars"), and John Lehman's 600-ship navy. This expansion phase also saw the advent of precision guided munitions such as cruise missiles. After U.S. victory in the Cold War in 1989, and the First Gulf War in 1991, another cycle of contraction began in the Clinton administration. Defense spending was slashed dramatically in the 1990s. Then came the shock of the 9/11 attacks and the Global War on Terror. This started another expansion phase including the Wars in Afghanistan and Iraq. These wars saw the rise of "net-centric warfare" in which every warrior, commander and logistics provider is connected in a web of sensors, wireless communications and high-speed processors combined with artificial intelligence and predictive analytics to anticipate enemy moves and allocate resources in an optimum manner. With the Obama administration another draw-down began and the military was starved of resources to maintain our vast superiority over all adversaries. We are still superior to the Russians and Chinese but the gap is getting dangerously thin. Now, with the new Trump administration, America is about to embark on the third wave of military technological advancement. The first wave was the Reagan-Bush 41 era of Star Wars and precision guided munitions. The second wave was the Bush 43 era of net-centric warfare. The third wave will be the Trump era of game-changing technology ready to emerge from the laboratories and go physical in the battlespace. By the way, you're probably reading this message on the internet through email or a website. Did you know that the internet was invented by the Pentagon as a project of the Defense Advanced Research Projects Agency (DARPA)? Have you heard about DARPA's sister agency, IARPA (Intelligence Advanced Research Projects Agency)? Did you know that one of America's most effective counter-terrorist programs was developed from a system designed to catch card counters at blackjack tables in Las Vegas? (That system was called "NORA" for Non-Obvious Relationship Awareness). When five college math whiz friends check into five different Vegas hotels to run a card counting ring, NORA spots them using non-random data such as zip codes and ages. NORA tracks down terrorists the same way. Did you know that the CIA has its own venture capital company that invests in Silicon Valley start-ups? It's called In-Q-Tel. (The "Q" is a tribute to the man who supplies cool gadgets to 007 in the James Bond films). In-Q-Tel was the sponsor of Project Prophesy where I was co-project director. Defense industry insider Kevin Massengill and I are now using Project Prophesy as our analytic inspiration for the analysis in Defense Technology Alert. Did you know that hedge funds make billions of dollars estimating store revenues by counting cars in shopping mall parking lots using private satellite technology first developed for the military? Of course, the GPS maps and location services on your car dashboard or smart phone were originally developed for the Navy to guide ships at sea. The internet, Las Vegas, satellites GPS and Silicon Valley start-ups are just a few examples of how the civilian world and the defense technology world are connected. That's why I like my team to cover more than just pure military technology, but also emerging civilian technology that has its roots in military and intelligence missions. We want to be right at the intersection of military preparedness, technological development, and finance — three areas with the greatest impact on your personal safety and the safety of your investments. There's more at stake here than just the military edge, although that is critical. From Ancient Rome to Venice to the British Empire, every great power has had a great form of money recognized by the entire world. Rome had the silver denarius and the gold aureus. Venice had the gold ducat. Britain had the gold sovereign. The U.S. has the dollar and 8,000 tons of gold but no formal linkage between the two. China and Russia have each almost tripled their gold reserves in the past 10 years. Along with the military threat from Russia and China comes a financial threat backed by gold. How will the U.S. respond? And what will the counter-response be? Understanding the linkages among military prowess, technology, and international finance is our aim in this new project we're undertaking. Our expertise in the international monetary system and the future role of gold is just as deep as our military and technology expertise. We cover the geopolitical aspects of finance along with military technology to help you understand, and prepare for, the events shaping our lives. We want to be your go-to place for the intersection of military and financial warfare enhanced by the force multiplier of technology. To guide you, we've created a brand-new system with one of the defense industry's most credible and competent players. If you're familiar with how the military does reconnaissance, it will give you an idea for how we like to conduct our defense sector research. The military uses UAV's, or Drones. They’re deployed 15,000 feet in the air. They fly over enemy territory to collect data in dragnet fashion. Then, back at base, the military employs smart analytics to sift through the vast array of data to narrow down to the target. Then, a subject matter expert is employed to analyze the true value of the intelligence he has. After all of that important legwork is done… you get to the most important step: You decide whether or not to take action on your information — whether or not to execute. Our defense stock system is designed to apply this exact military intelligence mentality. We start from the 15,000-foot level. Then we drill down from there to get only the most pertinent and lucrative information. Finally, we find and recommend the exact strike points to enter and exit defense technology investment opportunities. We're the only financial research service in existence today using this method to analyze the profit opportunities arising in the defense technology niche during this coming mega-boom in defense spending. We've already seen amazing gains in the small plays we've identified because we've been ahead of the curve on this story. But given today's breaking news about Trump's budget request, this story is just getting started. If the past is any indication, the defense sector should be one of the most lucrative investment stories for years to come. Regards, Jim Rickards The post We're at a Critical Point in the Military-Tech Cycle appeared first on Daily Reckoning. |
| Gold Seeker Closing Report: Gold and Silver Reverse Lower on Fedspeak Posted: 27 Feb 2017 01:25 PM PST Gold waffled between $1258.40 and $1253.40 in Asia and traded mostly slightly lower in London before it jumped to as high as $1263.60 in late morning New York trade, but it then fell back off into the close and ended with a loss of 0.45%. Silver surged to as high as $18.481 before it also dropped back lower in late trade and ended with a loss of 0.65%. |
| Will Gold Prices Finally Pull Back or Continue Marching Ahead? Posted: 27 Feb 2017 12:49 PM PST Gold prices are up more than 11% since bottoming last December. Their gains last week took the gold market right up to its 50-week moving average. In 2015, attempted rallies reversed at the 50-week moving average. Could this level once again serve as a barrier to further price advances? Either way, long-term gold bulls shouldn’t sweat this particular technical level. Major bull markets need to pull back and reconsolidate periodically. |
| Will Gold Prices Finally Pull Back or Continue Marching Ahead? Posted: 27 Feb 2017 09:56 AM PST Gold prices are up more than 11% since bottoming last December. Their gains last week took the gold market right up to its 50-week moving average. In 2015, attempted rallies reversed at the 50-week moving average. Could this level once again serve as a barrier to further price advances? Either way, long-term gold bulls shouldn't sweat this particular technical level. Major bull markets need to pull back and reconsolidate periodically. |
| Posted: 27 Feb 2017 09:15 AM PST This post Obama Has Tied Trump's Hands appeared first on Daily Reckoning. [Ed. Note: Jim Rickards' latest New York Times bestseller, The Road to Ruin: The Global Elites' Secret Plan for the Next Financial Crisis, is out now. Learn how to score your free copy here. This vital book transcends geopolitics and media rhetoric to prepare you for the next crisis in the event of an ice-nine lockdown.] America is going broke. That's not an opinion or scare tactic — it's a fact based on simple arithmetic. President Trump could be forced to face this fact as early as March 15, the date the latest U.S. debt ceiling suspension ends. Regards, Jim Rickards The post Obama Has Tied Trump's Hands appeared first on Daily Reckoning. |
| Stockman: Expect a Government Shutdown Posted: 27 Feb 2017 08:25 AM PST This post Stockman: Expect a Government Shutdown appeared first on Daily Reckoning. [Ed. Note: To see exactly what this former Reagan insider has to say about Trump and specifically what he believes must be done in government, David Stockman is sending out a copy of his book Trumped! A Nation on the Brink of Ruin… And How to Bring It Back out to any American willing to listen before it is too late. To learn how to get your free copy CLICK HERE.] David Stockman joined Greg Hunter at USAWatchdog.com to discuss what he believes is a coming budget calamity. Stockman offers his insights into what he predicts will be very positive moves in the future for silver and gold. The financial expert and bestselling author goes beyond the messaging found in the mainstream to offer his exclusive analysis on what a government shutdown will entail for Wall Street and Main Street. "Number one, everybody was surprised by Donald Trump's election. Secondly, I think there is still not a correct diagnosis for why it happened. It was not his platform, and certainly it was not his resume. It was the fact that the financial system we've had for the last thirty years is failing. It has been great for the bicoastal elites, a term I use in my book TRUMPED!, but if you look at Flyover America you see all of that area in between the coasts – it is a dire situation… I think what we are dealing with now is fundamental questions about a government that is out of control, a Fed that has printed money endlessly and stayed deep in the canyons of Wall Street. They have not helped main street America… It has been the 1% that has received the great windfall." "Beyond that, we have a foreign policy that is out of control. We're intervening everywhere. We have spent trillions. We have destroyed half of the Middle East. We're at an inflection point. There has been a fundamental break in terms of the public support for the Wall Street – Washington Axis that has run domestic and foreign policy for the last thirty years." David Stockman is the former Budget Director serving President Ronald Reagan where he worked first hand the complexities of the budget. Stockman is a two term Congressman and has worked on various Wall Street firms. He is the bestselling author of TRUMPED! A Nation on Brink of a Ruin and How to Bring it Back (learn how to get your FREE copy – CLICK HERE). "I think what people are missing is this date, March 15, 2017. That's the day that this debt ceiling holiday that Obama and Boehner put together right before the last election in October of 2015. That holiday expires. The debt ceiling will freeze in at $20 trillion. It will then be law. It will be a hard stop. The Treasury will have roughly $200 billion in cash. We are burning cash at a $75 billion a month rate. By summer, they will be out of cash. Then we will be in the mother of all debt ceiling crises. Everything will grind to a halt. I think we will have a government shutdown. There will not be Obama Care repeal and replace. There will be no tax cut. There will be no infrastructure stimulus. There will be just one giant fiscal bloodbath over a debt ceiling that has to be increased and no one wants to vote for." "Unfortunately for Donald Trump, not only did the public vote the establishment out but that left on his door step the inheritance of thirty years of debt build up and of a fiscal policy that has been really reckless in the extreme. Even though people would like to think that he is the second coming of Ronald Reagan and that we're going to have "Morning in America" I don't think it looks that promising. He is inheriting a mess that pales into insignificance for what we had to deal with in 1981 when I joined the Reagan White House as Budget Director." "They are going to raise interest rates on March 15, they have to. I am talking about the Federal Reserve. They have dithered for 100 months. You are going to be in an environment which there is no more stimulus coming through the Fed. In which the vaunted Trump fiscal stimulus, or a handoff of the stimulus baton to the fiscal side will clearly not be happening. Then the markets will discover… That it is home alone. Washington isn't there for one more go-around of this fantasy… The day of reckoning will happen. I expect the market will easily correct by 20% and probably a lot more. I think it is going to begin March 15 when it becomes clear where we are…" When Greg Hunter asked about the looming government debt circumstances in Washington and whether a default could be on the horizon Stockman responded, "When they run out of cash… (Donald Trump) is not going to roll over and agree to whatever Capitol Hill demands in order to get a debt ceiling increase. He is going to face them down and I have great regard for Mick Mulvaney, the newly confirmed Budget Director under the Office of Management and Budget. He has clearly understood that when the Treasury Department has run out of cash and the debt ceiling has been used up, and you can't borrow anymore the President has the authority to allocate spending." "The point is that we have in a typical month $250-300 billion of revenue coming in. That will easily cover the debt service per month. That will cover social security and other critical payments. But when it comes to paying grants to state and local governments, contractors for military or a whole range of other activities – if you don't have the cash you put the bills in the drawer. I think that is what is going to shock the system. This is what will (scare) Wall Street and the markets. Then you won't have a sudden resolution for the problem. It could go on for days and weeks. In the past since no President has been advised to allocate spending, it comes to a point where somebody blinks, they pass a resolution in the wee hours of the night and the government goes on it’s way spending and borrowing. This time, this summer, there is going to be day-after-day as to who is going to blink. Who is getting paid? Who isn't? What bills are building up and which one's aren't? This is going to be a maelstrom like we have never seen before. The markets are not even remotely prepared for this."
"The casino is going to begin to realize and piece together the fact that there is no plan. There is not fiscal stimulus. The whole system is heading into some kind of crash landing. That is going to change the manic delusions underway today (in Wall Street). I think we are going to have a greater depression in the stock market than we've had since 1987 when it dropped 25% in one day… The big correction that I am talking about is in the $62 trillion of debt outstanding in the country. The $30-$35 trillion in the various index areas and variously traded stocks. The big adjustment is going to come there. It will spill over into the real economy. One of the silver linings of this phony recovery that we've had since the crisis of 2008 is that Main Street hasn't really recovered. There is not a big bubble there in jobs, production, income, living standards that will be taken away. The only strong recovery that we've had is in the financial markets." When asked about gold looking like it is building a steady investment option he remarked, "I think it is due to the fact that there is some semblance of rationality left in the edges of the financial markets. Some people realize that these central banks are out of dry powder. That era of massive money printing is over. They can see that the governments of the world… are all close to bankrupt. In that environment there is going to be a massive reset of financial asset values. The central banks are going to be totally discredited. After all the central banks have said "we know what we're doing." "When people realize that the central banks have failed completely, that the practice of quantitative easing, zero interest policy and the various "tools" were phony – then I think there will be a dash for the only solid monetary asset left in the world which is gold. When you take the size of the global financial markets which I put at about $300 trillion (debt, combined stock market value) the gold market is tiny compared to the size of the financial system. It will only take a small shift on the margins into the asset of last resort to make the price of gold to really start to soar. I think that is going to happen. I don't know when. The best thing to do is be patient and to be long in gold and it will pay off handsomely… when the crisis intensifies and hits ground zero." To catch the full interview covering the debt ceiling and a government shutdown on USAWatchdog.com CLICK HERE. If you want to learn more about how to get your own copy of Stockman's book that predicted Donald Trump's 2016 victory and has outlined exactly what needs to happen going forward CLICK HERE. Regards, Craig Wilson, @craig_wilson7 The post Stockman: Expect a Government Shutdown appeared first on Daily Reckoning. |
| Acacia Mining strikes gold in Kenya Posted: 27 Feb 2017 07:12 AM PST This posting includes an audio/video/photo media file: Download Now |
| Posted: 27 Feb 2017 06:42 AM PST A close below the 10 DMA on the US Dollar would be the “second step” in the confirmation that its daily cycle is rolling over and starting the next leg down in the intermediate decline. The first confirmation was the initial break of the daily cycle up trend line. |
| Chart of the Day - The US Dollar Posted: 27 Feb 2017 06:30 AM PST A close below the 10 DMA on the US Dollar would be the "second step" in the confirmation that its daily cycle is rolling over and starting the next leg down in the intermediate decline. The first confirmation was the initial break of the daily cycle up trend line. |
| SWOT Analysis: Record Number of Fund Managers Believe Gold Is Undervalued Posted: 27 Feb 2017 06:22 AM PST The best performing precious metal for the week was platinum, with a gain of 2.32 percent and closely followed by silver and then gold. Gold traders and analysts surveyed by Bloomberg continue their bullish stance on the yellow metal for the ninth straight week, as prices climb to November highs. Silver is also on a roll, reports Bloomberg. As you can see in the chart below, silver is up for the ninth straight week, which is the longest run of gains since May 2006. |
| Oscars Debacle – Movies More Costly As US Dollar Devalued Posted: 27 Feb 2017 05:31 AM PST Cost of Best Picture winners show very significant devaluation of the dollar Average cost to make an Oscar winning film is over $43 million – in gold terms, this is over 106,000 ounces Four $15 million films show nearly 100% difference when priced in gold ounces Oscar fiasco was courtesy of error by accountants PWC Whilst the price of the films remained the same, the cost in gold ounces fell from 11.53% of the cost to make the Departed, in 2009 to just 6.4% in 2012 In an error prone, irrational and volatile world, gold retains value over time … |
| Reasons Why Investors Should Avoid Gold ETFs Posted: 27 Feb 2017 03:34 AM PST BY STEPHEN MCBRIDE : Gold may have ended 2016 on a negative note, but the yellow metal is now up 7% since January. A big contributor to its rise is the large inflows into gold exchange-traded funds (gold ETFs). In 2016, inflows into gold ETFs were the second highest on record and accounted for 34% of total investment demand. With inflows showing continued strength in 2017, why should investors avoid gold ETFs? |
| Breaking News And Best Of The Web Posted: 27 Feb 2017 01:37 AM PST US stocks open slightly lower. Gold and silver at multi-week highs. Bitcoin near all-time high. Trump budget to increase defense, cut EPA, State. Debate over Putin and fake news continues. Best Of The Web Contemplations for a Sunday1 (unless you can’t get around to it til Monday) – Economica Risk on/risk off face-off – […] The post Breaking News And Best Of The Web appeared first on DollarCollapse.com. |
| Canada Zinc: Right Time, Right Metal Posted: 27 Feb 2017 12:00 AM PST 321 Gold founder Bob Moriarty turns his attention to Canada Zinc, a company that has a giant zinc deposit in northern British Columbia. |
| Posted: 26 Feb 2017 04:01 PM PST David Stockman on why everything will soon “grind to a halt.” Robert Kiyosaki on why money isn’t money any more. Ron Paul on a return to the gold standard. Peter Grandich on why stocks are “in their terminal phase.” The post Top Ten Videos — February 27 appeared first on DollarCollapse.com. |
| Do Gold Miners Need to Lead the Metals? Posted: 26 Feb 2017 07:01 AM PST It’s a common misconception that miners always lead the metals sector. As you can see in this chart the miners often produce false signals. |


| You are subscribed to email updates from Save Your ASSets First. To stop receiving these emails, you may unsubscribe now. | Email delivery powered by Google |
| Google Inc., 1600 Amphitheatre Parkway, Mountain View, CA 94043, United States | |
No comments:
Post a Comment