


Gold World News Flash |
- Mining Companies, Regulators Deathly Silent after Midnight Raid on Gold Prices
- PEAK GOLD vs. PEAK SILVER: Must See Chart
- No need for 'theories' with gold -- just address the facts and documentation
- Shanghai Gold Exchange Has 73.3 Tonnes of Bullion Withdrawn In the Third Largest Week In Its History
- Paying In A Broken World
- Commodities Are Screaming Trouble But the Fed Isn’t Listening
- Ron Paul: "All Wars Are Paid For Through Debasing The Currency"
- Goldman Warns "The Global Economy Is Going Round In (Smaller & Smaller) Circles"
- This Week Silver and Gold Prices Actually Rose, Yes, Rose.
- The IMF Experts Flunk, Again
- In The News Today
- Paul Craig Roberts-Economic House of Cards, Demand for Gold and Silver Very Very High
- Gold Daily and Silver Weekly Charts - Entering the Active Month of August - July Payrolls Next Week
- Infographic: The Origin of the Greek Crisis
- The Gross Mispricing in the Gold Market Risks the Global Financial System - A Fraud Too Far
- Israelis Arrested in JPMorgan Hack Case - #NewWorldNextWeek
- Preparing for Financial Disaster Is More Necessary Than Ever! | Mike Rivero
- Gold’s Amazing Resiliency
- Donald Trump on Hillary Clinton: She has a lot to hide
- The Military Industrial Complex -- Why Does America Love Its Military So Much?
- In Gold We Trust 2015
- Gold and Silver Markets in Limbo
- Silver – A Century of Prices
- Demand for Gold Bullion Surges – Perth Mint, and U.S. Mint Cannot Meet Demand
- Are Silver Spot Prices Poised for an Increase?
- Craig Johnson Still Bullish on Stocks; Sees More Downside for Gold, Oil, and Commodities
| Mining Companies, Regulators Deathly Silent after Midnight Raid on Gold Prices Posted: 31 Jul 2015 11:31 PM PDT With gold and silver on the defensive following a dramatic midnight raid on gold prices last week, Mike Gleason reached out to Chris Powell, Secretary Treasurer at the Gold Anti-Trust Action Committee, also known as GATA to discuss possible gold price manipulation. Mike Gleason: Several days ago, we had another attack on the gold market – right as it was holding above a critical price support zone. Someone sold several billions of dollars in gold futures contracts during the wee hours of the night immediately before the Chinese trading day began. It happened during a time of low liquidity like it normally does, and it took the price down over $40 in the matter of a few seconds, halting trading twice for a brief period. What are we to make of all this Chris? | |||||||||||||||||||||||||||||||||||||||||||||||||||||||||||||||||||||||||||||||||||
| PEAK GOLD vs. PEAK SILVER: Must See Chart Posted: 31 Jul 2015 08:45 PM PDT from SRS Rocco:
In addition, the information in this chart will show why the peak of primary gold production will occur before the peak of primary silver production. However, global silver production will likely peak soon after world gold production. Thus, individuals understanding the difference, will likely enjoy a rewarding investment strategy most are currently unaware.
As I have mentioned time and time again, ENERGY IS THE KEY to the value of the precious metals. This goes well above and beyond the percentage of raw energy (oil, natural gas, coal, hydro & nuclear) consumed in the production of an ounce of gold or silver. Unfortunately, investors do not realize that 90-95% of the value of an ounce of gold or silver is directly related to the amount of energy consumed IN ALL FORMS and IN ALL STAGES in the their production. Labor is a form of energy. Upper management pay, is a form of energy (highly skilled energy). The materials consumed in the gold and silver mining industry get their value from the energy consumed IN ALL FORMS and in ALL STAGES of their production-transportation-distribution. The mining equipment used in the production of gold and silver also get their value from all the energy consumed in their manufacture (in all forms and stages). While the market understands that energy is large percentage of the cost to produce gold or silver, they fail to realize LABOR, MATERIALS and EQUIPMENT are all “Energy Derivatives.” Even though labor, materials and equipment are listed as different itemized costs on the precious metals mining company’s balance sheet, they are all ENERGY COSTS when we break them down to their simplest form. That being said, let’s look at the huge difference in the consumption of diesel in the primary gold and silver mining industry. I selected Barrick because they are the largest gold producer in the world and Pan American Silver is one of the largest primary silver mining companies. While other companies such as Fresnillo located in Mexico produce more silver than Pan American Silver, I was able to obtain diesel consumption data from Pan American Silver more readily as they just released their 2014 Sustainability Report. If we look at the chart below, we can see just how much more diesel is consumed in the production of gold than silver:
According to the data from the two companies 2014 Sustainability Reports, Barrick consumed 20.8 gallons of diesel to produce an ounce of gold while Pan American Silver only used 0.2 gallons to yield an ounce of silver. Basically, it took Barrick 100 times more diesel to produce an ounce of gold in 2014 than it took Pan American Silver to produce an ounce of silver. That said, let me clarify a few things. First, these mining companies state their energy consumption figures in various metrics. For example, Barrick listed their energy consumption in giga joules and Pan American Silver in cubic meters. So, we have to make some conversions to gallons to make a comparison. | |||||||||||||||||||||||||||||||||||||||||||||||||||||||||||||||||||||||||||||||||||
| No need for 'theories' with gold -- just address the facts and documentation Posted: 31 Jul 2015 08:44 PM PDT 11:40p ET Friday, July 31, 2015 Dear Friend of GATA and Gold: Here's another financial analyst who can't be bothered with actual analysis, at least when it comes to gold: Peter Hodson of 5i Research Inc. of Waterloo, Ontario, former chairman of Sprott Asset Management. In commentary published today in Toronto's National Post, "5 More Reasons Why Investors Shouldn't Worship Gold Right Now" -- http://business.financialpost.com/investing/investing-pro/5-more-reasons... -- Hodson offers a paragraph titled "Conspiracy Theories Won't Help Gold." It reads: "Every time gold goes down, the gold bugs blame the price drop on a takedown by some secret cartel working with the banks. The theory here is that governments do not want investors losing faith in fiat currencies, so they control the gold price to make paper currency look better. ... Dispatch continues below ... ADVERTISEMENT USAGold: Coins and bullion since 1973 USAGold, well known for its Internet site, USAGold.com, offers contemporary bullion coins and bullion-related historic gold coins for delivery to private investors in the United States, Europe, Canada, Australia, and New Zealand. It is one of the oldest and most respected names in the gold industry, with thousands of clients and an approach to investment that emphasizes guidance and individual needs over high-pressure sales tactics. The firm's zero-complaint record at the Better Business Bureau makes it an ideal match for the conservative, long-term investor looking for a reliable contact in the gold business. Please call 1-800-869-5115x100 and ask for the trading desk, or visit: USAGold: Great prices, quick delivery -- all the time. "Having once worked at a gold-focused fund company, although being a gold bug was never my thing, I've heard all the theories on gold and gold manipulation. "These theories may not be all bogus, but if gold could not find any reason to go to US$3,000 an ounce during the financial crisis, when banks worldwide were imploding daily, then it is hard to make a bullish case for gold when financial conditions are improving daily. "Gold is just another asset class, and its price is based on supply and demand. If the demand was there, the price would rise, regardless of any conspiracy theory. But the demand is simply not enough, so the price continues to drift down." Your secretary/treasurer tried to post a reply to the story but the National Post seems to be rejecting it. It said: "Gold's price is based mainly on surreptitious intervention in the market by central banks. This is not 'conspiracy theory,' though the regular secret meetings held by central banks to devise and implement a course of action are fairly described as conspiracies. Rather, this intervention is longstanding central bank policy extensively documented by the Gold Anti-Trust Action Committee here: http://www.gata.org/node/14839 "Financial journalism should address the documentation. There's no need to evade the issue with mere 'theory.'" Hodson and other analysts should address these questions in regard to gold: -- Are central banks in the gold market surreptitiously or not? -- If central banks are in the gold market surreptitiously, is it just for fun -- for example, to see which central bank's trading desk can make the most money by cheating the most investors -- or is it for policy purposes? -- If central banks are in the gold market for policy purposes, are these the traditional purposes of defeating a potentially competitive world reserve currency, or have these purposes expanded? -- If central banks, creators of infinite money, are surreptitiously trading a market, how can it be considered a market at all, and how can any country or the world ever enjoy a market economy again? Again, there's no need for mere theories and surmise with the gold market. There is a need to deal with facts and documentation and to go to the source, as with any other market. If you haven't done that, don't pretend that you have. CHRIS POWELL, Secretary/Treasurer Join GATA here: New Orleans Investment Conference http://noic2015.eventbrite.com/?aff=gata The Silver Summit and Resource Expo 2015 http://cambridgehouse.com/event/50/the-silver-summit-and-resource-expo-2... Support GATA by purchasing recordings of the proceedings of the 2014 New Orleans Investment Conference: https://jeffersoncompanies.com/landing/2014-av-powell Or by purchasing DVDs of GATA's London conference in August 2011 or GATA's Dawson City conference in August 2006: http://www.goldrush21.com/order.html Or by purchasing a colorful GATA T-shirt: Or a colorful poster of GATA's full-page ad in The Wall Street Journal on January 31, 2009: http://gata.org/node/wallstreetjournal Help keep GATA going GATA is a civil rights and educational organization based in the United States and tax-exempt under the U.S. Internal Revenue Code. Its e-mail dispatches are free, and you can subscribe at: To contribute to GATA, please visit: | |||||||||||||||||||||||||||||||||||||||||||||||||||||||||||||||||||||||||||||||||||
| Shanghai Gold Exchange Has 73.3 Tonnes of Bullion Withdrawn In the Third Largest Week In Its History Posted: 31 Jul 2015 07:52 PM PDT | |||||||||||||||||||||||||||||||||||||||||||||||||||||||||||||||||||||||||||||||||||
| Posted: 31 Jul 2015 07:25 PM PDT Submitted by Tom Chatham via Project Chesapeake, It is a common reaction to ask, how much is that, when we see something we want or need. The question is answered with some monetary figure that people will recognize and use to determine if they can afford it. But what happens when the monetary system we know becomes so dysfunctional that common monetary values mean little. This could happen due to massive inflation, currency collapse or a frozen banking system that prevents you from accessing your funds. If you have no way to pay for something, it does not matter how much or little it costs. It will be out of your reach unless you have some means to pay. Some people keep cash on hand for just such a problem. They know they will be able to pay cash when everything else stops working. That will work for a time but eventually paper currency will be looked on as a diminishing asset as physical goods become more valuable to those that need them. Paper currency is not much different than a check you write on your account. If the account is empty your check is no good. The same can be said for those entities that issue paper money. If they are bankrupt or shut down, the value of their printed certificates will be worth the same as the bad check. Nobody will want to accept it after they realize it may not be honored for the value it supposedly holds. While a local store may accept it out of habit, eventually businesses will figure out the truth. In times like this alternative forms of money may become more viable to local individuals such as gold and silver. But, that may take some time and most people will not own any of these precious metals for trade. Some may resort to direct barter with some of the things they have amassed over the years to get the necessities they need and under these circumstances values will be variable and disconnected from reality at times. Some people have stored barter items for this eventuality rather than precious metals and there is nothing wrong with that if it gives them the feeling of safety they desire. One of the reasons they desire goods instead of metals is the fear that governments will call in precious metals as they did in 1933 and that is a legitimate fear but must be taken with some reflection on the facts. In 1933, gold and silver coinage was the circulating currency in the nation meaning most people had some in their possession. That is not the reality today as very few people have any knowledge of the value of metals and do not have them in their possession. The fact that the government can call in metals does not mean they will be able to relieve you of them. In 1933, on the river where I grew up, there was a store on the bank of the river that did a good business with all of the ships that came by. When the gold was called in in 1933, the store owner did not want to turn it in so he kept it hidden away. At the time he had a small chest full of gold coins. He kept that chest of coins until the 1970’s when gold was legal to own again and then he sold it for a good profit. This is a true story and just one example of how hard it would be for the government to call in all of the metals in private hands. It does not matter what you hold your savings in only that it will retain value when conventional paper currencies become a despised possession. When that happens you need the ability to buy the things you need with what you physically have on hand. The question you must answer is what will you have on hand when that day comes. | |||||||||||||||||||||||||||||||||||||||||||||||||||||||||||||||||||||||||||||||||||
| Commodities Are Screaming Trouble But the Fed Isn’t Listening Posted: 31 Jul 2015 06:30 PM PDT by Pam Martens and Russ Martens, Wall Street on Parade:
The commodities slump has accelerated this past month with gold now trading at five-year lows and the U.S. crude benchmark, West Texas Intermediate (WTI), down 19 percent in just the past month, 49 percent on the year, and 57 percent in the past two years. In early morning trade, WTI is at $47.82 versus $110 two years ago. Minutes of the Federal Reserve's Open Market Committee meeting on December 16 and 17 reveal that the Fed was expecting an upturn in oil prices this year, writing: "…inflation was projected to reach the Committee's objective over time, with longer-run inflation expectations assumed to remain stable, prices of energy and non-oil imports forecast to begin rising next year, and slack in labor and product markets anticipated to diminish slowly." CNN Money is reporting this morning that major iron ore or metals exporting countries like Peru (copper), Chile (copper), South Africa (iron ore and gold), Australia (iron ore and gold), Brazil (iron ore), Zambia (copper), and Democratic Republic of the Congo (metals and crude oil) are experiencing a serious economic impact from the plunge in commodity prices over the past year. | |||||||||||||||||||||||||||||||||||||||||||||||||||||||||||||||||||||||||||||||||||
| Ron Paul: "All Wars Are Paid For Through Debasing The Currency" Posted: 31 Jul 2015 06:15 PM PDT Submitted by Mac Slavo via SHTFPlan.com,
And at some point, all empires crumble on their own excess, stretched to the breaking point by over-extending a military industrial complex with sophisticated equipment, hundreds of bases in as many countries, and never-ending wars that wrack up mind boggling levels of debt. This cost has been magnified by the relationship it shares with the money system, who have common owners and shareholders behind the scenes. As the hidden costs of war and the enormity of the black budget swell to record levels, the true total of its price comes in the form of the distortion it has caused in other dimensions of life; the numbers have been so thoroughly fudged for so long now, as Wall Street banks offset laundering activities and indulge in derivatives and quasi-official market rigging, the Federal Reserve policy holds the noble lie together. Ron Paul told RT:
The former Congressman and presidential candidate explained:
Unsustainable might be putting it lightly. The entire thing is in shambles from the second the coyote looks down and sees that he’s run out over a cliff.
| |||||||||||||||||||||||||||||||||||||||||||||||||||||||||||||||||||||||||||||||||||
| Goldman Warns "The Global Economy Is Going Round In (Smaller & Smaller) Circles" Posted: 31 Jul 2015 05:40 PM PDT Amid the collapse in commodities, crashing Chinese stocks, the weakest US wage growth in US history, and a data-dependent Fed; Goldman Sachs fears the new normal is 'shorter-and-faster' business cycles with no persistence primed by monetary policies. Most wprryingly, they conclude, will short business cycles beget shorter business cycles?
As Goldman notes,
In other words, will short business cycles beget shorter business cycles? | |||||||||||||||||||||||||||||||||||||||||||||||||||||||||||||||||||||||||||||||||||
| This Week Silver and Gold Prices Actually Rose, Yes, Rose. Posted: 31 Jul 2015 05:36 PM PDT
SILVER today added 5.5 cents to $14.746 on Comex. The GOLD PRICE picked up $6.50 to $1,094.9. Since the big drop on 20 July the price of gold has spent 9 days moving sideways in a range between $1,080 and $1,104. Middle of that period the gold price dipped down to an intraday low of $1,072.30 but closed the day higher at $1,098.
What about the SILVER PRICE? Where are you, honey? Today silver traded down to $14.555 cents about 9:00, then shot skyward like a mortar, hit $15.01 and bounced off. Backed off the rest of the day to a low about $14.70. This leaves a double bottom with the low on Monday. Yes, yes, yes.
Gold's MACD has almost turned up, silver's has. Gold's RSI overbought condition has nearly been worked off. If silver and gold don't start climbing next week, I don't know when they will. I bought silver and gold this week. After that headline claiming gold would sink to $350, y'all ought to buy some, too. Premium on US 90% coin is very high now, so high you can swap it for 100 oz bars and end with about 12% more silver. Call us at (888) 218-9226. The US dollar index gained 9 basis points, close enough to flat to call it flat. After a vicious 5 day losing streak, stocks rebounded, but began losing ground again yesterday.
Matching the dollar performance, the Euro shot up through its 20 then its 450 DMA, only to close the day back beneath the 20 DMA. Sorry as gully dirt, even if it did rise 0.45% to $1.0983. Yen also reversed yesterday's breakdown through the uptrend line. Weird going on with currencies. Maybe Nice Government Men getting antsy about a higher dollar? Stocks ended the week higher and the month higher, barely, but are rolling over noticeably in a rounding top. Lose 600 points-make back 300 points is not a recipe for advancement. Dow today lost 56.12 (0.32%) to 17,689.86 after stalling yesterday. S&P500 gave up 4.79 (0.23%) to 2,103.84. Dow remains below 200 DMA, bad juju like those drums beating way back in the jungle in one of those old Johnny Weissmuller Tarzan movies. S&P500 diverges from the down since it is considerably higher than its 200 DMA (2,104 vs.. 2068.27) and above its 50 and 20 DMAs. Whoppin' crash coming. Dow in gold dropped 0.96% today to 16.16 oz, and has left behind a series of lower highs. One lower low and the downtrend is complete. Behaving just as it ought if silver and gold have made a bottom and stocks turned down against gold. Dow in Silver dropped 0.72% today to 1,198.50 oz, and also shows a series of dropping peaks. Other indicators have all turned down. Y'all enjoy your weekend. Aurum et argentum comparenda sunt -- -- Gold and silver must be bought. - Franklin Sanders, The Moneychanger The-MoneyChanger.com © 2015, The Moneychanger. May not be republished in any form, including electronically, without our express permission. To avoid confusion, please remember that the comments above have a very short time horizon. Always invest with the primary trend. Gold's primary trend is up, targeting at least $3,130.00; silver's primary is up targeting 16:1 gold/silver ratio or $195.66; stocks' primary trend is down, targeting Dow under 2,900 and worth only one ounce of gold or 18 ounces of silver. or 18 ounces of silver. US $ and US$-denominated assets, primary trend down; real estate bubble has burst, primary trend down. WARNING AND DISCLAIMER. Be advised and warned: Do NOT use these commentaries to trade futures contracts. I don't intend them for that or write them with that short term trading outlook. I write them for long-term investors in physical metals. Take them as entertainment, but not as a timing service for futures. NOR do I recommend investing in gold or silver Exchange Trade Funds (ETFs). Those are NOT physical metal and I fear one day one or another may go up in smoke. Unless you can breathe smoke, stay away. Call me paranoid, but the surviving rabbit is wary of traps. NOR do I recommend trading futures options or other leveraged paper gold and silver products. These are not for the inexperienced. NOR do I recommend buying gold and silver on margin or with debt. What DO I recommend? Physical gold and silver coins and bars in your own hands. One final warning: NEVER insert a 747 Jumbo Jet up your nose. | |||||||||||||||||||||||||||||||||||||||||||||||||||||||||||||||||||||||||||||||||||
| Posted: 31 Jul 2015 05:05 PM PDT Submitted by Steve Hanke via The Cato Institute, My Globe Asia column in May was titled “Greece: Down and Probably Out.” Well, it’s out. Yes, Greece descended from drama to farce rapidly. If all goes according to plan, the left-wing Greek government will come to an agreement with the so-called troika — the European Commission (EC), the European Central Bank (ECB), and the International Monetary Fund (IMF) — over the details of a third bailout program by August 20th. This rescue package will probably be worth €86 billion (U.S. $94.5 billion). So, since 2010, Greece will have received three bailouts worth a whopping €430 billion (U.S. $472.2 billion). This amounts to a staggering €39,000 (U.S. $42,831) for every man, woman, and child in Greece. Like past bailouts, the third one will fail to stop Greece’s economic death spiral. The experts from the EC, ECB, and particularly those from the IMF have been wrong about the prospects for the Greek economy since day one. The experts have failed to embrace a coherent theory of national income determination. Indeed, they have often engaged in ad hoc theorizing that has, at times, appeared to be convoluted and politically motivated. The result has been a series of wildly optimistic forecasts about the course of the Greek economy followed by wrongheaded policies. What has been missing from the experts’ toolkit is the monetarist model of national income determination. The monetary approach posits that changes in the money supply, broadly determined, cause changes in nominal national income and the price level (as well as relative prices — like asset prices). Sure enough, the growth of broad money and nominal GDP are closely linked. The data in the following chart speak loudly to the linkage.
Greece’s monetary tune started to be played by the ECB in 2001, when Greece was allowed to adopt the euro on false pretenses. Yes, the experts at the Hellenic Statistical Authority had cooked the Greek books, and the experts at Eurostat knew the Greek data were phony. Still, Greece was allowed to enter the eurozone. Following the Northern Rock fiasco and bank run in September 2007 and the bankruptcy of Lehman Brothers in September 2008, the ECB allowed the supply of state money to grow. Then, in 2009, Jürgen Stark, the ECB chief economist, convinced the President of the ECB Jean-Claude Trichet that state money (the monetary base) was growing too rapidly and that excessive inflation was just around the corner. In consequence, the ECB withdrew its non-standard measures (read: credit facilities) to Greek banks in the spring of 2010. As the accompanying chart shows, that fateful ECB withdrawal marked a turning point in the growth of broad money in Greece. It, and the Greek economy, have been contracting ever since. This was in spite of a massive fiscal stimulus (a fiscal deficit of 12.7% of GDP) in 2009, prior to the October elections. Money dominates. The important thing to watch is the growth of broad money.
Shortly after the October 2009 victory of the Panhellenic Socialist Movement brought George Papandreou to power, his government passed a so-called austerity budget in which the fiscal deficit was supposed to be squeezed down to 9.4% of GDP. Greece was clearly in trouble and needed a helping hand. But, the EC and ECB were untrusting of the Greek government. So, in March 2010, the IMF was called in to negotiate loan conditions for new Greek financing. Dominique Strauss-Kahn (DSK) was the IMF’s managing director and was preparing to run for the French presidency as the Socialist candidate. DSK was more than willing to give his socialist brothers in Athens a helping hand. In 2010, Greece received a massive bailout. Just how massive? Normally, the IMF is limited to lending up to six times a country’s IMF quota subscription to that country. However, if the IMF judges a country’s debt to be sustainable, then that country can qualify for “exceptional access,” and the IMF credit extended to such a country can exceed the 600% limit. Thanks to DSK and the IMF experts, the debt sustainability reports were rosy, until recently. The IMF, as well as the other members of the troika, extended credit to Greece, and did so generously. The following table tells the tale. Greece holds the record for the highest IMF credit level relative to a country’s quota.
The first and second bailouts of May 2010 and February 2012 did boost the growth rate of state money. But, bank money, which accounts for the lion’s share (over 80%) of total money (M3) contracted at a very rapid rate. In consequence, the money supply (M3) has generally plunged since the bailouts, and so has nominal (and real) economic activity. And the worst is yet to come: note that the last dismal data for state and bank money in Greece are for June. Since then, things have deteriorated, with bank closures and the imposition of capital controls. This spells more trouble for Greek banks that produce over 80% of Greece’s money and for the economy. The four big Greek banks were already in trouble (as of Q1 2015). The accompanying table presents the Texas Ratios for the four banks that make up 87% of bank assets in Greece. Ratios over 100% mean that, if nonperforming loans must eventually be written off, a bank will become insolvent. If current data were available, I believe the nonperforming loans would be much higher than in the first quarter of 2015. In addition, with the collapse of the money supply and little chance of a recovery in the production of bank money, a high percentage of nonperforming loans will be written off. In consequence, the Greek banking system will be insolvent. This means that calls for a fourth Greek bailout are right around the corner.
The IMF failures in Greece bring back vivid memories of the Asian Financial Crisis of 1997-98. On August 14, 1997, shortly after the Thai baht collapsed on July 2nd, Indonesia floated the rupiah. This prompted the IMF to proclaim that “the floating of the rupiah, in combination with Indonesia’s strong fundamentals, supported by prudent fiscal and monetary policies, will allow its economy to continue its impressive economic performance of the last several years.” Contrary to the IMF’s expectations, the rupiah did not float on a sea of tranquility. It plunged from 2,700 rupiahs per U.S. dollar at the time of the float to lows of nearly 16,000 rupiahs per U.S. dollar in 1998. Indonesia was caught up in the maelstrom of the Asian crisis. By late January 1998, President Suharto realized that the IMF medicine was not working and sought a second opinion. In February, I was invited to offer that opinion and began to operate as Suharto’s Special Counselor. I proposed as an antidote an orthodox currency board in which the rupiah would be fully convertible into the U.S. dollar at a fixed exchange rate. On the day that news hit the street, the rupiah soared by 28% against the U.S. dollar. These developments infuriated the U.S. government and the IMF. Ruthless attacks on the currency board idea and the Special Counselor ensued. Suharto was told in no uncertain terms — by both the President of the United States, Bill Clinton, and the Managing Director of the IMF, Michel Camdessus — that he would have to drop the currency board idea or forego $43 billion in foreign assistance. Why all the fuss over a currency board for Indonesia? Politics. The U.S. and its allies wanted a regime change in Jakarta, not currency stability. Former U.S. Secretary of State Lawrence Eagleberger weighed in with a correct diagnosis: “We were fairly clever in that we supported the IMF as it overthrew [Suharto]. Whether that was a wise way to proceed is another question. I’m not saying Mr. Suharto should have stayed, but I kind of wish he had left on terms other than because the IMF pushed him out.” Even Michel Camdessus could not find fault with these assessments. On the occasion of his retirement, he proudly proclaimed: “We created the conditions that obliged President Suharto to leave his job.” As the Indonesian episode should teach us, the IMF’s management can be very political and often neither trustworthy nor competent. Greece offers yet another chapter. | |||||||||||||||||||||||||||||||||||||||||||||||||||||||||||||||||||||||||||||||||||
| Posted: 31 Jul 2015 03:24 PM PDT Jim Sinclair's Commentary Mr. Williams shares the following with us. - U.S. Economic Activity Was Just Downgraded; Historical GDP Numbers Were Revised Meaningfully Lower; Second-Half 2012 Now Is Shown at Near-Recession - Post-2007 Economic History Slowly Is Taking on a Revised Pattern of a Multiple-Dip Economic Collapse - Unfolding “New” Recession Remains Very Much in... Read more » The post In The News Today appeared first on Jim Sinclair's Mineset. | |||||||||||||||||||||||||||||||||||||||||||||||||||||||||||||||||||||||||||||||||||
| Paul Craig Roberts-Economic House of Cards, Demand for Gold and Silver Very Very High Posted: 31 Jul 2015 03:00 PM PDT Former Assistant Treasury Secretary Dr. Paul Craig Roberts has repeatedly called the global economy a "house of cards." Currently, demand for physical gold and silver is spiking even though prices are falling. What does this mean? Dr. Roberts says, "Some people clearly understand it, and... [[ This is a content summary only. Visit http://www.newsbooze.com or http://www.figanews.com for full links, other content, and more! ]] | |||||||||||||||||||||||||||||||||||||||||||||||||||||||||||||||||||||||||||||||||||
| Gold Daily and Silver Weekly Charts - Entering the Active Month of August - July Payrolls Next Week Posted: 31 Jul 2015 01:07 PM PDT | |||||||||||||||||||||||||||||||||||||||||||||||||||||||||||||||||||||||||||||||||||
| Infographic: The Origin of the Greek Crisis Posted: 31 Jul 2015 12:50 PM PDT This post Infographic: The Origin of the Greek Crisis appeared first on Daily Reckoning. In past charts and infographics, we've broken down parts of the Greek crisis with a focus on particular issues. For example, the exodus in population or a breakdown of Greece's debt by creditor. However, today's infographic puts everything all in one place and recaps the full story from start to near-finish. There is a thorough timeline that shows the events that have led to today in chronological order. The infographic also charts various struggles, ranging from the country's failure in collecting taxes to the exponential increase in net borrowing after the Lehman collapse. Here's a quick recap of the most salient facts in the infographic:
Regards, Jeff Desjardin Editor's Note: Be sure to sign up for The Daily Reckoning — a free and entertaining look at the world of finance and politics. The articles you find here on our website are only a snippet of what you receive in The Daily Reckoning email edition. Click here now to sign up for FREE to see what you're missing. This infographic was originally posted at Visual Capitalist, right here. They thank the Purefunds Big Data ETF (BDAT) for helping them put this together. The post Infographic: The Origin of the Greek Crisis appeared first on Daily Reckoning. | |||||||||||||||||||||||||||||||||||||||||||||||||||||||||||||||||||||||||||||||||||
| The Gross Mispricing in the Gold Market Risks the Global Financial System - A Fraud Too Far Posted: 31 Jul 2015 12:19 PM PDT | |||||||||||||||||||||||||||||||||||||||||||||||||||||||||||||||||||||||||||||||||||
| Israelis Arrested in JPMorgan Hack Case - #NewWorldNextWeek Posted: 31 Jul 2015 11:19 AM PDT Welcome to New World Next Week — the video series from Corbett Report and Media Monarchy that covers some of the most important developments in open source intelligence news. This week: The Financial Armageddon Economic Collapse Blog tracks trends and forecasts , futurists , visionaries... [[ This is a content summary only. Visit http://www.newsbooze.com or http://www.figanews.com for full links, other content, and more! ]] | |||||||||||||||||||||||||||||||||||||||||||||||||||||||||||||||||||||||||||||||||||
| Preparing for Financial Disaster Is More Necessary Than Ever! | Mike Rivero Posted: 31 Jul 2015 11:01 AM PDT IN THIS INTERVIEW: - It's more important to prepare than ever! ►0:33 - "All wars are bankers' wars" ►10:54 - If the economy is so week, why is the stock market so high? ►18:01 - Gold manipulation ►20:50 - The emergence of local currencies and the collapse of the dollar... [[ This is a content summary only. Visit http://www.newsbooze.com or http://www.figanews.com for full links, other content, and more! ]] | |||||||||||||||||||||||||||||||||||||||||||||||||||||||||||||||||||||||||||||||||||
| Posted: 31 Jul 2015 10:09 AM PDT Gold has certainly had a rough summer, facing withering selling pressure from record futures shorting. The resulting new secular lows have greatly exacerbated the already-extreme bearish psychology long plaguing this metal. But considering the howling headwinds gold has suffered in recent years, it has actually proved amazingly resilient. This indicates strong latent demand due to accelerate as sentiment shifts. The consensus view on gold today is overwhelmingly bearish, with virtually everyone convinced it is doomed to spiral lower indefinitely. They argue that gold yields nothing, so therefore why bother owning it? Especially with the first Fed rate hikes in over 9 years looming! As interest rates begin inexorably mean reverting higher, rising yields will leave gold even farther behind. Keynes’ “barbarous relic” can’t compete. | |||||||||||||||||||||||||||||||||||||||||||||||||||||||||||||||||||||||||||||||||||
| Donald Trump on Hillary Clinton: She has a lot to hide Posted: 31 Jul 2015 07:00 AM PDT Anderson Cooper speaks with Trump about the 2016 race and his own political donations. The Financial Armageddon Economic Collapse Blog tracks trends and forecasts , futurists , visionaries , free investigative journalists , researchers , Whistelblowers , truthers and many more [[ This is a content summary only. Visit http://www.newsbooze.com or http://www.figanews.com for full links, other content, and more! ]] | |||||||||||||||||||||||||||||||||||||||||||||||||||||||||||||||||||||||||||||||||||
| The Military Industrial Complex -- Why Does America Love Its Military So Much? Posted: 31 Jul 2015 06:43 AM PDT The U.S. devotes billions of dollars to defense, but some worry it's too much. So, what exactly is the military-industrial complex? The Financial Armageddon Economic Collapse Blog tracks trends and forecasts , futurists , visionaries , free investigative journalists , researchers ,... [[ This is a content summary only. Visit http://www.newsbooze.com or http://www.figanews.com for full links, other content, and more! ]] | |||||||||||||||||||||||||||||||||||||||||||||||||||||||||||||||||||||||||||||||||||
| Posted: 31 Jul 2015 06:03 AM PDT As always in June, Incrementum AG (an independent asset management & wealth management company based in the Principality of Liechtenstein) published its annual “In Gold We Trust” report, the extended version of which can be downloaded here. We know that it was published one month ago; however, it took a while to dig through the 140-page text. Because it offers many interesting insights into the current global economy and the gold market, we provide a short summary for you today. | |||||||||||||||||||||||||||||||||||||||||||||||||||||||||||||||||||||||||||||||||||
| Gold and Silver Markets in Limbo Posted: 31 Jul 2015 06:00 AM PDT Gold and silver remain close to their lows for the year, discouraged as usual by dollar resilience. Precious metals appear to be in limbo: speculative buyers are discouraged above all by their disappointing performance during the Greek crisis, and the possibility that a Chinese stock market crash might lead to forced selling of gold by Chinese speculators. So far, the latter concern has proved unfounded with public demand in China accelerating on lower prices and exceeding global mine output on its own. | |||||||||||||||||||||||||||||||||||||||||||||||||||||||||||||||||||||||||||||||||||
| Silver – A Century of Prices Posted: 31 Jul 2015 05:51 AM PDT The graph below shows 100 years of silver and crude oil prices on a log scale using the annual average of daily prices. Example: The price of silver peaked in 1980 at about $50 but the smoothed annual average was about $16. | |||||||||||||||||||||||||||||||||||||||||||||||||||||||||||||||||||||||||||||||||||
| Demand for Gold Bullion Surges – Perth Mint, and U.S. Mint Cannot Meet Demand Posted: 31 Jul 2015 05:47 AM PDT - Perth Mint sees surge in demand and cannot keep up with demand - “Our biggest restriction is the amount of unrefined gold we’re getting in from producers” - Very high demand for Perth Mint coins, bars coming from Asia, U.S. and Europe - U.S. Mint sees highest sales of gold coins in over 2 years - U.S. Mint restrictions on silver coins due to very high demand - Gold sentiment has moved from despondency to depression (see chart) - Current negative sentiment despite strong demand is good contrarian indicator | |||||||||||||||||||||||||||||||||||||||||||||||||||||||||||||||||||||||||||||||||||
| Are Silver Spot Prices Poised for an Increase? Posted: 31 Jul 2015 03:23 AM PDT Jenna Cyprus writes: As anyone with significant investments in silver knows, prices have been on a steady decline for the better part of four years now. In fact, you have to go all the way back to the beginning of 2012 to find prices above $40. Since then, the trajectory has firmly pointed downwards. Currently you can purchase an ounce of silver for less than $15. Analysts suspect this won’t be the case for long. While ‘experts’ have predicted for months now that silver is finally positioned for growth, there seems to be more tangible proof for today’s predictions. Things finally appear to be looking up and now may be the time to diversify your portfolio. | |||||||||||||||||||||||||||||||||||||||||||||||||||||||||||||||||||||||||||||||||||
| Craig Johnson Still Bullish on Stocks; Sees More Downside for Gold, Oil, and Commodities Posted: 30 Jul 2015 05:00 PM PDT Piper Jaffray's Craig Johnson offers his thoughts on the market and reiterates his target for 2350 on the S&P 500 by year-end. With regards to a large market correction on the horizon, Craig notes that leading sectors, like financials and consumer discretionary, are not breaking down... |
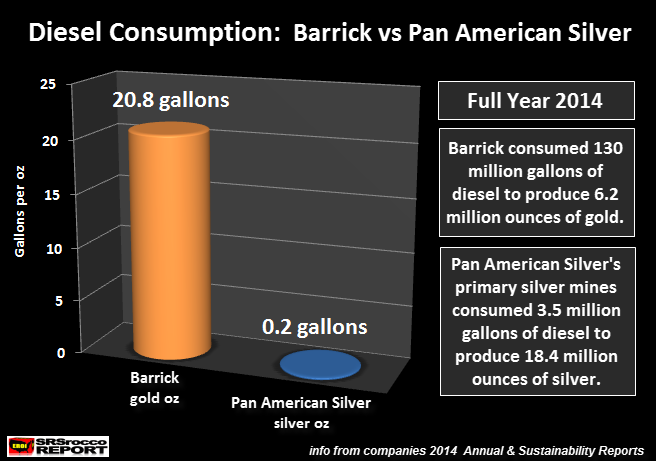 If you are a precious metals investor, you need to see this chart. Matter-a-fact, this is the first time (to my knowledge) in the history of precious metals analysis that the information in this chart has been made public. One look at this chart and the investor will see the the huge difference between the cost to produce the precious metals.


| You are subscribed to email updates from Save Your ASSets First To stop receiving these emails, you may unsubscribe now. | Email delivery powered by Google |
| Google Inc., 1600 Amphitheatre Parkway, Mountain View, CA 94043, United States | |
No comments:
Post a Comment