


saveyourassetsfirst3 |
- This is what a soaring U.S. dollar could really mean for the global economy
- Death of the Dollar
- The No. 1 most valuable investment secret of all
- 90-Year-Old WW2 Veteran and Two Clergymen Face 60 Days in Jail for Feeding the Homeless in Florida
- Gold: Start of something new?
- Gold And Silver Price, Crude Oil and S&P Ending Large Wedge Patterns
- Events Impacting The Gold And Silver Price In The Week Of November 17th
- A Signal of Coming Collapse
- The Golden Bottom
- The World is Ditching Its “3rd Wheel”, Finally!
- More opportunity likely for shorting Gold: Barclays
- Gold and silver short term resistance and support levels
- Gold & Silver Trading Alert: How High Will Gold Go?
- Dramatic gold import increase can't hurt Indian trade deficit
- Metals market update for November 17
- Indian banks rethink gold lending
- Monex Precious Metals Review: Gold hits high of $1193, silver support $15.05
- The World is Ditching Its “3rd Wheel”, Finally!
- Elliott Wave analyst sees big gold and silver price surge ahead
- The Most Important Question about Gold and Silver Price Suppression, Answered!
- How Much Earmarked Gold Holds The Federal Reserve?
- ‘Yes' vote in Swiss referendum not certain to lift gold prices
- RBI talking to gov’t about more gold import curbs
- Cameron Says Second Global Crash Looming - Russian Relations Worsen at G20, Japan in Recession
- Introducing Open Bazaar – The Decentralization Revolution Takes on Ecommerce
- ECB could buy gold to revive economy
- Key to finding gold is understanding the rocks
- Four key observations from the Deutsche Bank report on the Swiss Gold Initiative
- Swiss gold shenanigans intensify prior to vote
- Chen Lin Says Gold Miners Need to Produce at $1,000/oz or Less to Survive
- Japan now officially back in recession after ’shockingly weak’ Q3 figures as Abenomics fails and yen falls again
- Jim Willie: Fed Launches STEALTH QE4 Through TOKYO- Currency Reset & New Gold Standard Imminent!
| This is what a soaring U.S. dollar could really mean for the global economy Posted: 17 Nov 2014 12:48 PM PST From Charles Hugh Smith for PeakProsperity.com: In early September, I made the case for a rising U.S. dollar, based on the basic supply and demand for dollars stemming from four dynamics:
Since then the dollar has continued its advance, and is now breaking out of a downtrend stretching back to 2005—and by some accounts, to 1985:
(Source) Technically, the Dollar Index has broken out of a multi-year wedge:
So what does this mean for the global economy? Since currencies are intertwined with virtually every aspect of the global economy—trade, credit, inflation/deflation, commodities and capital flows, even political and soft power—there is no one consequence, but a multitude of interactive consequences. For U.S. households, the rising dollar will have gradual, generally marginal effects: our dollars will buy more euros and yen when we visit Europe and Japan as tourists, imports from countries with weakening currencies will be slightly cheaper (if the importers don't palm the difference as extra profit) and we may be competing with more foreigners for dollar-based assets such as American homes, oil wells and Treasury bonds. In sum, a rising dollar will only affect households on the margins. Since roughly 85% of the U.S. economy is domestic, imports and exports have relatively limited influence on the entire economy. In other words, the direct consequences of a stronger dollar on U.S. households are generally positive, with the exception of those working in price-sensitive export industries, where the rising dollar will make goods sold in countries with weakening currencies more costly. But the secondary effects could end up being far more consequential for Americans and everyone else on the planet, for this reason: the centrality of the dollar in the global economy means that the effects of a stronger dollar can create potentially destabilizing dynamics. Central Banks Are Responsible for the Heightened Risk One primary reason for this expansion of risk is the unprecedented actions of the world's central banks since the 2008 Global Financial Meltdown. In effect, the central banks doubled down on debt and leverage as the politically expedient "solution" to the implosion of credit and leverage (what we call de-leveraging) as the collateral underlying highly leveraged loans (think subprime mortgages on overpriced McMansions) evaporated like mist in Death Valley. Any solution that forced the write-down or write-off of the mountain of bad debt would have collapsed the over-leveraged banks which had become linchpins in the global financial system. So the only way to maintain the status quo and avoid handing massive losses of wealth to financial elites was to issue trillions of dollars in new credit-money, lower interest rates to near zero and start buying assets from private-sector owners, turning their assets into cash that could then be used to invest overseas or in domestic stocks and bonds. Each major central bank injected unprecedented sums of new money into their economies to ease the refinancing of debt at lower interest rates and enable expansion of credit for new loans. If each economy (or in the case of the European Union, currency region) was moated by strict capital-control regulations, this massive goosing of credit might have been contained within each economy. But in today's world of digital finance, capital, credit, risk and interest rates all flow wherever the risk is perceived to be controllable and the return is greatest. Let's pause for a moment to recall that risk in 2008 was perceived to be controllable right up until the day that Lehman Brothers declared bankruptcy and the global financial system erupted in a fireball of panic and liquidation. Why was risk considered controllable right up to the implosion? Derivatives and hedges were widely assumed to be solid protection against any spot of bother in global credit markets. But this confidence was misplaced, as it ultimately relied on multiple counterparties retaining their solvency. If a position was hedged by a derivative that was to be paid by a counterparty if things went south, and the counterparty blew up before the hedge could be paid off, there was no hedge. It turned out that liquidity—a market of buyers and sellers that allows any security to be sold more or less whenever the seller decides to sell—dried up, and markets for risky securities went bidless, i.e. there were no buyers at any price. If there are no buyers, the value of the security drops to zero, and everybody down the line who counted on that security fetching the anticipated price so their hedge could be paid off also implodes. Central banks countered this implosion by buying bonds and mortgages and lowering interest rates so old debt could be refinanced at much lower costs. But in doing so, they created a vast market for global carry trades—the borrowing and buying of assets in various currencies to take advantage of yield and interest-rate differences. In the old pre-digital days, it was difficult to arbitrage these variations in national currencies and interest rates. But in today's world, it's easy for financiers and financial institutions to borrow money in dollars or yen at low interest rates and re-invest the money in higher-yield securities issued in other countries. The Problem with Carry Trades and Cross-National Debt The central bank's massive issuance of new money put trillions of dollars in the carry trade, and this vast expansion of global currency/interest-rate arbitrage has put currency values front and center. The carry trade simply means cheap-to-borrow money in the US and Japan flows to emerging markets where rates are higher. If you can borrow $1 billion at a 0.25% rate in the U.S. or Japan and then buy emerging-market bonds that pay much higher yields, why not? The profit is free money. The sums of money being gambled in carry trades are enormous. It is estimated that $7 trillion of emerging market debt is denominated in another currency. According to the Telegraph newspaper (U.K.), roughly two thirds of the $11 trillion in cross-national loans are denominated in U.S. dollars. $11 trillion may not seem like much when compared to America's $16 trillion gross domestic product (GDP), but the emerging markets which have been the happy recipients of this vast river of capital have much smaller economies and credit markets. They also have fewer options to refinance debt, as they lack heavyweight central banks like the Bank of Japan, the European Central Bank and the Federal Reserve. As a result, these capital flows are extremely consequential and thus potentially disruptive. Here's the risk in carry trades: if the currency you borrowed the money in strengthens and the currency you're receiving the interest payments in weakens, the deal sours. The rise and fall in currencies can erase the profits of the carry trade. If the currencies weaken/strengthen beyond break-even, a once-profitable trade turns into a losing trade. And how do you extricate yourself from the carry trade? You sell the emerging-market assets and repatriate the money back into the currency you borrowed the money in: for example, the U.S. dollar. This has immediate supply-demand effects on currencies. The emerging-market currency that's being sold drops in value while the currency that's in demand (U.S. dollars) strengthens. We might imagine that the Federal Reserve ending its vast money-issuance program of quantitative easing would lessen the global risk posed by the carry trade, as it reduces the flood of dollars seeking higher-yield homes outside the U.S. But this tightening has actually increased the risk of carry trades blowing up and bringing down emerging-market economies, for it reduces the flow of fresh capital into emerging markets. As the supply of dollars dries up, demand for dollars rises as carry trades are unwound. Emerging-market currencies then weaken significantly, causing profitable carry trades to reverse into losing trades, which then causes those holding debt in dollars and assets in other currencies to dump the assets and pay off the dollar-denominated debts before the trade goes even more against them. There is a positive feedback in play: the more the dollar rises, the greater the losses in carry trades denominated in the dollar, and the greater the incentive for those still in the trade to sell emerging market assets and currencies. In response to these massive outflows of capital, emerging nations must raise interest rates quickly to offer incentives for capital to stay put, which then causes the cost of new loans (and doing business in general) to quickly rise to painful levels. As the currencies suffering outflows decline against the dollar, imports become more expensive and exports lose value when traded for dollars. It's a triple-whammy for emerging nations: their borrowing costs are soaring, the capital leaving to pay off dollar-denominate debt leaves them starved for investment capital, and their imports rise in cost as their exports earn less. So here is the net result of central banks pursuing quantitative easing and zero-interest rates: a massive increase in global risks resulting from the carry trades the money expansion and cheap rates fueled. The central banks' "solution" has blown another global bubble of risk that now threatens to destabilize not just the carry trades but the economies and credit systems that have become intertwined with the carry trade. In effect, the failure to address the structural problems revealed in the Global Financial Meltdown of 2008-2009 have been transferred to the larger foreign-exchange (FX) market, which is connected to virtually everything in the global economy. In Part 2: Why The Strengthening Dollar Is A Sign Of The Next Global Crisis, we examine these risks to the global economy. Not only is a rising dollar a sign of weakness elsewhere in the world, but the higher it rises, the more destabilizing global currency imbalances become. If it rises too high, it then becomes a cause of further destabilization — one that could trigger the next global crisis. Click here to access Part 2 of this report (free executive summary; enrollment required for full access) |
| Posted: 17 Nov 2014 11:10 AM PST The fact that the U.S. dollar is a dying currency is a foregone conclusion. The (negative) fundamentals of the dollar are overwhelming, for two reasons: their magnitude and their irreversibility. These harbingers of the dollar's doom center on three areas: 1) An ultra-extreme over-supply of dollars, due to several years of money-printing at a hyperinflationary rate. 2) A simultaneous collapse in demand for the dollar, as it loses its status as global reserve currency (replaced by China's renminbi). 3) The irreversible decay and imminent collapse of the U.S. economy itself. Those are the three, principal fundamentals of any currency: supply, demand, and the (supposed) "backing" for the currency itself, which (in the case of our paper "fiat currencies") is nothing more than the economic output of the underlying economy. With respect to supply; any reader who considers it hyperbolic to depict the supply of dollars as "ultra-extreme" simply hasn't seen the chart showing its exponential explosion. Indeed, describing the picture below as anything short of "ultra-extreme" would be understatement.
While the collapse in demand for the dollar hasn't been as (frighteningly) spectacular as the explosion in supply, it is just as irreversible as the exponential curve above. The reason why this second, terminal fundamental is irreversible (as the dollar is replaced by the renminbi) is a direct function of the first and third fundamentals. Because the value of the dollar has been grossly debauched through over-printing (despite its fraudulent exchange rate); the Rest of the World is rejecting it as a benchmark for global trade. Because the U.S. economy itself is in irreversible decline; the dollar could not be sustained much longer as a reserve currency, as a simple function of mathematics/economics. |
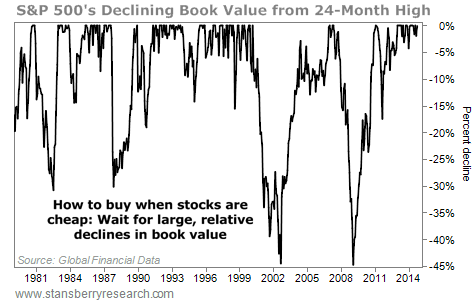
| The No. 1 most valuable investment secret of all Posted: 17 Nov 2014 10:10 AM PST From Porter Stansberry in The S&A Digest: Today, I’m going to show you one of the most advanced investment skills you could ever master… But I don’t want to tell you upfront what today’s lesson is about. I want to see if you can figure it out yourself. So don’t skip ahead. Think of today’s essay as a test. As I always say… there is no such thing as teaching, there is only learning. And there’s a hugely valuable investment lesson – the most valuable secret of all – below… Let’s start with the big secret about the father of value investing, Ben Graham. (It’s not that he was a notorious philanderer… Everyone knew that.) Most people know Graham literally wrote the book (or books) on how to invest: Securities Analysis and The Intelligent Investor. Likewise, most people know he was a successful investment manager. That’s all true, of course. But most people don’t know how Graham got rich. Here’s a big hint: It had nothing to do with his normal method of value investing. It had everything to do with insurance. For most of his career, Graham avoided buying insurance companies and never put more than 5% of his portfolio into any individual security. But in 1948, at the age of 54, Graham decided to allocate 25% of his portfolio into insurance firm GEICO. He bought 50% of the company for $712,000. After the purchase, the Securities and Exchange Commission (SEC) decided investment partnerships like Graham’s couldn’t own a controlling interest in an insurance company. To get around the rules, Graham distributed the GEICO shares among the various investors in his partnership. Graham never sold the shares he received from the distribution. By 1972, Graham’s stake in GEICO was worth $400 million. He made more than 400 times his money in 25 years. It wasn’t a lifetime of careful value investing that made Graham a wealthy man… It was an investment in GEICO. Graham made vastly more money in GEICO than he made in all of his other investments combined. About 10 years after buying GEICO, Graham had made so much money that he quit investing altogether and closed his fund. The success Graham had with GEICO led Warren Buffett – who was Graham’s student at Columbia University – to study the company intensely. In January 1951, Buffett famously visited the company’s headquarters on a Saturday, knocking at the front door until a janitor let him in. After speaking with GEICO executive Lorimer Davidson for four hours, Buffett put 65% of his savings in GEICO’s stock – a stake worth about $10,000. He wrote up the stock for his clients in a report titled “The Security I Like Best.” The next year, Buffett sold his position for a 50% gain or so. But the lessons Buffett learned from Davidson went on to guide Buffett’s entire investing career. Buffett has said publicly many times that those four hours with Davidson changed his life. Buffett didn’t own GEICO shares again until 1976. The company stumbled badly in the early 1970s when government regulations (no-fault rules), inflation, and aggressive plaintiffs’ attorneys radically transformed the risks of auto insurance. The company lost $126 million in 1975 and looked as though it might go bankrupt. The board brought in a new CEO, Jack Byrne, who radically restructured the company. He fired 4,000 of GEICO’s 7,000 employees, closed down 100 offices, and exited the Massachusetts and New Jersey markets. Byrne raised insurance rates by 40%. Incredibly, in less than a year, GEICO was back in the black. By 1977, GEICO was paying a dividend again. In May 1976, Buffett met with Byrne. He was impressed. Buffett believed the turnaround at GEICO would be successful. It’s a little ironic, because Buffett is famous for refusing to invest in turnaround situations. He says most turnarounds “don’t.” But in this case, he had been following the company closely for 25 years… and determined it was the best business he had ever found. He got to know the CEO. He knew he could personally provide the financing required. That’s a much different situation than you or me buying shares of a cheap stock and hoping it goes back up. Following a dinner with Byrne, Buffett began to buy huge blocks of GEICO shares. The first order was for 500,000 shares at $2.12. He later provided a huge amount of capital to the company – $75 million – through a convertible bond. His cost basis for the stock through this instrument was $1.31 per share. Buffett’s money helped save GEICO. By 1980, he owned one-third of the company. GEICO represented 31% of Berkshire Hathaway’s equity portfolio at the time. Like his mentor Ben Graham, Buffett was now poised to make tremendous profits. He had allocated a huge portion of his net worth into the best business he had ever found. By 1985, GEICO represented 50% of Berkshire’s portfolio. By 1994, Berkshire had received $180 million in dividends from GEICO – seven times more money than Buffett spent on buying the stock. Finally, in 1995, Disney bought out ABC/Capital Cities, whose shares Berkshire held. The deal gave Buffett a huge $2 billion profit. Buffett used the cash to buy the remainder of GEICO that Berkshire didn’t own for $2.3 billion. By that point, Buffett had earned 48 times his initial investment in the company. Today, GEICO’s float (the amount of insurance premiums it carries) is in excess of $16 billion – up from $3 billion in 1995. If GEICO was publicly traded, it would be worth something around $20 billion. Buffett’s initial $25 million investment would now be worth at least $10 billion… 400 times his initial investment. Now… with that in mind… let me switch gears for a minute. The chart you see below is unusual. I would wager you haven’t seen a chart like this before. It’s designed to show you periods of time when you should have been buying stocks. It does so in a simple way: it measures changes to the S&P 500′s book value as a percentage below its 24-month high. We have good data on the S&P 500′s book-value ratio since 1978. This chart makes it clear when good opportunities to buy stocks existed. Longtime investors will surely be familiar with these years: 1981, 1987, 2002, and 2009…
During my career – from 1996 to today – I’ve seen several excellent buying opportunities in stocks… The first was in August 1998 when Russia defaulted. Many high-quality emerging-market stocks were trading for less than four times earnings. The second was the end of the tech-stock bubble in 2002. My Investment Advisory subscribers can read the October 2002 issue to see how I described conditions at the time. (On the first page, I asked, “Is it the end of the world?”) During this period, many high-quality technology-related businesses were trading for less than the cash on their balance sheets. The biggest, best-known market correction of my career was in late 2008/2009, when even the world’s highest-quality businesses were trading at decade-low valuations. I recall analyzing shares of jewelry company Tiffany in February 2009 and realizing that the stock was worth $24 per share, assuming you just sold the inventory and used the proceeds to buy back all of the stock and pay off all of the debts. The stock was trading at $22. Tiffany was trading below liquidation value, implying that you could get the brand name, the operating profits, the future growth, and all of the real estate for free. I doubt you’ll ever see an investment as good as Tiffany’s trading cheaper than that. (As a side note, Tiffany shares trade for around $96 today. The company has paid $6.44 per share in dividends. By simply buying shares in February 2009, you would be up more than 360%.) Based on these experiences, I’ve come to expect a good opportunity to buy stocks about once every five to seven years… and a great opportunity to come around about once every decade. Lo and behold, when I asked Steve Sjuggerud’s research analyst Brett Eversole to check the historical numbers for me, he found eight different 19%-plus corrections (declines) in the S&P 500 since 1976. Again, these dates will be familiar to longtime investors: 1977, 1981, 1987, 1990, 1998, 2002, 2008, and 2011. Investors become euphoric after a period of gains. They become depressed after losses. It’s human nature that’s being expressed in these charts. What’s the difference between a good opportunity to buy and a great one? Studying the corrections we’ve seen since the 1970s, a good opportunity is a 20% or so decline in the S&P 500′s price-to-book-value ratio. The 2011 correction saw the S&P 500 fall 19.4%, but the ratio only declined 17.5%. This was the least impressive opportunity in our study, but that’s largely because stocks were coming from a super-depressed bottom two years earlier. In contrast, a great opportunity to buy is after the S&P 500′s book-value ratio declines 30% or more, like it did in 1981, 1987, 2002, and 2008. The 1990s – a roaring bull market inspired by falling interest rates – was the only decade in my lifetime that didn’t offer a great opportunity to buy stocks. Keep in mind that if the book-value ratio of America’s 500 largest companies has declined by 30% or more, you will be able to find dozens (if not hundreds) of high-quality businesses where book-value ratio has declined 50% or more. So… What do you think the underlying message of today’s essay is? Remember, I was trying to teach you the most advanced skill you can possess as an investor. What’s that skill? What do these stories reinforce? The most advanced skill you can develop as an investor isn’t knowledge of arcane accounting rules. It’s not developing real expertise in charting. It’s not even becoming an expert in position-sizing and risk management. The most advanced skill you can develop as an investor is simply the emotional discipline to be incredibly patient. If you want to succeed in investing, you have to be other-worldly in your ability to wait until you get the rarest of opportunities – a chance to buy the businesses you’ve always wanted at the right price. Buffett knew all about GEICO. He saw exactly how it enriched his mentor beyond belief. He knew it would certainly enrich him (assuming he bought it at the right price). As a young man, Buffett had foolishly advertised the opportunity and, even more foolishly, he sold the stock rather than simply continuing to buy more. He then spent the next 34 years waiting for the right opportunity to buy the company. He waited and waited and waited and waited. Then he made 400 times his money. Think about that the next time you’re going to buy a stock. Is it a great time to be buying stocks? Is it the best time you’ve seen in five or 10 years to make investments in the stock market? Is the stock you’re about to buy really trading at the cheapest price you’ve ever seen? Is it really a chance to make 400 times your money over several decades? The more patient you become, the better your investments will be. I guarantee it. Patience is Buffett’s greatest virtue. He figured out what businesses he wanted to own when he was in his 20s. Then he waited until he got the opportunity to buy them at prices he knew would make him extremely rich. There’s no reason you can’t do the same – even if you’re older than 50. Don’t forget: Graham bought GEICO when he was 54. And Buffett’s best investment ever was in Coca-Cola. He started buying the blue-chip soda brand after the 1987 collapse. He was 57 years old when he made that investment. My advice: Keep a list near your computer or on your desk. When you come across a truly great business – a business that has enriched investors for decades – write down the name. Read its annual reports. Follow its progress. Get to know the business like you know your siblings or your spouse. See how the company responds in good times and bad times. Then… wait for the market to give you a great opportunity to buy the stock. |
| 90-Year-Old WW2 Veteran and Two Clergymen Face 60 Days in Jail for Feeding the Homeless in Florida Posted: 17 Nov 2014 10:00 AM PST Land of the Free, Home of the Brave??? Florida cops have arrested and charged 2 clergymen and a 90 year gold WW2 Vet with the dastardly crime… of feeding the homeless in public. Submitted by Michael Krieger, Liberty Blitzkrieg: Drop that plate right now! – Florida police to 90-year-old WW2 vet Arnold Abbott as he […] The post 90-Year-Old WW2 Veteran and Two Clergymen Face 60 Days in Jail for Feeding the Homeless in Florida appeared first on Silver Doctors. |
| Posted: 17 Nov 2014 09:52 AM PST Gold moved substantially higher on Friday and the volume was huge. The session was both significant and bullish, but the question remains if such show of strength can be a start of the next big move. |
| Gold And Silver Price, Crude Oil and S&P Ending Large Wedge Patterns Posted: 17 Nov 2014 09:35 AM PST Gold and silver prices have been trading in declining wedge patterns since 2011. Crude has traded in a flat to down wedge pattern for five years, and the S&P has been moving inexorably higher since early 2009 in a contracting wedge. There are signs of a trend change. Examine the log scale weekly charts below.
Gold prices (above) show a declining wedge pattern with prices currently bouncing off the lower trend line while the RSI (Relative Strength Index) and the TDI Trade Signal indicators are indicating buy signals on the weekly chart. The bounce on Friday the 14th was encouraging. The vertical green lines show very rough 62 week cycle lows that also suggest now is an reasonable time for a low. The weekly trend has been down but a break of the red line at about $1225 would suggest this bottom will finally hold. My estimate is that the price bottom occurred over a week ago.
Silver prices (above) show a similar declining wedge pattern from May 2011. Since then prices have dropped about 70%. The RSI and TDI are deeply over-sold and Friday's bounce was quite encouraging. Similar to gold, the weekly trend has been down but a break above $18 or $19 would probably indicate a sustained rally. My estimate is that the bottom occurred over a week ago.
Crude oil has been trading flat to down since early 2010. The recent drop from over $100 to the middle $70s was a shock to many people. The weekly RSI and TDI have fallen to six year lows and indicate a deeply over-sold market. The green vertical lines are approximate cycle lows. My estimate is that crude oil is at or near a major bottom.
The S&P 500 Index has been rising since early 2009 in an almost correction free rally since early 2011. The rise looks so perfect that one might think it was "manufactured" or "managed." QE is a wonderful thing if you are long S&P stocks or want to sell the "recovering economy" story. Expect the crash when/if it occurs to be truly ugly … or perhaps the S&P can rally another 1,000 points in a perfectly engineered rise that confounds all bears and sets up an even bigger crash. Take some chips off the table. CONCLUSIONSGold and silver look like they have bottomed – again. Perhaps this time it will be a real bottom instead of another fake-out like December 2013 and June 2014. Demand is strong for physical gold and silver, but the supply of naked paper shorts on the COMEX is even larger. This will change. I see prices under $20 as a strong buy zone since I believe that $100 silver is only a few years away. Crude oil has crashed by about 30% in the last five months. The charts show what could be an important bottom. One would think that increasing conflicts in Iraq and the Ukraine would support oil prices. The S&P 500 Index has powered higher for 5 years with only minor corrections. The "Greenspan/Bernanke/Yellen Put" has levitated the market to a very high level. It looks like a danger zone to me.
More Suggested Reading SRSrocco Report The Reverse of Central Bank Gold Flows Spells The Death of The Dollar Gary Christenson | The Deviant Investor | GEChristenson.com
|
| Events Impacting The Gold And Silver Price In The Week Of November 17th Posted: 17 Nov 2014 09:26 AM PST In this article, we summarize the key events of the running week that could have an impact on the price of gold and silver price because of trading in COMEX futures. Over the last week, between November 10th and 15th, both gold and silver started the week steeply lower before rallying very sharply on Friday 15th. The same scenario we described last week applies again: it seems to be a V-bottom in the making. We can’t help but believe that a huge bottom is in the making. We also believe there is a big chance that a final spike lower is in the making after which the metals start recovering from a 3-year bear market. We consider at least a 50% probability that this scenario will occur. The last three weeks are characterized by high volatility in the metals and miners. The large rallies of the last two weeks were not driven by “logic” drivers. For instance, last Friday’s spike higher was supposedly triggered by the worse than expected U.S. retail sales figures. This does not make sense in our opinion. It is our belief that a fight between bulls and bears over sentiment is taking place, with a tendency of bulls to start gaining control. This fits the scenario of a bottom in the making amid sellers exhaustion. The unknown would be whether this would be an intermediate bottom or the final bottom before the bull market continues. It should be noted that last week’s European inflation data came in in line with expectations. Germany’s 0.8% CPI does not suggest inflation so the inflationary argument for gold is weak in the current context. For the week commencing November 17th, there are some key central bank announcements, coming from the U.S., Japan and the European Union. Below is a more detailed calendar of economic data in key markets, but, more importantly, formal central bank announcements. They are not necessarily driving gold and silver prices, but could cause price volatility. As evidenced by the calendar, the second half of the week could be very volatile.
Note: The primary focus of our website is to report on the different aspects of the gold market: fundamentals, economic and monetary analysis, basic technical analysis. Our view on the real price setting in the gold and silver market differs from the mainstream view. Price changes happen to coincide with events or announcements; mainstream media are used to report a relationship between both. However, we believe that the real price setting for the time being is taking place in the COMEX futures market. Market expert Ted Butler does an outstanding job analyzing the weekly evolution in the COMEX market and how it affects price setting. |
| Posted: 17 Nov 2014 09:00 AM PST The Bank of Japan plans to buy ¥8 to ¥12 trillion per month. The government is selling ¥10 trillion per month in new bonds. This is an astonishing development. The Bank of Japan will buy 100 percent of the new government bond issuance. When the central bank is buying all of the bonds issued by […] The post A Signal of Coming Collapse appeared first on Silver Doctors. |
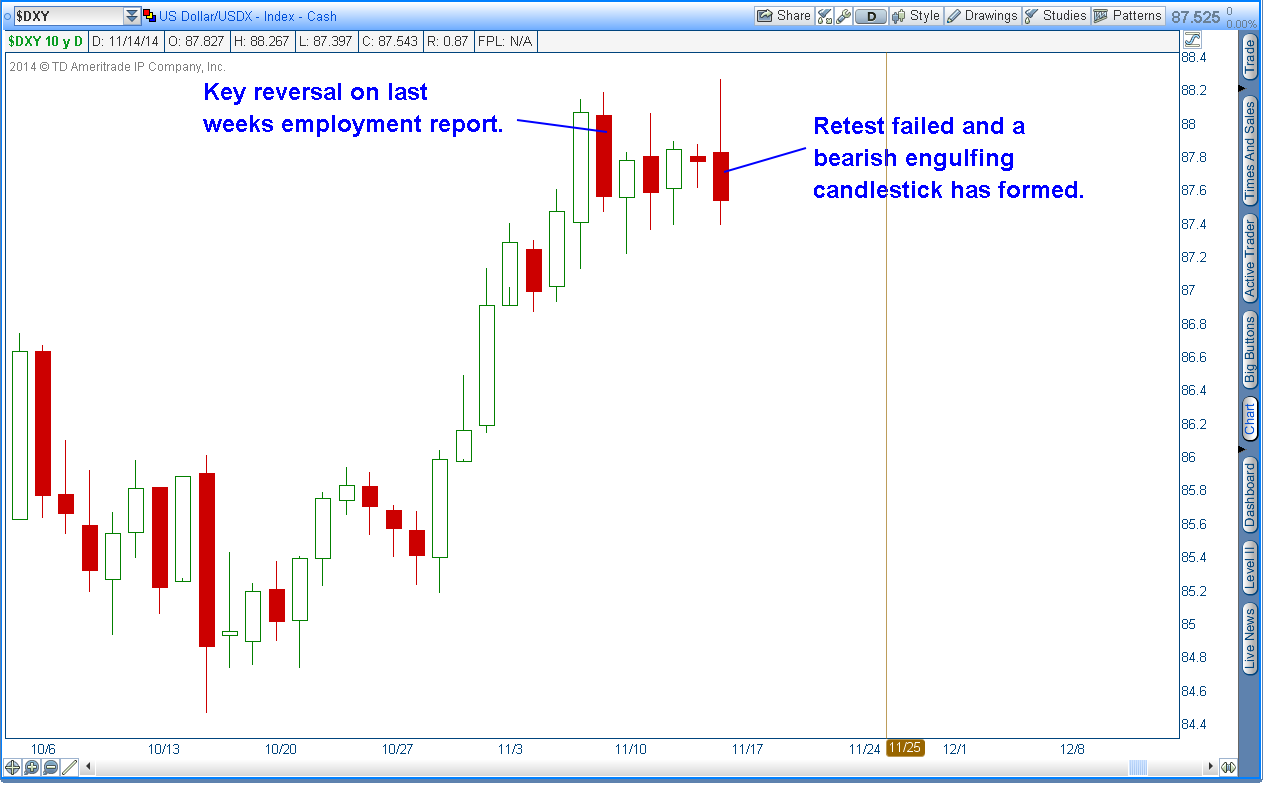
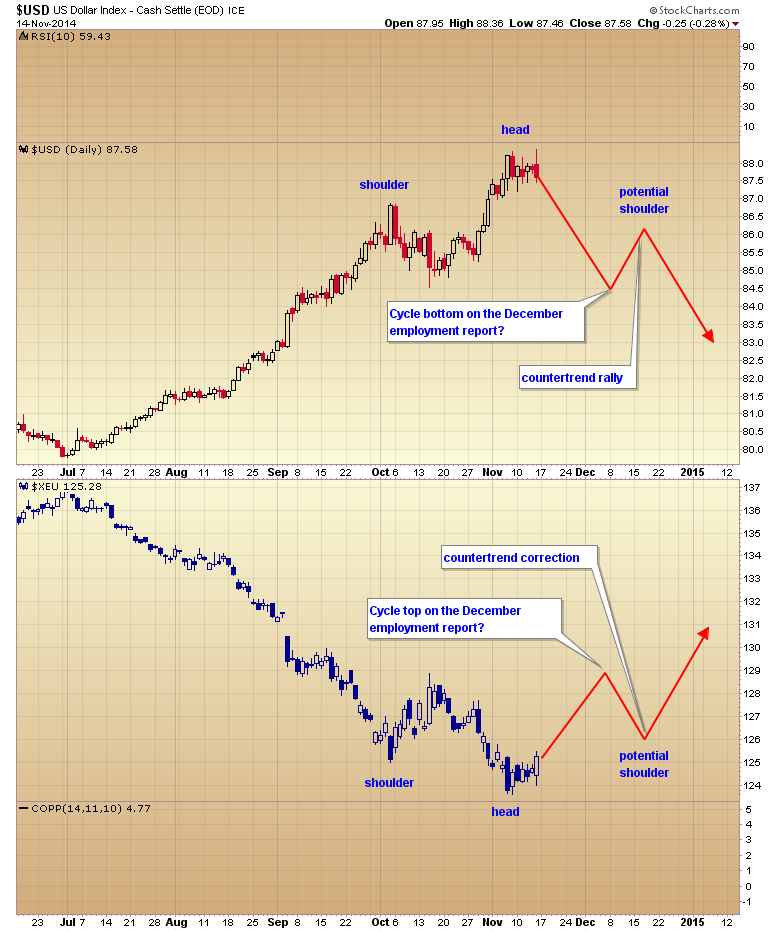
| Posted: 17 Nov 2014 08:39 AM PST Today I'm going to follow up on my last article "Are commodities at a major turning point". If commodities and gold are ready to reverse then the first thing that has to happen is the dollar needs to form a top. I think that may have occurred on November 7th when the last employment report was released. Notice how the dollar formed a key reversal on that day, that was retested Friday and failed, forming a bearish engulfing candlestick.
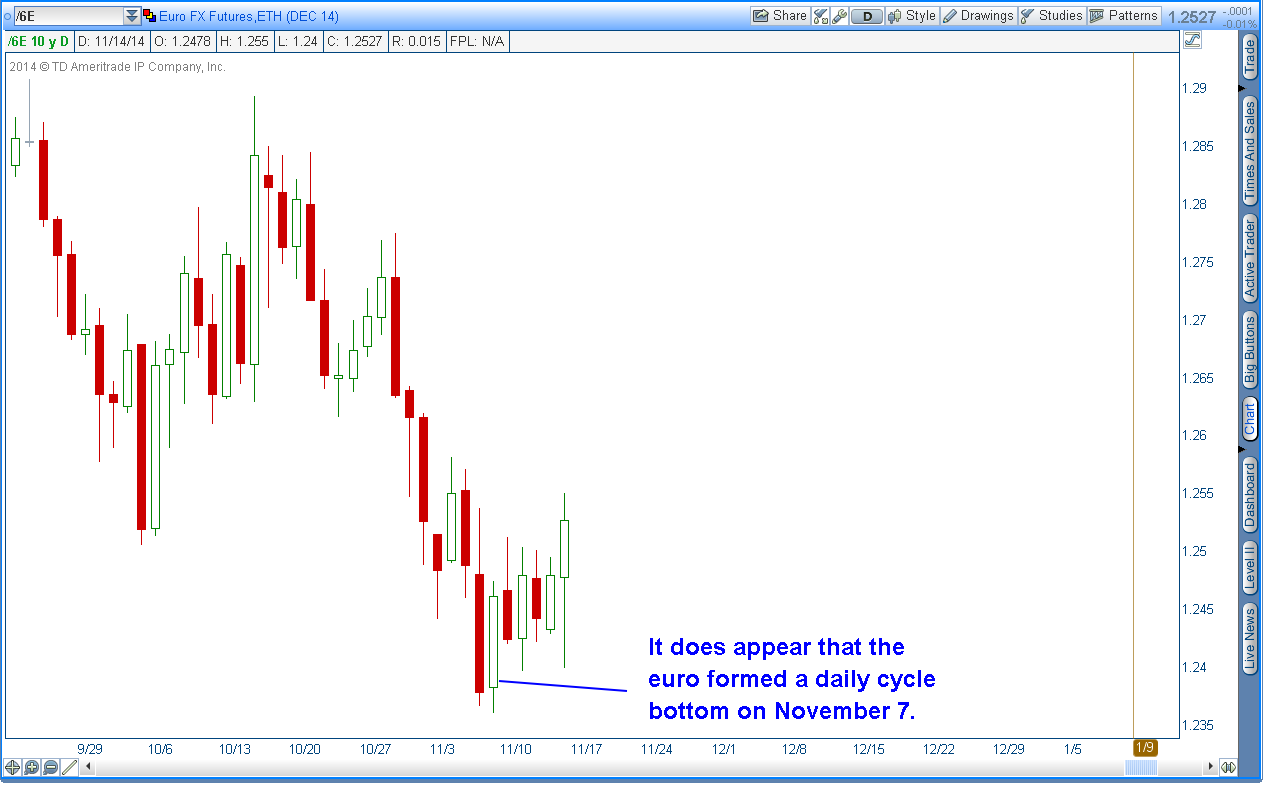
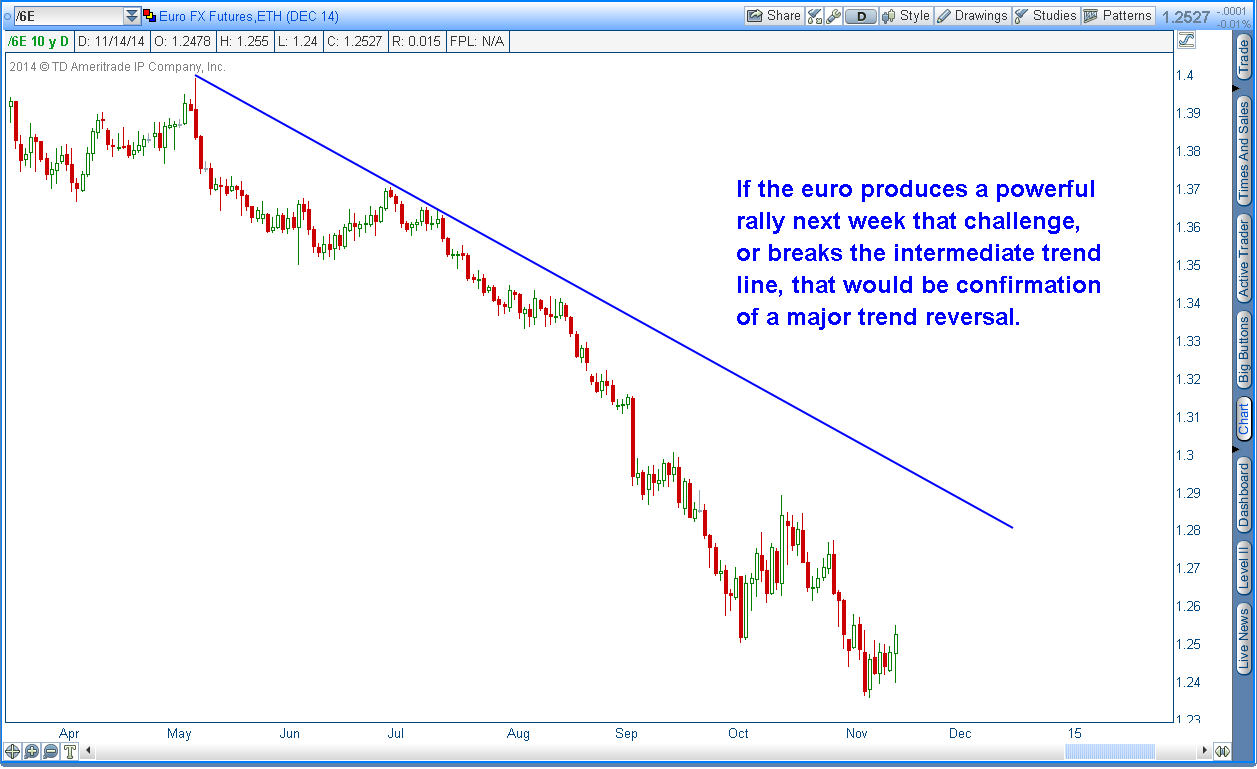
Considering that the daily cycle is now on day 22 and late in the cycle timing band, the odds are good that the reversal Friday marked at least a daily cycle top in the dollar index. If that's the case then the euro's daily cycle should have bottomed. Looking at the euro chart it does appear that the euro bottomed on November 7.
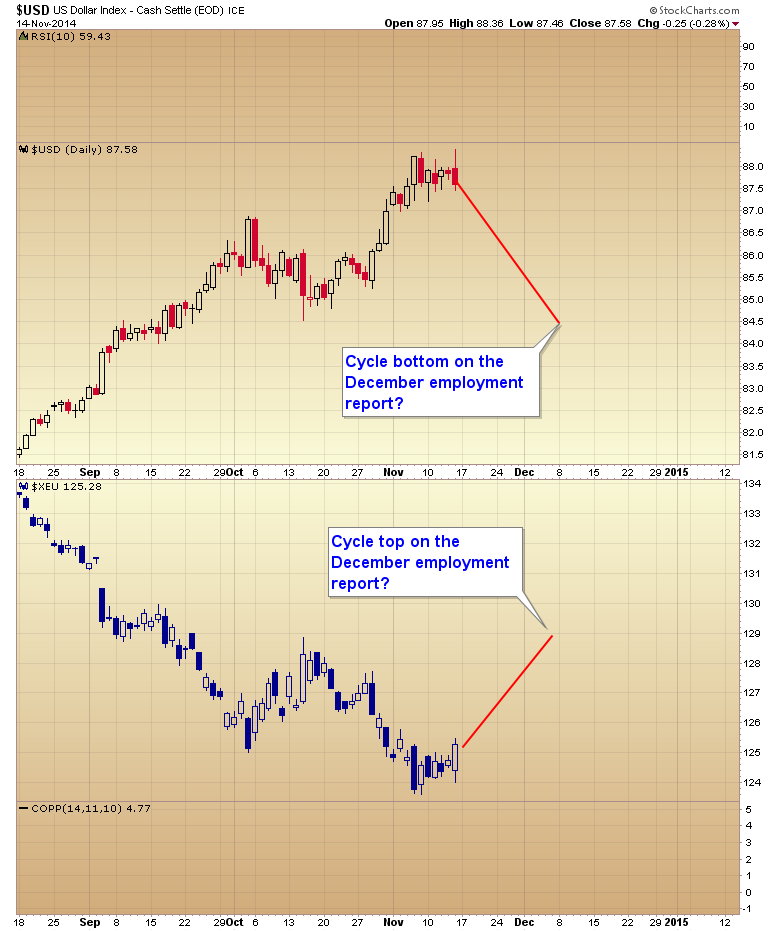
Now the question is are we looking at just a minor daily cycle rally to be followed soon by another lower low, or is the intermediate trend about to reverse? If the intermediate trend is about to reverse, then the euro is going form a right translated daily cycle (rally for more than 12 days) which would force the dollar into a stretched decline that may generate a failed daily cycle even though it is currently right translated (topped after day 12). While the odds are against a right translated cycle producing a lower low it does happen rarely, and I'm starting to think it might be setting up to happen in the dollar index. I think we could see the euro rally until the December employment report, which would correspond with the dollar forming a daily cycle low also on December 5 (stretching the current daily cycle to 36 days).
If this unfolds as I have described then both currencies would produce a minor corrective move and then continue the intermediate trend reversal. Notice in the chart below the pattern that would form if this scenario plays out.
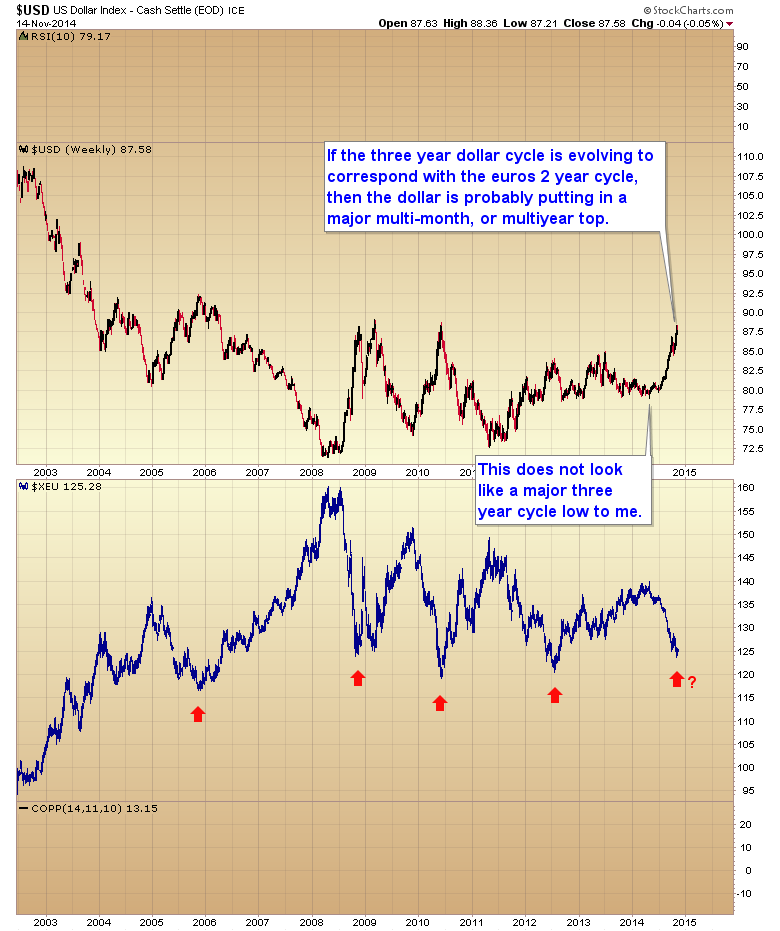
As I have been saying all along, the May bottom in the dollar just did not look like a major three year cycle low to me. On top of that over the last 9 years the euro has developed a very distinct two year cycle, which makes me wonder if the three year cycle in the dollar is evolving into something different. If that's the case, and the euro is about to put in a major 2 year cycle low, then the dollar is about to form a major multi-month, or possibly multiyear top.
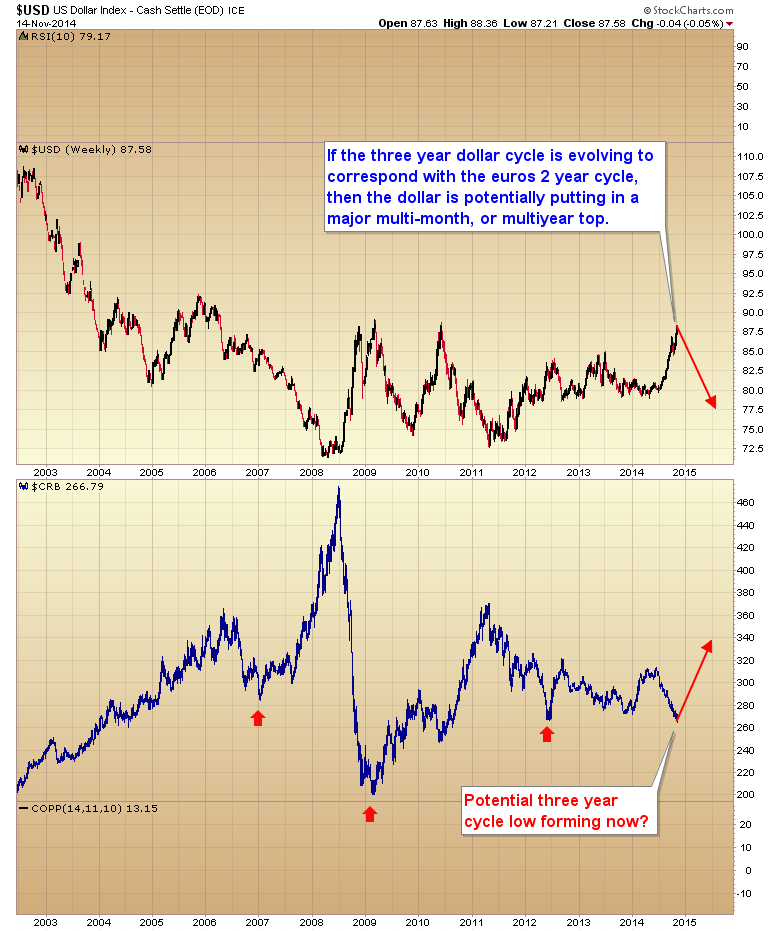
So how does this relate to commodities you ask? Well as long as the dollar continues to rally commodities are probably going to continue to struggle. But if the euro is putting in a major multi-month, or multi-year bottom, and the dollar a major top, then it's likely, as I discussed in my previous article, that the CRB is forming a slightly early 3 year cycle low right here and now.
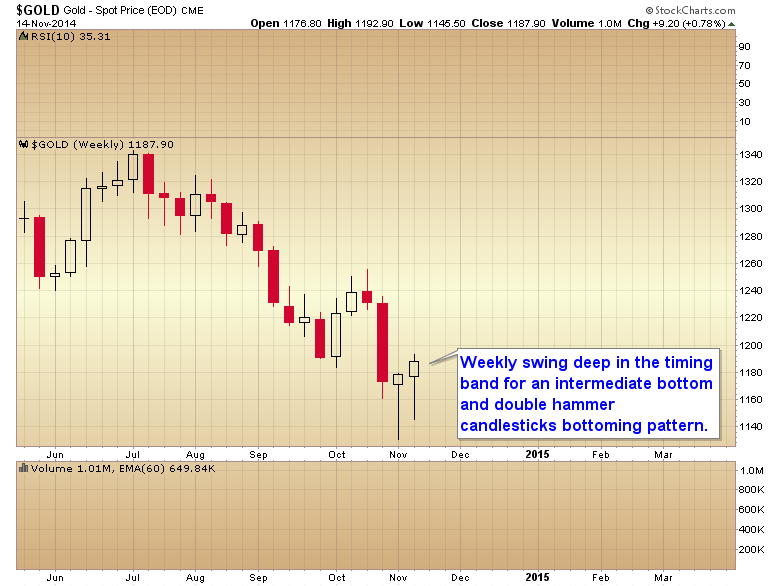
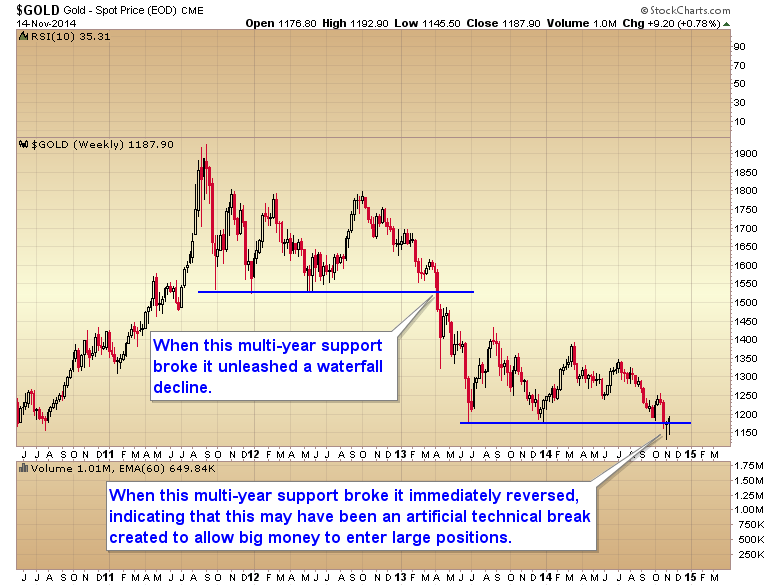
So how does this affect the gold market you ask? Well if the dollar is in the process of putting in a major multi-year top (which I think it's safe to say no one is expecting at this moment) then it is possible that gold just put in a final bear market bottom. Yes I have been expecting gold to make a final bottom next summer, and that is still a very strong possibility, but based on that two year cycle in the euro, there is a credible possibility that the bottom I was expecting next summer is occurring right now. With Friday's reversal and rally, gold is now flashing signals that an intermediate bottom may have occurred on November 7. Starting with the weekly charts we not only have a weekly swing (the first confirmation that an intermediate bottom has formed) but also a bottoming pattern with two hammer candlesticks in a row.
Another sign that something may have changed is the false breakdown below multi-year support. The last time this happened in 2013 gold collapsed in a waterfall decline. This time the break of support has been quickly reversed. As I have noted in the past this is often how major trends reverse as big money will create an artificial technical breakdown (to trigger stops and create a massive liquidity event) to produce the conditions necessary for them to enter very large positions. Unlike me and you these institutions can't just click a mouse and enter positions. They need a panic selling event to bring enough shares into the market so that they can take multi-million or even billion-dollar positions.
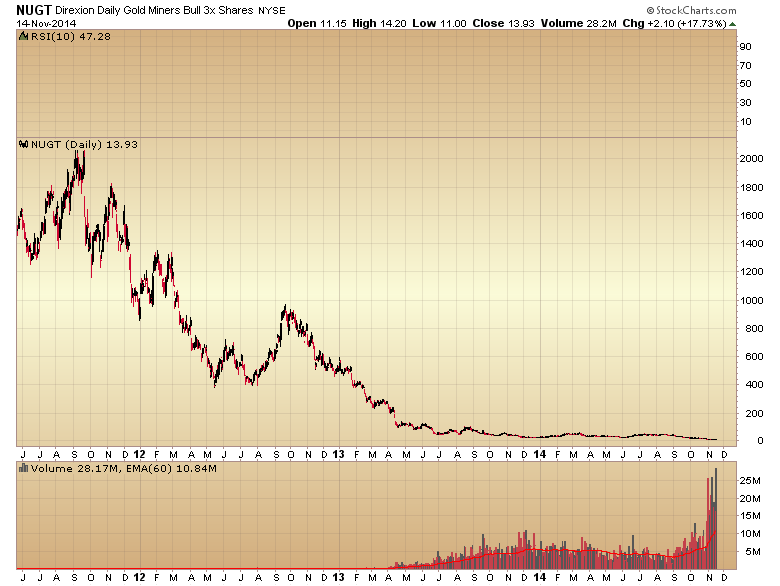
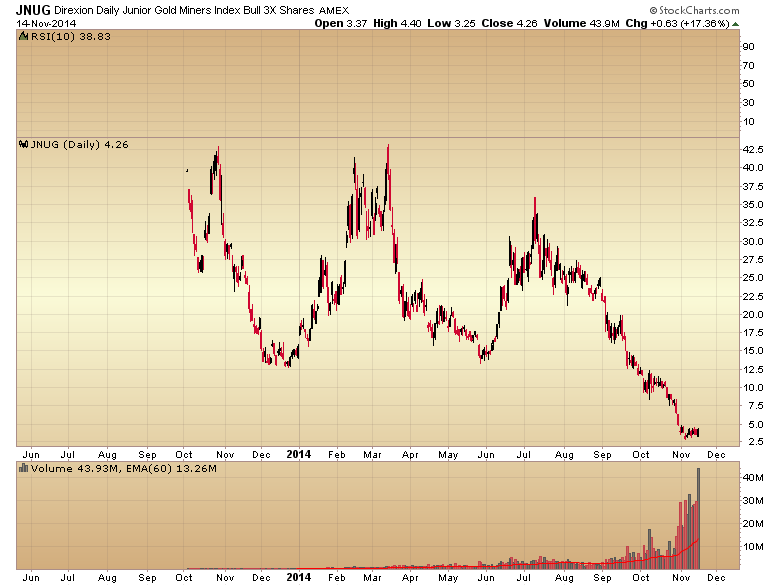
And speaking of entering large positions, note the volume on the triple leveraged mining indexes. Almost 20 billion dollars worth of shares have changed hands over the last two weeks in just GDX and GDXJ, and that doesn't even include the triple leveraged funds.
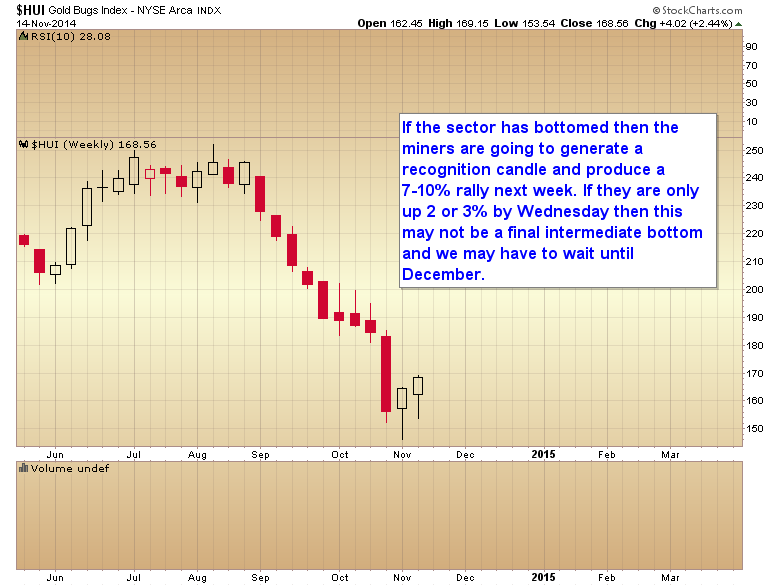
For no other reason than the dollar is due for a move down into its daily cycle low the metals should rally next week. Here's what I'm going to look for to tell me if the rally is the beginning of a new intermediate cycle and possibly a new cyclical bull market. First: If gold has put in an intermediate cycle low then the miners are going to produce a very large move this week, somewhere in the neighborhood of 7-10%. A recognition candle stick that signals that the smartest and most nimble players in the market are convinced a bottom has formed and have taken positions.
Second: In order for gold to generate a major trend change the currency markets also have to complete a larger degree trend reversal. The rally in the euro will be key. If it rallies enough next week to challenge or break its intermediate trend line that will provide confirmation that the currency markets are reversing.
So watch these two charts next week and they will tell us whether or not this is just a short-term bounce in gold with one more lower low to follow later in December, or if the metals have completed a major multi-month bottom, or maybe even a final bear market low. The post The Golden Bottom appeared first on Non Stop Gold. |
| The World is Ditching Its “3rd Wheel”, Finally! Posted: 17 Nov 2014 08:37 AM PST
|
| More opportunity likely for shorting Gold: Barclays Posted: 17 Nov 2014 08:37 AM PST Barclays believes that the macro environment is still bearish with US growth likely to hold up well and prospects of a stronger dollar are high. |
| Gold and silver short term resistance and support levels Posted: 17 Nov 2014 08:23 AM PST Commodity Trader |
| Gold & Silver Trading Alert: How High Will Gold Go? Posted: 17 Nov 2014 08:20 AM PST SunshineProfits |
| Dramatic gold import increase can't hurt Indian trade deficit Posted: 17 Nov 2014 08:02 AM PST India's trade deficit for the month of October declined 6% over the previous month to $13.35 billion, when matched with the September deficit of $14.25 billion. |
| Metals market update for November 17 Posted: 17 Nov 2014 07:55 AM PST Gold climbed $28.90 or 2.49% to $1,190.70/oz Friday. Silver surged $0.69 or 4.42% to $16.30/oz. |
| Indian banks rethink gold lending Posted: 17 Nov 2014 07:50 AM PST The banks in India have decided to revisit the lending norms on gold following extreme volatility in prices. |
| Monex Precious Metals Review: Gold hits high of $1193, silver support $15.05 Posted: 17 Nov 2014 07:10 AM PST Monex spot gold prices opened the week at $1,166 . . . traded as high as $1,193 on Friday and as low as $1,146 on Friday . . . |
| The World is Ditching Its “3rd Wheel”, Finally! Posted: 17 Nov 2014 07:00 AM PST The "switching of sides" in the currency war is going red hot, and it's no longer simply happening on the outer reaches of the Western alliance, but within core countries which the 3rd Wheel Dollar always thought it could count on: like Canada, like Germany, like the U.K. Country after country is beginning to understand that this […] The post The World is Ditching Its "3rd Wheel", Finally! appeared first on Silver Doctors. |
| Elliott Wave analyst sees big gold and silver price surge ahead Posted: 17 Nov 2014 06:33 AM PST To give some heart to precious metals bulls, WaveTrack International's Elliott Wave analysis still sees massive gains ahead. |
| The Most Important Question about Gold and Silver Price Suppression, Answered! Posted: 17 Nov 2014 05:30 AM PST The contemporary, fiat currency system, which central and international banks constructed, is a model that's built upon the bedrock of systemic fraud in multiple markets. The only way the system can continue is by constant expansion of currency and debt. The system has become so full of rot, that it can't survive without fraud and constant […] The post The Most Important Question about Gold and Silver Price Suppression, Answered! appeared first on Silver Doctors. |
| How Much Earmarked Gold Holds The Federal Reserve? Posted: 17 Nov 2014 05:18 AM PST Nick Laird at Sharelynx has recently complied historical data from multiple sources on the amount of earmarked (custodial) gold held by the US Federal Reserve Bank for other central banks. The chart below shows these stocks, in green, as well as the US' gold reserves (in blue) and in red is an estimate by the Fed (pre confiscation) of gold held in the US by citizens and others. It provides a broad historical view of monetary gold in the US.
First feature to note is the privately held/circulating gold stocks figure in red. Up to 1915 we see that the gold held by government was stable and it was privately held gold that was growing. After this, the amount of gold in circulation as a proportion of total monetary gold reduced with the introduction of the Federal Reserve System. It ceased completely at the point holding gold was made illegal. During the Bretton Woods period you will note that from 1950 to 1965 the total amount of gold held by the Fed was relatively stable at 25,000 tonnes. However, the US' gold reserves declined during this period from 22,000 tonnes to below 13,000 tonnes, with the ownership of the 9,000 or so tonnes simply being transferred to other central banks by book entry. In 1950 only 15% of the gold stored in the Fed was owned by foreign central banks – by the end of 1965, 48% of the gold was owned by foreigners. This reflected the change in the US towards deficits and the exchange of dollars for gold by nations running trade surpluses with the US. From 1965 onwards the US' gold reserves continue to fall while the holdings of other central banks at the Fed were quite stable at around 12,000 tonnes. It is not coincidental that foreign gold holdings at the Fed should peak at 12,282 tonnes in August 1971, the month the US unilaterally cancelled the direct convertibility of the US dollar to gold. Thereafter foreign central banks holdings at the Fed fell to 7,200 tonnes by 2000, an average rate of 15 tonnes a month. The period mid-1992 to mid-2001 saw a rapid decline in foreign gold holdings at the Fed, a reduction of just over 3,000 tonnes in 9 years. Another coincidence that the global mine hedge book added 2,000 tonnes over the same time period? Interesting as well that the gold price bottomed (or dollar topped) in April 2001 just ahead of the stabilisation of foreign gold holdings at the Fed in June 2001 and a peaking of the global mine hedge book in September 2001? Focusing in more detail, the chart below of foreign central bank gold holdings at the Fed over the past fifteen years shows little activity except for 2007 and 2008, when just under 410 tonnes was withdrawn – big sellers during that period included Switzerland (250 tonnes) and France (227 tonnes). It would seem that the remaining central banks holding around 6,000 tonnes are generally happy with the Fed's free custodial storage service.
Of particular interest is the spate of recent withdrawals, which Koos Jansen has speculated are repatriations by Germany. Since June 2013, 75 tonnes has been withdrawn and if all are related to Germany, then they are on track with their plans to transfer 150 tonnes from New York to Frankfurt by 2015 and another 150 tonnes by 2020.
This article appeared on the website of the goldstandardinstitute and was written by Bron Suchecki. Mr. Suchecki writes in a personal capacity and the views expressed do not represent those of the Perth Mint.
|
| ‘Yes' vote in Swiss referendum not certain to lift gold prices Posted: 17 Nov 2014 05:14 AM PST Deutsche Bank says the November 30 referendum won't necessarily lift bullion prices. |
| RBI talking to gov’t about more gold import curbs Posted: 17 Nov 2014 05:09 AM PST Officials from the RBI and the finance ministry met on Thursday to review India's gold import policy. |
| Cameron Says Second Global Crash Looming - Russian Relations Worsen at G20, Japan in Recession Posted: 17 Nov 2014 05:03 AM PST gold.ie |
| Introducing Open Bazaar – The Decentralization Revolution Takes on Ecommerce Posted: 17 Nov 2014 05:00 AM PST Described as the "next generation of uncensored trade" and a "safe untouchable marketplace," OpenBazaar is fundamentally different from all the online black markets that have come before it, because it is completely decentralized. If authorities acted against OpenBazaar users, they could arrest individuals, but the network would survive. Submitted by Michael Krieger, Liberty Blitzkrieg: – […] The post Introducing Open Bazaar – The Decentralization Revolution Takes on Ecommerce appeared first on Silver Doctors. |
| ECB could buy gold to revive economy Posted: 17 Nov 2014 02:00 AM PST Declining economic data may "theoretically" leave the door open for the European Central Bank to buy assets including gold and shares This posting includes an audio/video/photo media file: Download Now |
| Key to finding gold is understanding the rocks Posted: 17 Nov 2014 01:26 AM PST Thomas Schuster discusses a number of gold explorers whose rocks are starting to shine in this Gold Report interview. |
| Four key observations from the Deutsche Bank report on the Swiss Gold Initiative Posted: 17 Nov 2014 01:18 AM PST GATA |
| Swiss gold shenanigans intensify prior to vote Posted: 17 Nov 2014 01:07 AM PST 'Gold wars' are intensifying with just 16 days left to polling day in the Swiss Gold Initiative. |
| Chen Lin Says Gold Miners Need to Produce at $1,000/oz or Less to Survive Posted: 17 Nov 2014 12:00 AM PST How low can gold go? Chen Lin expects a probable near-term low of $1,000/ounce. The author of the What is Chen Buying? What is Chen Selling? newsletter says that at that price we can expect a... Visit the aureport.com for more information and for a free newsletter |
| Posted: 16 Nov 2014 07:07 PM PST Perhaps it should not be such a shock that Japan’s Q3 GDP continued to fall after the seven per cent crash in Q2. Abenomics is failing to revive the Japanese economy which is now onto QE9 money printing. The collapse of the Japanese yen may be approaching with another decline in the currency on this news. Asian stocks fell and bonds rallied despite the launch of the Chinese stock connect system today. Yoshito Sakakibara, Executive Director of Investment Research, JP Morgan, outlines the factors weighing on Japan’s ’shockingly weak’ GDP data and says it may be ideal to delay the sales tax increase. But is it really going to be that easy? |
| Jim Willie: Fed Launches STEALTH QE4 Through TOKYO- Currency Reset & New Gold Standard Imminent! Posted: 16 Nov 2014 06:28 PM PST Simply put, QE can never be halted or even slowed. The USFed is in a corner, with no policy options, FACING COLLAPSE, with no ability whatsoever to halt the systemic failure in progress. The USDollar is fast losing its integrity, during a dangerous global rejection episode. Therefore, QE must be exported, the easy candidate Japan. […] The post Jim Willie: Fed Launches STEALTH QE4 Through TOKYO- Currency Reset & New Gold Standard Imminent! appeared first on Silver Doctors. |


| You are subscribed to email updates from Gold World News Flash 2 To stop receiving these emails, you may unsubscribe now. | Email delivery powered by Google |
| Google Inc., 1600 Amphitheatre Parkway, Mountain View, CA 94043, United States | |
No comments:
Post a Comment