


Gold World News Flash |
- King World News has market analysis from von Greyerz, Pento
- Gold And Silver Manipulation “Conspiracy Theories” Are Becoming More Conspiracy Fact By The Day
- Guest Post: The Big Reset, Part 2
- Economic Collapse 2014 -- Current Economic Collapse News Brief
- The FT Goes There: "Demand Physical Gold" As One Day Paper Price Manipulation Will End "Catastrophically"
- Economic Collapse 2014 -- James Turk : We are Living Within A Money Bubble of Epic Proportion
- Gold Silver Chart Reading More Accurate Than Fundamentals/Technicals
- In the News
- Zero Hedge marvels at the FT's acknowledgment of gold market manipulation
- Market Monitor – January 25th
- Argentina In Advanced Stage of Yet Another Financial Panic/Meltdown
- Gold Investors Weekly Review – January 24th
- Gold’s Heroic Price Performance From A Technical Perspective
- Market Crash Coming Economic Collapse 2014
- Noonan: These Are the Facts About the Current Price Movement In Gold & Silver
- Willem Middelkoop summarizes Western central banking's war against gold
- Gold And Silver - Chart Reading More Accurately Depicts Fundamentals/Technicals
- Gold & Silver Chart Reading More Accurately Depicts Fundamentals/Technicals
- The State of the Trend
- This Past Week in Gold
- THE MOST DANGEROUS CHART IN THE WORLD
- Why Gold Stocks are Leading Gold
- Gold and Silver Trading Alert: Strong Rally’s Implications
- Gold Price Bottoming, Gold Stocks Set to Soar
| King World News has market analysis from von Greyerz, Pento Posted: 25 Jan 2014 07:05 PM PST 10p ET Saturday, January 25, 2014 Dear Friend of GATA and Gold: Gold figures in the market analysis offered today at King World News by Swiss gold fund manager Egon von Greyerz -- http://kingworldnews.com/kingworldnews/KWN_DailyWeb/Entries/2014/1/25_Wh... -- and Michael Pento of Pento Portfolio Strategies: http://kingworldnews.com/kingworldnews/KWN_DailyWeb/Entries/2014/1/25_20... CHRIS POWELL, Secretary/Treasurer ADVERTISEMENT Buy metals at GoldMoney and enjoy international storage GoldMoney was established in 2001 by James and Geoff Turk and is safeguarding more than $1.7 billion in metals and currencies. Buy gold, silver, platinum, and palladium from GoldMoney over the Internet and store them in vaults in Canada, Hong Kong, Singapore, Switzerland, and the United Kingdom, taking advantage of GoldMoney's low storage rates, among the most competitive in the industry. GoldMoney also offers delivery of 100-gram and 1-kilogram gold bars and 1-kilogram silver bars. To learn more, please visit: http://www.goldmoney.com/?gmrefcode=gata Join GATA here: Mines and Money Hong Kong http://www.minesandmoney.com/hongkong/ * * * Support GATA by purchasing DVDs of our London conference in August 2011 or our Dawson City conference in August 2006: http://www.goldrush21.com/order.html Or by purchasing a colorful GATA T-shirt: Or a colorful poster of GATA's full-page ad in The Wall Street Journal on January 31, 2009: http://gata.org/node/wallstreetjournal Help keep GATA going GATA is a civil rights and educational organization based in the United States and tax-exempt under the U.S. Internal Revenue Code. Its e-mail dispatches are free, and you can subscribe at: To contribute to GATA, please visit: ADVERTISEMENT How to profit with silver -- Future Money Trends is offering a special 16-page silver report with profiles of nine companies and technical analysis of their stock performance. Six of the companies have market capitalizations of less than $800 million and one company has a market cap of only $30 million. The most exciting of these companies will begin production in a few weeks and has a market cap of just $150 million. Half of all proceeds from the sale of this report will be donated to the Gold Anti-Trust Action Committee to support its efforts exposing manipulation and fraud in the gold and silver markets. To learn about this report, please visit: http://www.futuremoneytrends.com/index.php?option=com_content&id=376&tmp... |
| Gold And Silver Manipulation “Conspiracy Theories” Are Becoming More Conspiracy Fact By The Day Posted: 25 Jan 2014 06:11 PM PST "It's easier to fool people than to convince them that they have been fooled." - Mark Twain If Physical Gold Demand Soared As Gold Price Tumbled In 2013 | Zero Hedge, why did the "price" of Gold fall 28% over the course of the last year? The WSJ reports that demand for gold coins shot up 63% to 241.6 metric tons in the first three quarters of 2013. "Most people who buy physical gold aren't doing it for the same reason you'd purchase a stock," said Mike Getlin, vice president with Merit Financial, a bullion and coin dealership in Santa Monica, Calif. "They tend to have a much longer investment horizon. They tend to hold onto them forever and pride of ownership is a huge factor in that."What do these buyers of Gold in a market falling in price know that the "mainstream" doesn't? The Mainstream Loves to Hate GoldIn his famous essay on gold and economic freedom published in 1966, Alan Greenspan stated that gold stands as a "protector of property rights": "In the absence of the gold standard, there is no way to protect savings from confiscation through inflation. There is no safe store of value. If there were, the government would have to make its holding illegal, as was done in the case of gold. If everyone decided, for example, to convert all his bank deposits to silver or copper or any other good, and thereafter declined to accept checks as payment for goods, bank deposits would lose their purchasing power and government-created bank credit would be worthless as a claim on goods. The financial policy of the welfare state requires that there be no way for the owners of wealth to protect themselves. This is the shabby secret of the welfare statists' tirades against gold. Deficit spending is simply a scheme for the confiscation of wealth. Gold stands in the way of this insidious process. It stands as a protector of property rights. If one grasps this, one has no difficulty in understanding the statists' antagonism toward the gold standard." Many readers probably have come across this tidbit already, but for those who haven't, here is an interesting excerpt from an article published by the New York Times: "Two years ago gold bugs ran wild as the price of gold rose nearly six times. But since cresting two years ago it has steadily declined, almost by half, putting the gold bugs in flight. The most recent advisory from a leading Wall Street firm suggests that the price will continue to drift downward, and may ultimately settle 40% below current levels. The rout says a lot about consumer confidence in the worldwide recovery. The sharply reduced rates of inflation combined with resurgence of other, more economically productive investments, such as stocks, real estate, and bank savings have combined to eliminate gold's allure. Although the American economy has reduced its rapid rate of recovery, it is still on a firm expansionary course. The fear that dominated two years ago has largely vanished, replaced by a recovery that has turned the gold speculators' dreams into a nightmare."This reads exactly like what much of the mainstream press has written about gold over the past several weeks. A more perfect reflection of the current conventional wisdom is hardly imaginable as Peter Schiff has pointed out. There is only one problem – this article wasn't written today, or at anytime in the past few weeks. Rather, it appearedin the August 29, 1976 edition of The New York Times. Gold had just gone through a vicious correction, losing almost 50% of its value in a span of a little over 18 months. Unbeknown to the authors of the article, it had actually bottomed exactly four trading days before the article was published, and embarking on a rally that would eventually see it rise by nearly 800% from said low over the next three years. The reason for mentioning this is not to assert that exactly the same thing is going to happen again these days – we don't know the future after all. It is merely meant to demonstrate how utterly misguided the conventional wisdom often is, especially in connection with financial assets. Every word of this article reflects today's conventional wisdom as much as it reflected the general opinion in 1976. If the NYT wants to publish an article about gold today, it actually doesn't even need to write anything new: it could simply copy/paste this 1976 article. No-one would notice. READ MORE ___________________________ How low will gold go in 2014? Consensus forecast says down 14.5%January 15, 2014 Why will gold prices keep falling? A Bank of America Merrill Lynch strategist has said a lack of buyer interest is his biggest worry. A stronger global economy, a continued tapering in the Federal Reserve's bond buying and no sign of inflation could also pull interest away from gold, analysts say. __________________________ "There are a number of good reasons why so many love to hate gold. We rather suspect though that this tends to cloud their judgment. They certainly have no better handle on the future than we do, and their forecasts need to be taken with a big grain of salt. Once there is such a broad consensus about a trend, the trend is usually close to reversing." --Pater Tenebrarum in The Mainstream Loves to Hate Gold ― Elvis Presley Conspiracy Fact?Author : Bill HolterPublished: January 22nd, 2014 I just recently wrote that "2 things will happen:" 1. It will be understood that the central banks have far less gold than they had claimed 2. The true "fractional reserve" nature of the paper gold markets will become common knowledge I'd like to do a couple of things here, first use a little common sense to show that these will become "conspiracy fact" and then how might the "reaction" be. "We" conspiracy nuts have long said that physical supply did not and could not meet the current physical demand for nearly 20 years now. We argued that WGC and GFMS demand numbers were always too low and that supply numbers to meet even their too low numbers were fudged with "scrap" used to plug the gap. We argued all along and much more fervently after many central banks turned into buyers that the ONLY places that the supply could have come from were the central banks (particularly the Fed). Using only 3rd grade common sense here, why is it do you suppose that Germany was told 1 year ago that they'd have to wait 8 years to get 20% of their gold back? Was it because as we were "told" that any undertaking "this large" would take many years…or maybe because the gold actually isn't in the vault anymore? I would ask the question, how has China imported several thousand tons over the last couple of years yet we can't move 300 tons unless it's done of 8 years? Does China have "stronger boats" or "more powerful airplanes?" Or is the gold that we are shipping of the "heavier sort?" Yes I know, gold is gold but I never could get the answer correct whenever asked which is heavier, a pound of feathers or a pound of gold. ___________________________ Dear reader, the majority of "stuff" I read from analysts and economists these days says the 12-year run in gold bullion is over…the U.S. economy is getting better and gold has no reason to go back up. Hogwash, I say. After a 12-year bull market in gold prices, the correction came in 2013. The depth of the correction caught many gold investors by surprise. And many investors have given up on gold's future. It's at that point, when the speculators have left the market, that a correction in an upward-moving market completes itself and the bull resumes. I've seen it happen countless times…it's exactly what's happening with the 12-year-old bull market in gold bullion. A massive price shock is coming to the gold market…and it will be on the upside. ___________________________ Historic Short Squeeze To Send Gold To New All-Time HighsEric King, KingWorldNews.com - January 22, 2014Eric King: "Earlier in this interview you predicted a major short squeeze in the gold market. How do you see this short squeeze unfolding, John?" Hathaway: "There are people who sold gold synthetically. A lot of that settlement will be made in cash. There are a lot of people who are short and you can see that in the CFTC numbers -- managed money accounts, managed futures, HFTs (high frequency traders), etc.... "But all of these shorts will need to get on side. Again, they can settle in cash, but what you see on the Comex is just a fraction of the shorts that are out there. Some of this is because of the opacity of London. But once people begin to question the integrity of the intermediaries between the financial market and the bullion market, and those would be primarily Comex and even more importantly the London mechanism, those exchanges for dealing with gold will be bypassed. KWN has reported on the increase of gold that is no longer going through London. I think that is really going to hurt the leveraged trading of gold and create a demand for the real metal itself. This demand for the real thing will be through exchanges like the one in Shanghai, where you have 100% physical gold backing all of the paper. There are a lot of ramifications from this. We have seen the Germans, after asking for their gold over a year ago, have only received 5 tons from the US. What's that all about? This all comes down to the integrity or the lack thereof in the connection between financial instruments, financial intermediaries, and physical gold. It seems to me that the potential is great for people to say, in sort of a moment of epiphany, 'There is a difference. I don't want to have unallocated gold accounts with my bank. I want to have the real thing. I don't want to have gold in an ETF where I can't get my hands on it.' They will just want to have a form of liquidity, which is physical gold, that's not in the banking system. The banking system is becoming increasingly oppressive, onerous, and intrusive. So I think we are in the very early days of recognition that banks are instruments of government policy. ____________________________ Watch Out, "Bull Market Ahead" - Seven Key Gold ChartsSubmitted by GoldCore on 01/17/2014Often "a picture paints a thousand words" and the seven key gold charts below should make gold bears nervous. The charts were compiled by Nick Laird ofwww.ShareLynx.com and emailed to us Wednesday night. Sharelynx.com is a great website for charts and well worth the subscription. The seven gold charts suggest that there is a "bull market ahead", as Nick says. Again, we may see some further weakness in the short term but the outlook is good for 2014 and the coming years. So without further ado, lets look at these important gold charts. Gold Chart 1 - The banks are long gold ... 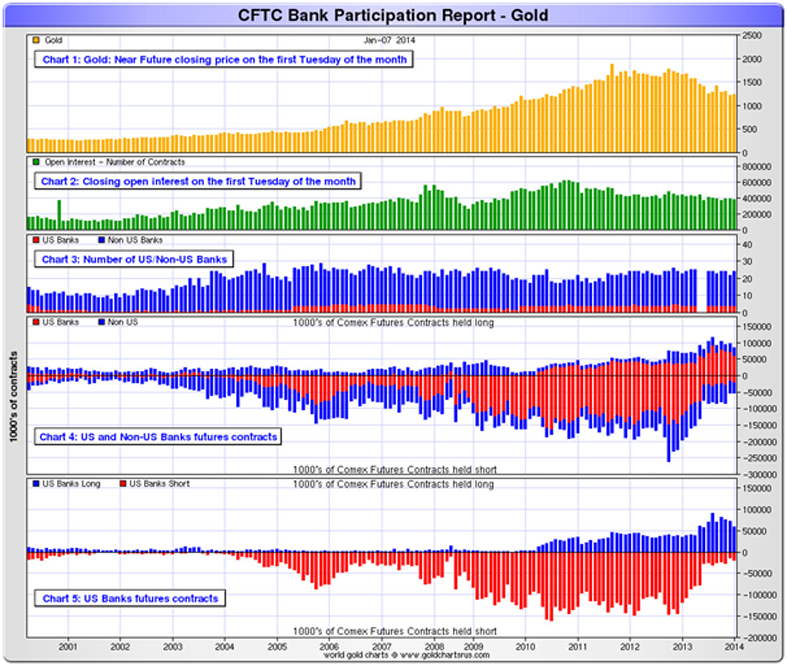 Gold Chart 2 - Gold stocks are being withdrawn ... 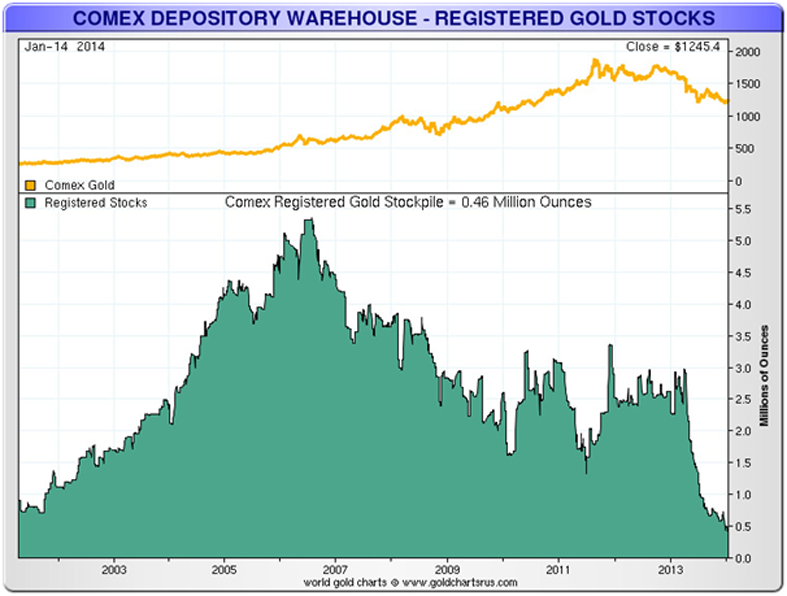 Gold Chart 3 - Supplies are being held back ... 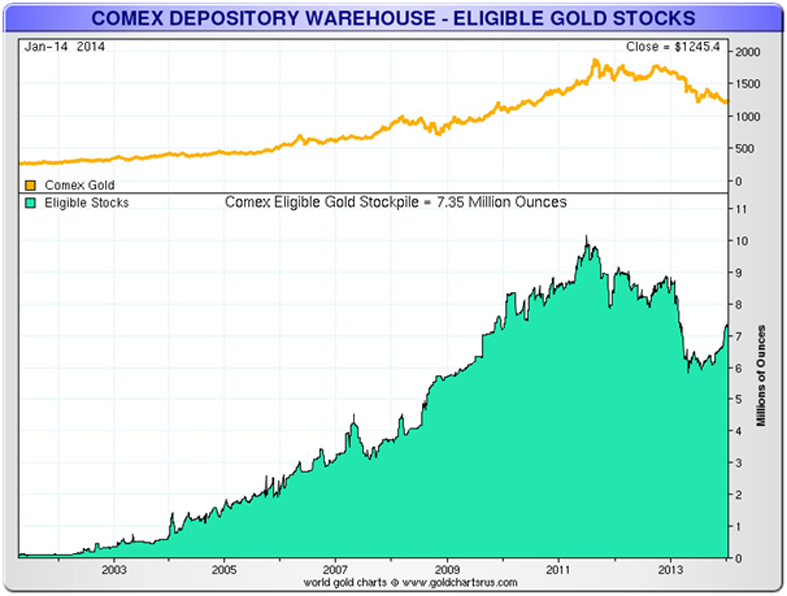 Gold Chart 4 - COT Data shows that banks and others are positioned perfectly for a bull run to start ... 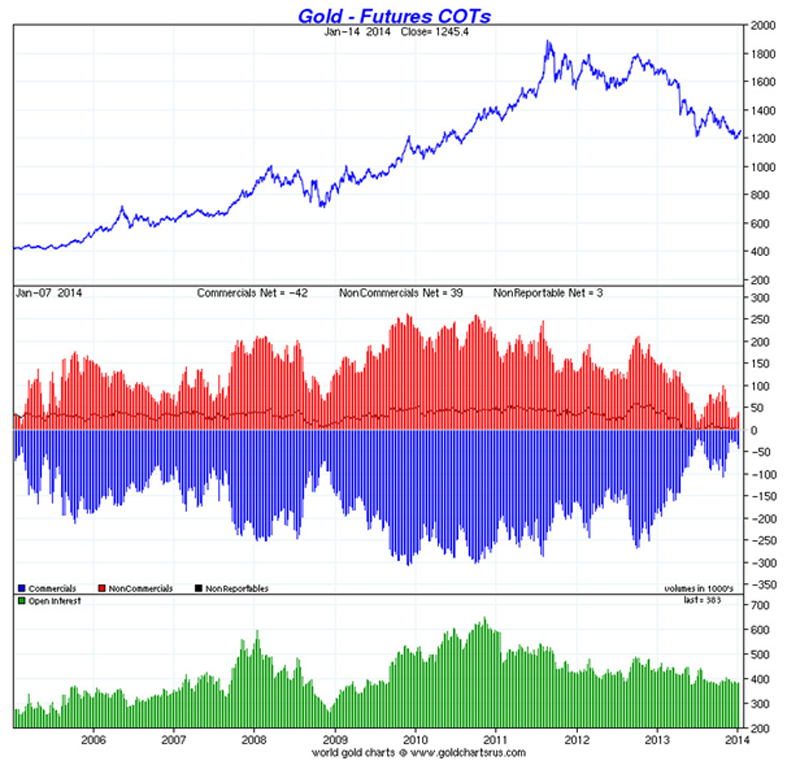 Gold Chart 5 - Pivot point time - double bottom ... 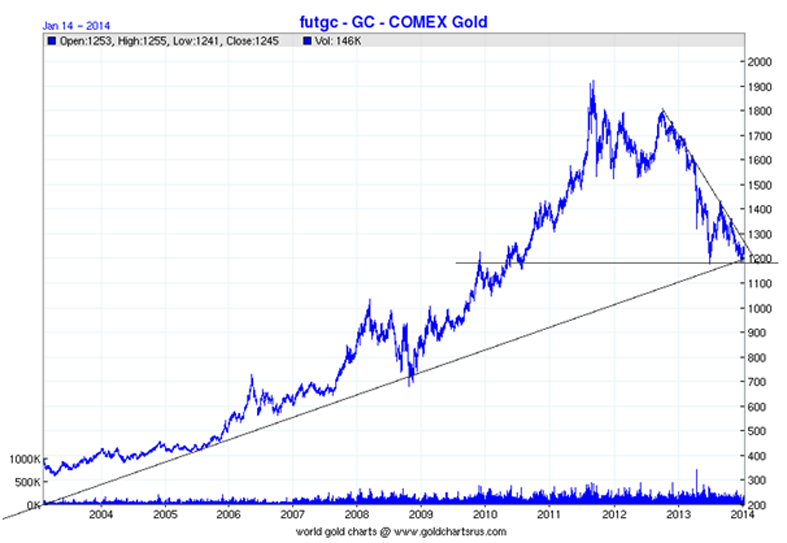 Gold Chart 6 - Never been a better buy … 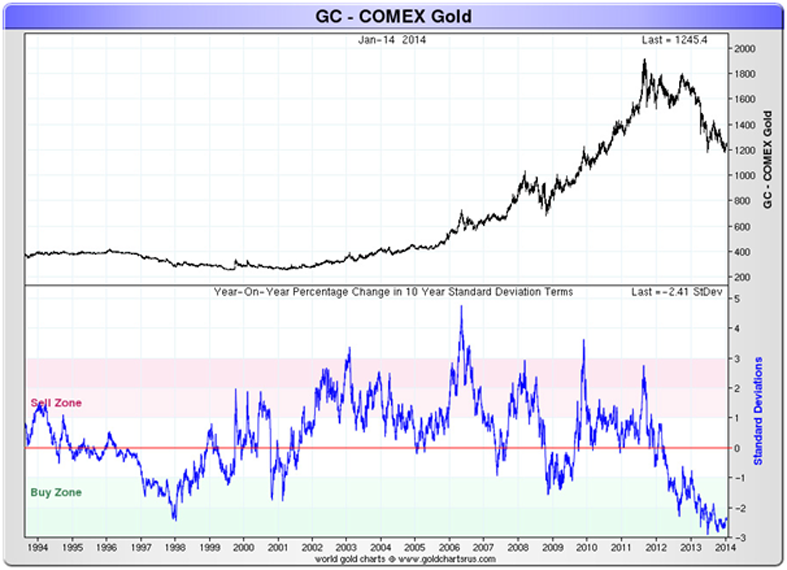 Gold Chart 7 - Just bounced off one of it's most oversold phases ... 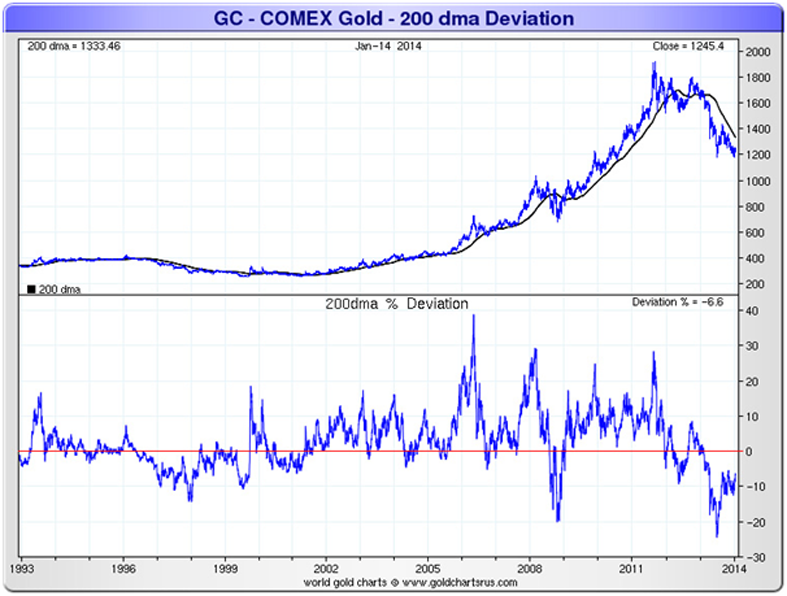 Sentiment is as bad as we have seen it in the precious metals market. As the charts show, such sentiment, price action and oversold conditions tend to coincide with major lows in gold and silver prices and multi month price gains. Very poor sentiment towards gold and oversold conditions is reminiscent of the conditions seen in late 2008 and January 2009 when gold prices had fallen by more than 25% in 9 months. 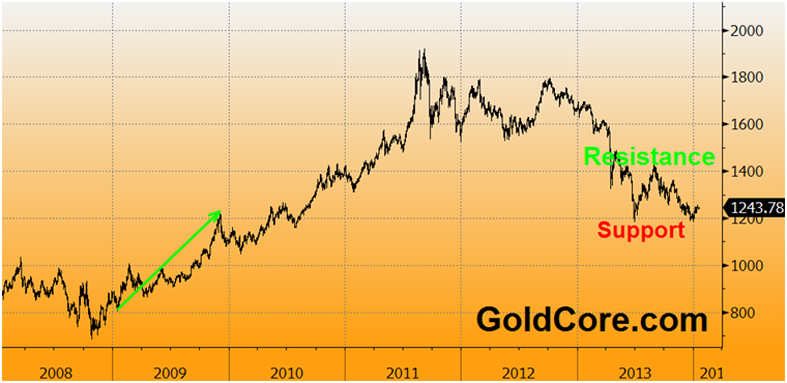 |
| Guest Post: The Big Reset, Part 2 Posted: 25 Jan 2014 05:30 PM PST Submitted by Koos Jansen of In Gold We Trust The Big Reset, Part 2 This is part two of a Q&A with Willem Middelkoop about his new book The Big Reset. In his book a chapter on the 'War on Gold' takes a prominent position. Willem has been writing about the manipulation of the gold price since 2002 based on information collected by GATA since the late 1990's. So part two of our interview will focus on this topic. The War On Gold Why Does The US Fight Gold? The US wants its dollar system to prevail for as long as possible. It therefore has every interest in preventing a 'rush out of dollars into gold'. By selling (paper) gold, bankers have been trying in the last few decades to keep the price of gold under control. This war on gold has been going on for almost one hundred years, but it gained traction in the 1960's with the forming of the London Gold Pool. Just like the London Gold Pool failed in 1969, the current manipulation scheme of gold (and silver prices) cannot be maintained for much longer. What is the Essence Of The War on Gold The survival of our current financial system depends on people preferring fiat money over gold. After the dollar was taken of the gold standard in 1971, bankers have tried to demonetize gold. One of the arguments they use to deter investors from buying gold and silver is that these metals do not deliver a direct return such as interest or dividends. But interest and dividend are payments to compensate for counterparty risk – the risk that your counterparty is unable to live up to its obligations. Gold doesn't carry that risk. The war on gold is, in essence, an endeavor to support the dollar. But this is certainly not the only reason. According to a number of studies, the level of the gold price and the general public's expectations of inflation are highly correlated. Central bankers work hard to influence inflation expectations. A 1988 study by Summers and Barsky confirmed that the price of gold and interest rates are highly correlated, as well with a lower gold price leading to lower interest rates.
When Did the War on Gold Start? The first evidence of US meddling in the gold market can be found as early as 1925 when the Fed falsified information regarding the Bank of England's possession of gold in order to influence interest rate levels. However, the war on gold only really took off in the 1960's when trust in the dollar started to fray. Geopolitical conflicts such as the building of the Berlin Wall, the Cuban Missile Crisis and the escalation of violence in Vietnam led to increasing military spending by the US, which in turn resulted in growing US budget deficits. A memorandum from 1961 entitled 'US Foreign Exchange Operations: Needs and Methods' described a detailed plan to manipulate the currency and gold markets via structural interventions in order to support the dollar and maintain the gold price at $ 35 per ounce. It was vital for the US to 'manage' the gold market; otherwise countries could exchange their surplus dollars for gold and then sell these ounces on the free gold market for a higher price. How Was The Gold Price Managed In The 1960's? During meetings of the central bank presidents at the BIS in 1961, it was agreed that a pool of $ 270 million in gold would be made available by the eight participating (western) countries. This so-called 'London Gold Pool' was focused on preventing the gold price from rising above $ 35 per ounce by selling official gold holdings from the central banks gold vaults. The idea was that if investors attempted to flee to the safe haven of gold, the London Gold Pool would dump gold onto the market in order to keep the gold price from rising. During the Cuban Missile Crisis in 1962, for instance, at least $ 60 million in gold was sold between 22 and 24 October. The IMF provided extra gold to be sold on the market when needed. In 2010, a number of previously secret US telex reports from 1968 were made public by Wikileaks. These messages describe what had to be done in order to keep the gold price under control. The aim was to convince investors that it was completely pointless to speculate on a rise in the price of gold. One of the reports mentions a propaganda campaign to convince the public that the central banks would remain 'the masters of gold'. Despite these efforts, in March 1968, the London Gold Pool was disbanded because France would no longer cooperate. The London gold market remained closed for two weeks. In other gold markets around the world, gold immediately rose 25% in value. This can happen again when the COMEX will default. More Evidence About This Manipulation? From the transcript of a March 1978 Fed-meeting, we know that the manipulation of the gold price was a point of discussion at that time. During the meeting Fed Chairman Miller pointed out that it was not even necessary to sell gold in order to bring the price down. According to him, it was enough to bring out a statement that the Fed was intending to sell gold. Because the US Treasury is not legally allowed to sell its gold reserves, the Fed decided in 1995 to examine whether it was possible to set up a special construction whereby so-called 'gold swaps' could bring in gold from the gold reserves of Western central banks. In this construction, the gold would be 'swapped' with the Fed, which would then be sold by Wall Street banks in order to keep prices down. Because of the 'swap agreement', the gold is officially only lent out, so Western central banks could keep it on their balance sheets as 'gold receivables'. The Fed started to informing foreign central bankers that they expected that the gold price to decline further, and large quantities of central banks' gold became be available to sell in the open market. Logistically this was an easy operation, since the New York Fed vaults had the largest collection of foreign gold holdings. Since the 1930's, many Western countries had chosen to store their gold safely in the US out of fears of a German or Soviet invasion. Didn't The British Help As Well By Unloading Gold At The Bottom Of The Market? Between 1999 and 2002, the UK embarked on an aggressive selling of its gold reserves, when gold prices were at their lowest in 20 years. Prior to starting, the Chancellor of the Exchequer, Gordon Brown, announced that the UK would be selling more than half of its gold reserves in a series of auctions in order to diversify the assets of the UK's reserves. The markets' reaction was one of shock, because sales of gold reserves by governments had until then always taken place without any advance warning to investors. Brown was following the Fed's strategy of inducing a fall in the gold price via an announcement of possible sales. Brown's move was therefore not intended to receive the best price for its gold but rather to bring down the price of gold as low as possible. The UK eventually sold almost 400 tons of gold over 17 auctions in just three years, just as the gold market was bottoming out. Gordon Brown's sale of the UK's gold reserves probably came about following a request from the US. The US supported Brown ever since.
How Do They Manipulate Gold Nowadays? The transition from open outcry (where traders stand in a trading pit and shout out orders) to electronic trading gave new opportunities to control financial markets. Wall Street veteran lawyer Jim Rickards presented a paper in 2006 in which he explained how 'derivatives could be used to manipulate underlying physical markets such as oil, copper and gold'. In his bestseller entitled Currency Wars, he explains how the prohibition of derivatives regulation in the Commodity Futures Modernization Act (2000) had 'opened the door to exponentially greater size and variety in these instruments that are now hidden off the balance sheets of the major banks, making them almost impossible to monitor'. These changes made it much easier to manipulate financial markets, especially because prices for metals such as gold and silver are set by trading future contracts on the global markets. Because up to 99% of these transactions are conducted on behalf of speculators who do not aim for physical delivery and are content with paper profits, markets can be manipulated by selling large amounts of contracts in gold, silver or other commodities (on paper). The $200 crash of the gold price April 12 and 15, 2013 is a perfect example of this strategy. The crash after silver reached $50 on May 1, 2011 is another textbook example. For How Long Can This Paper-Gold Game Continue? As you have been reporting yourself we can witness several indications pointing towards great stress in the physical gold market. I would be very surprised when the current paper gold game can be continued for another two years. This system might even fall apart in 2014. A default in gold and/or silver futures on the COMEX is a real possibility. It happened to the potato market in 1976 when a potato-futures default happened on the NYMEX. An Idaho potato magnate went short potatoes in huge numbers, leaving a large amount of contracts unsettled at the expiration date, resulting in a large number of defaulted delivery contracts. So it has happened before. In such a scenario futures contracts holders will be cash settled. So I expect the Comex will have to move to cash settlement rather than gold delivery at a certain point in the not too distant future. After such an event the price of gold will be set in Asian markets, like the Shanghai Gold Exchange. I expect gold to jump $1000 in a short period of time and silver prices could easily double overnight. That's one of the reasons our Commodity Discovery Fund invests in undervalued precious metal companies with large gold/silver reserves. They all have huge up-side potential in the next few years when this scenario will play out.
In Gold We Trust Synopsis of The Big Reset: Now five years after the near fatal collapse of world's financial system we have to conclude central bankers and politicians have merely been buying time by trying to solve a credit crisis by creating even more debt. As a result worldwide central bank's balance sheets expanded by $10 trillion. With this newly created money central banks have been buying up national bonds so long term interest rates and bond yields have collapsed. But 'parking' debt at national banks is no structural solution. The idea we can grow our way back out of this mountain of debt is a little naïve. In a recent working paper by the IMF titled 'Financial and Sovereign Debt Crises: Some Lessons Learned and Those Forgotten' the economist Reinhart and Rogoff point to this 'denial problem'. According to them future economic growth will 'not be sufficient to cope with the sheer magnitude of public and private debt overhangs. Rogoff and Reinhart conclude the size of the debt problems suggests that debt restructurings will be needed 'far beyond anything discussed in public to this point.' The endgame to the global financial crisis is likely to require restructuring of debt on a broad scale. About the author: Willem Middelkoop (1962) is founder of the Commodity Discovery Fund and a bestselling Dutch author, who has been writing about the world's financial system since the early 2000s. Between 2001 and 2008 he was a market commentator for RTL Television in the Netherlands and also appeared on CNBC. He predicted the credit crisis in his first bestseller in 2007. Link Willem Middelkoop |
| Economic Collapse 2014 -- Current Economic Collapse News Brief Posted: 25 Jan 2014 05:30 PM PST In this news brief we will discuss the latest news on the economic collapse. We look to see if things are really that different. The central bank will not stop at just confiscating your wealth they will want your life. They want to enslave the people. [[ This is a content summary only. Visit http://www.GoldSilverNewsBlog.com or http://www.newsbooze.com or http://www.figanews.com for full links, other content, and more! ]] |
| Posted: 25 Jan 2014 04:32 PM PST What have we done: after a series of reports in late 2012 in which we showed, with no ambiguity, that not only might the Bundesbank's offshore held gold be severely "diluted" (follow our 2012 exposes on German gold here, here, here, and here), but that on at least one occassion, the Fed and the Bank of England conspired against the Buba in returning subpar quality gold, the Bundesbank shocked everyone in early January 2013 when it announced it would repatriate 300 tons of gold helt in New York and all of its 374 tons of gold held in Paris. But convincing the Bundebsbank to demand delivery was peanuts compared to changing the tune of the Financial Times - that bastion of fiat "money", and where the word gold is mocked and ridiculed, and those who see the daily improprieties in the gold market as nothing but "conspiracy theorists" - to say the magic words: "Learn from Buba and demand delivery for true price of gold", adding that "one day the ties that bind this pixelated gold may break, with potentially catastrophic results." In other words, precisely what we have been saying since the beginning. Welcome to the 'conspiracy theorist' club, boys. From the FT's Neil Collins: "Learn from Buba and demand delivery for true price of gold: One day the ties that bind the actual and the traded commodity will snap:
|
| Economic Collapse 2014 -- James Turk : We are Living Within A Money Bubble of Epic Proportion Posted: 25 Jan 2014 04:30 PM PST James Turk believes the time we live in now will be studied by future historians for generations to come. Just as we today marvel at the collective madness that resulted in the South Sea and Dutch tulip manias, our age will be known as the era when society lost sight of what money really... [[ This is a content summary only. Visit http://www.GoldSilverNewsBlog.com or http://www.newsbooze.com or http://www.figanews.com for full links, other content, and more! ]] |
| Gold Silver Chart Reading More Accurate Than Fundamentals/Technicals Posted: 25 Jan 2014 12:32 PM PST Is there a difference between fundamental analysis vs technical analysis? A qualified yes. How so qualified? We do not speak for others, not even from the "technical" camp for there is a distinct difference between strict technical analysis and "reading" a chart based solely on price and volume. We are not fundamentalists, at all, with emphasis on at all. Nor are we technicians, as most technical analysts, [TA], are. TA rely upon a few or several technical tools as a means of interpreting the markets, such as moving averages, [even used by fundamentalists, to a degree], RSI, Bollinger Bands, MACD, trend lines, overbought/oversold indicators, etc, etc. What we use exclusively is a combination of price and volume and read within the context of the prevailing trend, for whatever time frame, monthly down to intra day. The range of a bar tells the ease, or lack of market movement. The location of the close says who won the battle between buyers and sellers. When volume is added into the mix, the market begins to take on life, of sorts, that fleshes out the actual ebb and flow of the tug-o-war between the opposing forces of supply and demand. Fundamentals are an attempt to discover and measure the factors of supply and demand. The biggest problem with any such analysis is one of timing. There is none. The other issue is the degree of awareness of which fundamentals are the biggest drivers; some may not be known or even recognized, leaving any such analysis incomplete. Admittedly, we know nothing about fundamentals, by choice. What we know of them is that they are fully incorporated into the charts by those who know what they know and ultimately make a decision to act upon that knowledge. That action gets translated into price and volume. It matters not if it is widely known information, insider information, market manipulation, what have you. It has to show up in executed price and be a part of total volume. Once information enters the market in price and volume, it is a "got ya" moment. As to the more commonly recognized technical analysis, every tool is a derivative of price and volume. We simply choose to focus on the purity of the information in its original format. Derived technical tools are all attempts to impose past tense market information onto the present tense in an effort to "predict" the future tense. It is absurd for anyone to "predict" any future market action, especially the ones that say when price is going to rally or decline, and those that show a chart depicting the future course the market will take. Please stop, or at least review your own results. The future has not yet happened. There are aspects about the market of which we are certain: Anything can happen, at any time. Every trade potential is a unique event. Markets may appear similar, but the players in the current market are very different than the ones from a similar past situation. How price will develop into the future is unknown and cannot be known in advance.
Where do we stand in the overall picture? We thought gold and silver would be higher, and we have advocated the purchase of the physical metals, for reasons explained, but we have not advocated trading gold and/or silver from the long side, [save a few short-term trades that were qualified as to why]. The only reason why the futures markets were shunned from the long side was for the simple reading of the charts: the trend has been down. The primary reason for owning the physical has been as a form of asset protection, and that has not worked well for the past few years as the value of silver and gold have been on the decline. Go beyond just the past few years, however, and the value of the precious metals have done very well. Have other asset classes performed better? Absolutely! It then becomes a matter of personal choice if one wants to own precious metals (PMs), stocks, real estate, Bitcoin, even fiat currency. Some assets will always outperform other assets. Gold and silver happen to be in a class of their own, with a proven history, not always as the best protection, at times, but proven consistently, over time. They have no third-party counter-risk, and they are perhaps the most recognized and widely accepted assets around the world, bar none. As to the current charts, we are starting to see some subtle changes in market behavior. The trend remains down, and we are not making a prediction that the trend will change next week, next month, or whenever. It does not matter. [Now we are referring to the paper futures market]. The sole purpose for trading futures is to increase one's capital of fiat-based assets. There is always risk of loss, as many know. For us, and for those who want to grow their capital, the best time to make a market commitment is with the trend. There is no reason to be long in a declining market, and the number of profitable longs in either gold or silver has been very small over the past few years, a handful of bottom-pickers. As an aside, re bottom-pickers, there is almost nothing worse than being right for the wrong reason. It leads to bad habits of trying to replicate the lucky event. Luck always runs out.
Will you catch the bottom? No. [Care to guess how may have tried and succeeded in the past few years?] If you can consistently catch profitable trades, with the trend as it develops for at least many months and more, does that not make plain common sense? Price is knocking on the down trend door in gold, but that does not mean it is knocking that door down. It takes time to turn a trend. We show gold testing a small 50% range. There are two higher half-way points that price has yet to approach, so despite a decent rally, last week, the trend has not turned. How gold corrects lower over the next week or two may well provide some important trend information. Given how no one knows how the market will correct, it is best to wait and see what the market reveals, first.
The daily shows in detail why gold was expected, [not predicted], to run into resistance at the 1260 – 1270 area. Always think of support or resistance as a price area and not just an absolute number. Thursday's wide range, high volume bar was likely a combination of short covering and maybe some new buying. What will be key to watch is how price retraces this last rally effort. If the market intends to go higher, the next correction will have smaller ranges and lighter volume, indicating less selling pressure. If price corrects on increased volume and wider ranges with weak closes lower, then the down trend will remain intact. Let the market declare itself.
A Tale of Two Metals. Silver acts differently than gold. It is clear that the trend remains lower with no sign of buyers taking control. A picture of 1,000 words to which we need not add. As an aside, how does one reconcile this chart with the fundamentals? Everyone claims the fundamentals for silver are ultra-bullish. Does the chart match?
Silver has work to do to turn the trend around. Looking at the daily chart, in some ways it would not take much effort to end the down trend. There are no guarantees that physical silver and gold will continue to be available at current prices, maybe not even at any price until it adjusts to a higher level. That is the risk everyone who want to buy coins and bars takes, while waiting or trying to get a better price or simply trying to outguess the market. Everyone knows the vaults for physical-by-the-tonne are like Old Mother Hubbard's cupboards, and the premium for higher amounts of gold, to the extent any is available, continues to grow. No one knows when the available supply for physical- by-the-ounce will also tighten. Anything can happen.
|
| Posted: 25 Jan 2014 12:25 PM PST As Gold Flows From West To East Singapore Emerges As Global Storage Hub Published in Market Update Precious Metals on 24 January 2014 By Mark O'Byrne Today's AM fix was USD 1,259.25, EUR 920.44 and GBP 757.40 per ounce. Yesterday's AM fix was USD 1,244.25, EUR 912.88 and GBP 749.91 per ounce. Gold fell $28.14... Read more » The post In the News appeared first on Jim Sinclair's Mineset. |
| Zero Hedge marvels at the FT's acknowledgment of gold market manipulation Posted: 25 Jan 2014 12:20 PM PST 3:20p ET Saturday, January 25, 2014 Dear Friend of GATA and Gold: Zero Hedge's Tyler Durden today joins GATA in marveling at the Financial Times' allowing the paper gold fraud and gold market manipulation to be acknowledged in its pages yesterday: http://www.gata.org/node/13562 Zero Hedge writes: "Convincing the Bundebsbank to demand delivery was peanuts compared to changing the tune of the Financial Times, that bastion of fiat 'money,' where the word 'gold' is mocked and ridiculed and those who see the daily improprieties in the gold market are nothing but 'conspiracy theorists.'" The Zero Hedge commentary is headlined "The FT Goes There: 'Demand Physical Gold' As One Day Paper Price Manipulation Will End 'Catastrophically'" and it's posted here: http://www.zerohedge.com/news/2014-01-25/ft-goes-there-demand-physical-g... CHRIS POWELL, Secretary/Treasurer ADVERTISEMENT How to profit with silver -- Future Money Trends is offering a special 16-page silver report with our forecast for 2013 that includes profiles of nine companies and technical analysis of their stock performance. Six of the companies have market capitalizations of less than $800 million and one company has a market cap of only $30 million. The most exciting of these companies will begin production in a few weeks and has a market cap of just $150 million. Half of all proceeds from the sale of this report will be donated to the Gold Anti-Trust Action Committee to support its efforts exposing manipulation and fraud in the gold and silver markets. To learn about this report, please visit: http://www.futuremoneytrends.com/index.php?option=com_content&id=376&tmp... Join GATA here: Mines and Money Hong Kong http://www.minesandmoney.com/hongkong/ * * * Support GATA by purchasing DVDs of our London conference in August 2011 or our Dawson City conference in August 2006: http://www.goldrush21.com/order.html Or by purchasing a colorful GATA T-shirt: Or a colorful poster of GATA's full-page ad in The Wall Street Journal on January 31, 2009: http://gata.org/node/wallstreetjournal Help keep GATA going GATA is a civil rights and educational organization based in the United States and tax-exempt under the U.S. Internal Revenue Code. Its e-mail dispatches are free, and you can subscribe at: To contribute to GATA, please visit: ADVERTISEMENT Buy metals at GoldMoney and enjoy international storage GoldMoney was established in 2001 by James and Geoff Turk and safeguards more than $1.7 billion in metals and currencies. Buy gold, silver, platinum, and palladium from GoldMoney over the Internet and store them in vaults in Canada, Hong Kong, Singapore, Switzerland, and the United Kingdom, taking advantage of GoldMoney's low storage rates, among the most competitive in the industry. GoldMoney also offers delivery of 100-gram and 1-kilogram gold bars and 1-kilogram silver bars. To learn more, please visit: http://www.goldmoney.com/?gmrefcode=gata |
| Posted: 25 Jan 2014 11:48 AM PST Top Market Stories For January 25th, 2014: Comex Potential Claims Per Deliverable Ounce 112 to 1 As Their Warehouses Show Thin Inventories - Jesse's Café 2014 Chinese Physical Gold Withdrawal Explodes 76.7% V 2013 – Goldsilver Gold Bottoming - GoldSeek China ties new gold 'spot' contract to the Yuan – Mineweb As Gold Flows From West To [...] |
| Argentina In Advanced Stage of Yet Another Financial Panic/Meltdown Posted: 25 Jan 2014 11:35 AM PST With international reserves in virtual free-fall, the black market peso rate plunging, and no sign for months that So says Scott Grannis (scottgrannis.blogspot.ca) in edited excerpts from his original article* entitled Another Argentine meltdown. [The following is presented by Lorimer Wilson, editor of www.FinancialArticleSummariesToday.com and www.munKNEE.com and may have been edited ([ ]), abridged (…) and/or reformatted (some sub-titles and bold/italics emphases) for the sake of clarity and brevity to ensure a fast and easy read. This paragraph must be included in any article re-posting to avoid copyright infringement.]Grannis goes on to say in further edited excerpts: The last time Argentina suffered a currency collapse was in early 2002, when the peso plunged almost overnight from 1 to 1 to the dollar to almost 4 to 1. Not content with 12 years of relative prosperity since then, the Argentine government seems dead set on creating another as illustrated by the rapid melt down in the value of the Argentine peso as shown in the chart below.  The problems began to get serious in 2011, when it first became apparent that the government was pegging the peso at a level that was too strong. The evidence for that can be found in the chart above, with the appearance of a black market (now the so-called “blue rate”) peso that was weaker than the official rate…and with the decline in Argentina’s international reserves that began in 2011. When Argentines perceive that the official rate is “too strong,” they want to convert their cash holdings into dollars, which are more likely to hold their value than is the peso over time. For real time Argentine inflation figures go HERE [To the chagrin of the fellow in the following joke entitled "The Argentine Perversion" the relative worthlessness of the Argentine peso is widely know. The story goes like this:
Argentines began to realize in 2011 that the official exchange rate was artificially high, and thus began the capital flight that has drained the government’s international reserves by almost 50% in the past three years. (The artificially strong peso peg forces the government to sell dollars in the face of an overwhelming demand on the part of the public to buy dollars.) The government has of course tried to stem the capital flight by imposing exchange controls and import controls, but that has only exacerbated the problem. When it comes to confidence, the owners of capital want to know that they are free to leave if problems develop. If they begin to perceive that investing in a country is like a “roach motel” (i.e., you can put your money in, but you can’t get it out), then capital will find no end of ways to circumvent a government’s attempt to keep capital within its borders. For the past few years, Argentines have been flocking to the U.S. to spend as much as possible with their credit cards, because in this manner they can effectively buy dollars at the official rate plus a 20% “surcharge” imposed by the government to discourage this practice but that’s better than buying dollars on the black market, where they would have to pay 50-70% more. We had some Argentine friends with us several months ago, and they wanted to stop at every ATM they saw, where they would then withdraw as many dollars as the machine would let them. After buying copious amounts of clothes and electronic goodies, they then sold the dollars they took back with them to Argentina on the black market, and easily paid for the cost of their trip. This is how dollars are fleeing Argentina these days. In 1916, one U.S. dollar was worth two Argentine pesos. Since then, there have been a four major re-denominations of the peso (in which multiple zeros were erased from its value). If the original peso were still in circulation, one U.S. dollar would be worth about 70 trillion pesos at the current official rate, and 120 trillion at the current black market rate. Interestingly, the Argentine stock market (in peso terms) has almost tripled in the past two years, even as economic growth has slowed dramatically and inflation has risen to 30-35% per year. But in dollar terms, Argentine stocks have registered virtually no gain at all since 1992, when the peso was pegged at 1 to 1 to the dollar and stayed that way for a decade. I take this to be evidence that stocks can be a decent hedge against inflation over time, but not much more. It’s time to cry once more for Argentina. UPDATE: The decline of the peso accelerated today as the central bank apparently made no effort to prop up the peso with dollar sales. The dollar briefly hit 8.2 pesos, and is now trading just under 8. This marks a surge in the dollar’s value against the peso of almost 60% since the beginning of last year, and that in turn points to a 60% rise in Argentina’s general price level over the next year or so. That further implies a doubling of Argentina’s inflation rate. UPDATE 2: The government-imposed “surcharge” on credit card purchases outside the country is now 35%. Band-aid solutions such as this only make things worse, as they effectively move the country closer and closer to a mega-devaluation, which in turn brings higher inflation and more money-printing, in what ends up being a vicious cycle that ends only when the government abandons all attempts to impose “order” on the economy and allows the free market to work its magic. We’re not there yet. Conclusion At this point the central bank has little choice but to announce either a significant devaluation of the official rate or a float of the currency but the underlying problem—too much government spending financed by printing money—will remain. Only a radical change in government policies can restore order to the Argentine economy, and that is unlikely as long as President Kirchner remains in control. It’s time for the grownups to take charge. [Editor's Note: The author's views and conclusions in the above article are unaltered and no personal comments have been included to maintain the integrity of the original post. Furthermore, the views, conclusions and any recommendations offered in this article are not to be construed as an endorsement of such by the editor.]*http://scottgrannis.blogspot.ca/2014/01/another-argentine-meltdown.html?utm_source=feedburner&utm_medium=email&utm_campaign=Feed:+blogspot/tMBeq+(Calafia+Beach+Pundit) Related Articles: Like health, freedom erodes gradually over time… then all at once. We lose a freedom here, there, through a slow, measured deterioration of civil and economic liberty: body scanners at the airport; declarations of foreign accounts; mandatory health insurance and then, suddenly, there’s a bifurcation point when the deterioration goes nonlinear. It’s like the old saying about going broke– it happens gradually, then all at once. We lose our freedoms in the same way. [That is already happening in Argentina where the government is] screwing everyone, big time: banks, businesses, workers, retirees, professionals, entrepreneurs, even government employees and the U.S. is starting to go down this road as well. [Let me explain.] Words: 625 Read More » One can barely keep up with what is going on here in Argentina, since each day brings more ‘new’ government dictates, rules and initiatives which all seem to share the same features – dumb and dumber – and virtually all with guaranteed unintended negative consequences. Let me give you my on-the-ground insights of the lay of the land – of what is REALLY happening in Argentina – and about to happen! Words: 853 Read More » 3. These 21 Countries Have Experienced Hyperinflation In Last 25 Years Hyperinflation is not an unusual phenomenon. 32 countries have experienced hyperinflation over the last 100 years of which no less than 21 have experienced it in the past 25 years and 3 in the past 10 years. The United States is one of the few countries to have experienced two currency collapses during its history (1812-1814 and 1861-1865). Could it happen again? Words: 1450 Read More 4. The Currency War: Which Country Will End Up With the Fastest Currency in the Race to the Bottom? We believe that we are in the "competitive devaluation" stage presently [see graph below] as country after country is printing money in order to lower rates and doing whatever possible to devalue their currency – to have the fastest currency in the…race to the bottom – in order to export their goods and services. [The next stage will be protectionism and tariffs. This article gives an update on the race to debase.] Read More » 5. Real-time Inflation Data is Now Available – Finally Inflation is a significant measurement for the economic health of countries around the world but rates are often reported weeks after data is collected. To address this problem, two professors at MIT Sloan School of Management have launched the Billion Prices Project which is the first website to publish daily price indexes and provide real-time inflation estimates around the world. Words: 825 The post Argentina In Advanced Stage of Yet Another Financial Panic/Meltdown appeared first on munKNEE dot.com. |
| Gold Investors Weekly Review – January 24th Posted: 25 Jan 2014 11:25 AM PST In his weekly market review, Frank Holmes of the USFunds.com nicely summarizes for gold investors this week's strengths, weaknesses, opportunities and threats in the gold market. The price of the yellow metal went lower after two consecutive weeks of gains. Gold closed the week at $1,269.40, up $15.3 per ounce (1.22%). The NYSE Arca Gold Miners Index went 1.57% higher on the week. This was the gold investors review of past week. Gold Market StrengthsGold sales by Japan's biggest bullion retailers surged 63%. It reached a five-year high. Sales of gold bars to local investors soared to 37.3 metric tonnes from 22.9 metric tonnes a year earlier. This surge in sales is attributable to the policy of Prime Minister Abe which resulted in the weakening of the yen. Consequently, investors have been looking for a hedge against inflation. Softer platinum prices and an increasing interest in platinum jewelry from Chinese consumers created a surge in China's platinum imports, up 23.5 percent year-over-year. December imports soared 86.5% year-over-year to 369,500 ounces, the second-highest number on record. Gold Market WeaknessesThomson Reuters GFMS says that the professional gold market is obsessed with “tapering.” Despite the fact that tapering is largely fully discounted, there has been quite a dichotomy in the gold market over the past year. GFMS notes that professional investors continue to lose interest in gold, while "grass roots" buyers maintain their appetite for the yellow metal. Analysts predict lower gold prices this year. Morgan Stanley cut its gold target price by 12% to $1,160 for 2014, while the 2015 price was also cut by 13% to $1,138. Morgan Stanley believes that gold will extend declines this year as gains in the equity market reduce the need for haven assets and an increase in regulations hurt risk appetite. According to a LBMA survey (London Bullion Market Association), gold will average $1,219 an ounce in 2014. They further predict a high and low trading range of $1,379 to $1,067, respectively. Gold Market OpportunitiesMining analyst Eric Lemieux (Laurentian Bank Securities, Quebec), keeps his top pick for the year as Virginia Mines. This company has an exceptionally well-managed team and a focused business model. The CEO of the company said that he wants to be at the beginning of the food chain with significant discoveries, and the end of the food chain with a royalty portfolio. Gold Market ThreatsThe Ministry of Finance in Indonesia imposed a new duty on exporting minerals which includes copper concentrates. Companies like Freeport-McMoRan Copper and Newmont Mining are facing an even larger tax burden going forward. Both companies believe that the new Indonesian export tax is in breach of their Contracts of Work with the government of Indonesia. Freeport officially stated that it will keep negotiating with the government. |
| Gold’s Heroic Price Performance From A Technical Perspective Posted: 25 Jan 2014 10:43 AM PST Gold posted a nice close to finish out the week although the mining shares were once again refusing to go along with the strong move over at the Comex. That always give me a reason for concern as one likes to see both the shares and the metal moving higher in sync to reinforce the bullish cause. I wanted to start off with a weekly chart to provide a bit of a longer term perspective before moving in for a closer look at the daily and even shorter time frame charts. On the weekly chart, using the Directional Movement Indicator (one of my favorites as it is an old, but reliable friend), you can see that the Negative Directional Movement Indicator ( RED LINE ) remains above the Positive Directional Movement Indicator ( BLUE LINE ) as it has been since late in 2012. In other words, the BEARS REMAIN IN CONTROL of the gold market despite gold’s heroic performance this past week.  The ADX, the trend indicating line, is moving lower showing that the defined downtrend has been interrupted after it showed a slight rise forming on the failure to extend past $1,350 in late October 2013. So how do we interpret this? On this intermediate time frame, no trend currently exists with the bears dominating. We would need to see the directional indicator lines cross and reverse dominance to realize a shift of control in favor of the bulls. That has clearly not occurred on this time frame. Also notice that the 30 week moving average has been a good defining parameter for the metal at this time frame. It has served as support when the market was moving higher as can be seen from looking over to the left hand side of the chart. Retracements in price were held at this level as buying emerged. During the sideways phase that lasted for all of 2012, the weekly moving average was not of much use ( moving averages NEVER ARE during sideways or consolidation phases ) but once price started trending lower in early 2013, it did serve to cap all rallies on the upside as can be seen occurring between July 2013 and the end of the year. Currently price can be seen approaching this level from down below. Also note that the moving average has stopped heading lower and is turning up. That is a friendly sign to the bull’s cause but as noted above, the DMI is not yet indicating a bullish victory on this time frame. Let’s pull in to a bit closer term look by using the daily chart.  This presents quite a different picture. Notice that the Positive Directional Indicator ( BLUE LINE ) is decidedly ABOVE the Negative Directional Indicator (RED LINE ). Translation – Bulls have seized control of the market on the shorter time frame. If you look a little closer you can see that the ADX line has stopped moving lower and is actually turning higher as the price moves higher. That is a good sign for the bulls as it indicates that they have the potential to turn this into an upside trending move if they can continue to follow through on the upside buying. The ADX remains below 25 however so I would not yet call the market as being in an uptrend. Some technicians like to see the ADX above 30 before stating a trend has formed but I am a bit more aggressive and will look at the 25 level. By the way, this is more of an art form than an exact science so do not write this down in stone. Notice that this same 30 period moving average has been a decent level to watch as it provides overhead resistance ( see the left side of the chart ) for price rallies. Price has popped above it and is sitting right at a band of overhead chart resistance. It pushed past the top of the band on Friday but fell back. From a fundamental perspective, if these emerging market credit concerns greet the market Sunday evening and Monday morning, one would expect gold to punch through and move higher. ( Remember the side note I stated repeatedly not too long ago and that gold needed something to dispel CONFIDENCE to kick it higher). That is what happened this week with the currency/credit issues in emerging markets. Here is how I am looking at this right now – traders with a shorter time frame perspective should go with the flow on the daily but keep in their mind that the intermediate term chart shows a market with a BEARISH pattern. That means rallies are going to be viewed as SELLING opportunities until the weekly chart becomes positive. At that time, the mentality should change and dips should be bought. Let the longer term charts guide your “big picture” view when you trade. If you are nimble and can move into and out of the market quickly, you can trader on much shorter time frame intervals. Just understand what you are doing and don’t get caught up in all the usual hype that will start back up once again now that the metal has moved higher and improved the short term charts. STAY OBJECTIVE and ignore the voices. Let the charts guide your decisions. |
| Market Crash Coming Economic Collapse 2014 Posted: 25 Jan 2014 09:30 AM PST Market Crash Coming Economic Collapse 2014 A large number of those who escaped the worst of the 2008-10 meltdown will get wiped out this time around. This round is the one that will make a substantial difference. The best thing that a person can do economically is to own productive land... [[ This is a content summary only. Visit http://www.GoldSilverNewsBlog.com or http://www.newsbooze.com or http://www.figanews.com for full links, other content, and more! ]] |
| Noonan: These Are the Facts About the Current Price Movement In Gold & Silver Posted: 25 Jan 2014 09:16 AM PST We are starting to see some subtle changes in market behavior but the trend currently remains down for both So says Michael Noonan (edgetraderplus.com) in edited excerpts from his original article* entitled Gold And Silver – Chart Reading More Accurately Depicts Fundamentals/Technicals. [The following is presented by Lorimer Wilson, editor of www.FinancialArticleSummariesToday.com and www.munKNEE.com and may have been edited ([ ]), abridged (…) and/or reformatted (some sub-titles and bold/italics emphases) for the sake of clarity and brevity to ensure a fast and easy read. This paragraph must be included in any article re-posting to avoid copyright infringement.]Noonan goes on to say in further edited excerpts: It is absurd to "predict" any future market action. The future has not yet happened. The only aspects about the market of which we are certain is that anything can happen, at any time. Every trade potential is a unique event. Markets may appear similar, but the players in the current market are very different than the ones from a similar past situation. How price will develop into the future is unknown and cannot be known in advance. The market is based on probabilities, outcomes that are likely to occur, and however likely they are to occur, no one can know how they will unfold. You have a history from the past two years of endless predictions on where the prices of gold and silver would be. Our Approach to Understanding the Markets There are 2 different approaches to supposedly understanding the market, fundamental analysis & technical analysis and variations thereof, What are we? 1. We are not fundamentalists, at all, with emphasis on at all. Fundamentals are an attempt to discover and measure the factors of supply and demand. The biggest problem with any such analysis is one of timing. There is none. The other issue is the degree of awareness of which fundamentals are the biggest drivers; some may not be known or even recognized, leaving any such analysis incomplete. Admittedly, we know nothing about fundamentals, by choice. What we know of them is that they are fully incorporated into the charts by those who know what they know and ultimately make a decision to act upon that knowledge. That action gets translated into price and volume. It matters not if it is widely known information, insider information, market manipulation, what have you. It has to show up in executed price and be a part of total volume. Once information enters the market in price and volume, it is a "got ya" moment. 2. Nor are we technicians, as most technical analysts, (TA), are. TA rely upon a few or several technical tools as a means of interpreting the markets, such as RSI, Bollinger Bands, MACD, moving averages, (even used by fundamentalists, to a degree), trend lines, overbought/oversold indicators, etc, etc. With commonly recognized technical analysis, every tool is a derivative of price and volume. Derived technical tools are all attempts to impose past tense market information onto the present tense in an effort to "predict" the future tense. For technical analysis on the future for gold, silver, the XAU and HUI check out:
3. In our analyses of gold and silver we simply choose to focus on the purity of the information in its original format. We use, exclusively, a combination of price and volume and read within the context of the prevailing trend, for whatever time frame, be it monthly, weekly, daily or intra-day. The range of a bar tells the ease, or lack of market movement. The location of the close says who won the battle between buyers and sellers. When volume is added into the mix, the market begins to take on life, of sorts, that fleshes out the actual ebb and flow of the tug-o-war between the opposing forces of supply and demand. The Current Situation We are starting to see some subtle changes in market behavior. The trend remains down, and we are not making a prediction that the trend will change next week, next month, or whenever. It does not matter. (Now we are referring to the paper futures market.) The sole purpose for trading futures is to increase one's capital of fiat-based assets. There is always risk of loss, as many know. For us, and for those who want to grow their capital, the best time to make a market commitment is with the trend. There is no reason to be long in a declining market, and the number of profitable longs in either gold or silver has been very small over the past few years…When the trend turns up, there will be ample opportunity to be positioned from the long side with a lower risk and a higher probability of a profitable outcome, but never guaranteed. There is no need to guess. There is no need to predict. Let the market take its course, and then follow its confirmed direction… Price is knocking on the down trend door in gold, but that does not mean it is knocking that door down. It takes time to turn a trend. We show gold testing a small 50% range. There are two higher half-way points that price has yet to approach, so despite a decent rally, last week, the trend has not turned. How gold corrects lower over the next week or two may well provide some important trend information. Given how no one knows how the market will correct, it is best to wait and see what the market reveals, first. Let the market declare itself and the following charts show you where we are at: Gold – Weekly Chart
Gold – Daily Chart The daily shows in detail why gold was expected, (not predicted), to run into resistance at the 1260 – 1270 area. Always think of support or resistance as a price area and not just an absolute number. Thursday's wide range, high volume bar was likely a combination of short covering and maybe some new buying. What will be key to watch is how price retraces this last rally effort. If the market intends to go higher, the next correction will have smaller ranges and lighter volume, indicating less selling pressure. If price corrects on increased volume and wider ranges with weak closes lower, then the down trend will remain intact.
Silver – Weekly Chart Silver acts differently than gold. It is clear that the trend remains lower with no sign of buyers taking control. A picture of 1,000 words to which we need not add. (As an aside, how does one reconcile the chart with the fundamentals? Everyone claims the fundamentals for silver are ultra-bullish.)
Silver – Daily Chart Silver has work to do to turn the trend around. Looking at the daily chart, in some ways it would not take much effort to end the down trend.
Conclusion There are no guarantees that physical silver and gold will continue to be available at current prices, maybe not even at any price until it adjusts to a higher level. That is the risk everyone who want to buy coins and bars takes, while waiting or trying to get a better price or simply trying to outguess the market. Will you catch the bottom? No, (care to guess how may have tried and succeeded in the past few years?0 but if you can consistently catch profitable trades, with the trend as it develops for at least many months and more, does that not make plain common sense? [Editor's Note: The author's views and conclusions in the above article are unaltered and no personal comments have been included to maintain the integrity of the original post. Furthermore, the views, conclusions and any recommendations offered in this article are not to be construed as an endorsement of such by the editor.]*http://edgetraderplus.com/market-commentaries/gold-and-silver-chart-reading-more-accurately-depicts-fundamentalstechnicals Related Articles: 1. Noonan on Silver: Wait for Price to Confirm Its Intent – Then Start Stacking!  Do not mess with Mother Nature! The natural law of supply and demand will always rise up from under the distorted efforts to contain it. The good news is that each passing week brings silver closer to its inevitable resolve: a powerful rally that will surpass all others. Read More » 2. Noonan: The Trend in Gold Remains Down – But For How Long?  If your perception is focused solely on where the price of gold is, as opposed to where you think or believe it ought to be, the elites would like to sell you a renewable subscription to their "Fiat Is Better" newsletter. Read More » 3. Is Gold Still In A Downtrend? Yes – and No – Depending On How You Look At It  Is Gold still in a downtrend or has it actually broken its downtrend? Both as it turns out, but only if viewed from the proper perspective. Let me explain. Read More » 4. These 10 Charts Suggest the Outlook for Gold Is Good for 2014 and Beyond  Very poor sentiment towards gold and oversold conditions is reminiscent of the conditions seen in late 2008 and January 2009 [as seen in the chart below] when gold prices had fallen by more than 25% in 9 months. Subsequently, gold rose from a low on January 15, 2009 at $802.60/oz to a high less than 12 months later at $1,215/oz for a gain of over 50%. A similar move today would see gold above $1,800/oz by year end. Read More » 5. Gold & Silver to Plunge – Again – Then Move Up Dramatically Later in 2014  Back in early May, 2013, I correctly forecast the lows in gold & silver which occurred 2 months later. Today, my new analyses of gold & silver indicates they both will show further weakness during the first quarter of 2014 before both jumping dramatically in price before the end of 2014. Below are the specific details of my forecasts (with charts) to help you reap substantial financial rewards should you wish to avail yourself of my insightful analyses. Read More » 6. Nick Barisheff: "Today's the 2nd-Greatest Opportunity to Buy Gold Since 2002!"  Last year…saw gold's greatest decline in 32 years…but I'm still confident that gold's bullish fundamentals are still intact and that what I said in my recently published book, $10,000 Gold, still holds true. Here's why. Read More » 7. Gold In 2014: Price Forecasts ($900 – $1,435) & Commentary  Below are a series of forecasts and predictions of what 2014 could bring for the price of gold (as low as $900/ozt. & no higher than $1,435/ozt.) and the reasons why with interesting commentary by some individual investors and gold enthusiasts. Read More » 8. Gold To Begin a Parabolic Rise In 2014 – Here's Why  We are now starting the hyperinflationary phase in the USA and many other countries – and this will all start in 2014. What will be the trigger? The answer is simple – the fall of the U.S. dollar. Read More » 9. 12 Reasons Why Gold Should Bounce Sharply Higher in 2014  Willem Middelkoop summarizes Western central banking's war against gold Posted: 25 Jan 2014 08:12 AM PST 11:13a ET Saturday, January 25, 2014 Dear Friend of GATA and Gold: Willem Middelkoop, author of the new book "The Big Reset," gives an excellent summary of Western central banking's gold price suppression scheme in the second part of his interview with gold researcher and GATA consultant Koos Jansen. It's posted at Jansen's Internet site, In Gold We Trust, here: http://www.ingoldwetrust.ch/the-big-reset-part-2 CHRIS POWELL, Secretary/Treasurer ADVERTISEMENT Jim Sinclair plans seminars in Asheville and Austin Gold advocate and mining entrepreneur Jim Sinclair will hold his next market seminars from 2 to 6 p.m. Saturday, January 25, at the Clarion Inn Asheville, 550 Airport Road, Fletcher, North Carolina, and from 2 to 6 p.m. Saturday, February 8, at the Austin, Texas, Airport Hilton. Advance registration is required. Details for the Asheville seminar are posted at Sinclair's Internet site, JSMineSet.com, here: http://www.jsmineset.com/2014/01/07/north-carolina-qa-session-venue-conf... Details for the Austin seminar are posted at JSMineSet.com here: http://www.jsmineset.com/2014/01/02/austin-texas-qa-session-confirmed/ Join GATA here: Mines and Money Hong Kong http://www.minesandmoney.com/hongkong/ * * * Support GATA by purchasing DVDs of our London conference in August 2011 or our Dawson City conference in August 2006: http://www.goldrush21.com/order.html Or by purchasing a colorful GATA T-shirt: Or a colorful poster of GATA's full-page ad in The Wall Street Journal on January 31, 2009: http://gata.org/node/wallstreetjournal Help keep GATA going GATA is a civil rights and educational organization based in the United States and tax-exempt under the U.S. Internal Revenue Code. Its e-mail dispatches are free, and you can subscribe at: To contribute to GATA, please visit: ADVERTISEMENT A Personal Touch in Buying Precious Metals If you've not secured your allocation of precious metals and numismatic coins, 2014 may be the last year to get them at affordable and undervalued prices. With huge amounts of gold leaving the West for Asia, the future availability of precious metals is very much in doubt. All Pro Gold has competitive pricing on all bullion and numismatic products -- and offers prompt delivery too. Long-time GATA supporters Fred Goldstein and Tim Murphy are glad to answer any questions or concerns about acquiring the monetary metals. All Pro Gold has an extensive electronic library of articles from the world's top market analysts. Learn more at www.allprogold.com or write to Fred and Tim at info@allprogold.com or telephone them at 1-855-377-4653. |
| Gold And Silver - Chart Reading More Accurately Depicts Fundamentals/Technicals Posted: 25 Jan 2014 06:00 AM PST Is there a difference between fundamental analysis v technical analysis? A qualified yes. How so qualified? We do not speak for others, not even from the "technical" camp for there is a distinct difference between strict technical analysis ... Read More... |
| Gold & Silver Chart Reading More Accurately Depicts Fundamentals/Technicals Posted: 25 Jan 2014 05:51 AM PST Is there a difference between fundamental analysis v technical analysis? A qualified yes. How so qualified? We do not speak for others, not even from the "technical" camp for there is a distinct difference between strict technical analysis and "reading" a chart based solely on price and volume. We are not fundamentalists, at all, with emphasis on at all. Nor are we technicians, as most technical analysts, [TA], are. TA rely upon a few or several technical tools as a means of interpreting the markets, such as moving averages, [even used by fundamentalists, to a degree], RSI, Bollinger Bands, MACD, trend lines, overbought/oversold indicators, etc, etc. |
| Posted: 25 Jan 2014 05:44 AM PST GLD is showing signs of reversal but will remain in a vulnerable position until it manages to climb and stay above the 50% retracement level ... Read More... |
| Posted: 25 Jan 2014 05:42 AM PST Summary: Long term - on major sell signal since Mar 2012. Short term - on buy signals. Gold sector cycle - up as of 12/27. COT data continues to be favorable for a bear market rally. Read More... |
| THE MOST DANGEROUS CHART IN THE WORLD Posted: 25 Jan 2014 05:20 AM PST Last month I warned about the bubble in the stock market, and what was going to happen when it popped. Make no mistake the chart of the S&P is the most dangerous chart in the world. When this parabolic structure collapses, it is going to bring down the global economy.  My initial target for this rally was a test of the reaction high on the NASDAQ in 2000. As you can see we came within just a whisker of hitting that target.  After what happened on Friday I think we can safely assume that the current daily cycle has now entered its declining phase. As I have noted before, the average duration trough to trough for the daily cycle in the stock market is 35-40 days. Friday was day 24. We should expect a bottom probably on the next employment report on February 7. Now here's the thing, I expect the Fed, and the plunge protection team to go into full panic mode this weekend, come out Monday morning with guns blazing, and try to stop the sell off. Unfortunately this behavior is what has allowed this parabolic structure to develop. Every time the market has tried to correct over the last year the Fed has prematurely aborted the sell off. I'm pretty sure they are going to try again next week. If they succeed then we will probably have a final panic melt up phase with the NASDAQ testing the all-time highs above 5000 over the next 2-3 months.  If on the other hand the selling pressure overwhelms the plunge protection team and starts to spiral out of control next week then we are witnessing the breaking of the parabola and the end of this bull market.  Here's what we need to watch next week. If the Fed can turn this market around and prevent the S&P from breaking through this intermediate trend line over the next two weeks, then this will turn into just a normal daily cycle correction and will be followed by a fifth daily cycle that should include the melt up phase of this bull market.  If on the other hand the selling pressure overwhelms the plunge protection team's efforts to hold it back and breaks through that intermediate trend line early in the week then we are witnessing the collapse of the parabolic structure and I wouldn't expect it to stop until we reach the 2000 and 2007 previous bull market high support zone.  Back on January 3 I instructed my subscribers to buy long-term puts on the market to take advantage of the collapse as I knew it was eventually coming. We should know by early next week whether or not those puts are going to pay off huge in the next two weeks or whether we will take a modest profit and reenter them at NASDAQ 5000. Whether the parabolic structure collapses next week or in two months we all know what the Feds response is going to be. They are going to reverse their taper decision and double or triple down on QE. The problem is that when a parabolic structure collapses it can't be put back together. My theory all along has been that when the stock market bubble pops the Fed would then completely destroy the dollar trying to pump it back up and that liquidity would then flow into the commodity markets instead of the broken parabola of the stock market and create another inflationary event similar to 2008.  Those people that say we have to have wage and employment growth in order to generate inflation are ignoring recent history. We had a severe inflationary event in 2008 while the economy was already in recession and unemployment was surging.  You don't need wage growth to have inflation. You just need a central bank to destroy your currency. The Fed has already destroyed our currency. At the moment the inflation is being stored in the stock market, bond market, and echo bubble in the real estate market. When those bubbles pop the inflation is going to flow back into the commodity markets.       |
| Why Gold Stocks are Leading Gold Posted: 24 Jan 2014 02:00 PM PST The Daily Gold |
| Gold and Silver Trading Alert: Strong Rally’s Implications Posted: 24 Jan 2014 08:49 AM PST In short: Opening a speculative short position (half of the regular position) in gold, silver and mining stocks might be a good idea right now. Yesterday, gold rallied significantly, mining stocks rallied less significantly (didn’t close higher than on Tuesday) and silver moved higher very insignificantly. Let’s see how much changed (charts courtesy of http://stockcharts.com). |
| Gold Price Bottoming, Gold Stocks Set to Soar Posted: 24 Jan 2014 08:17 AM PST Gold is bottoming, showing incredible resilience over the past 7 months. After suffering an epic plunge in last year’s second quarter, gold has held its ground ever since. This is despite still facing the same howling headwinds that forced that extraordinary selloff. Gold has found strong support and carved a massive double bottom. Thus 2013’s gold super-storm has passed, and a mighty new upleg is dawning. Obviously last year was exceedingly miserable for gold. This metal plunged 27.9%, its worst calendar-year performance in 32 years! When something hasn’t been witnessed for a third of a century, there is no doubt it is rare and extreme. But the whole year masks the real story, the second quarter. The gold price plummeted an astounding 22.8% in 2013’s Q2. That was its worst calendar quarter in 93 years! |


| You are subscribed to email updates from Save Your ASSets First To stop receiving these emails, you may unsubscribe now. | Email delivery powered by Google |
| Google Inc., 20 West Kinzie, Chicago IL USA 60610 | |
No comments:
Post a Comment