


saveyourassetsfirst3 |

- Greg: Markets, Gold, Silver, and More
- IT MAY BE TIME TO BOOK SOME PROFITS IN THE MINING STOCKS
- Cramer's Mad Money - 8 Things To Watch In The Week Ahead (9/28/12)
- Karate Principles In Trading And Portfolio Management
- Profiling Recent Berkshire Buys: Viacom - A Video Content Giant
- Gold or Silver the better deal?
- Modern Money and Public Purpose: The Historical Evolution of Money and Debt
- Links for 2012-09-29 [del.icio.us]
- Why This Depression Will Be Known As The Greatest Depression
- Gold Is The Cure For The Job-Drain
- The Gold Standard Strikes Back…
- Real bills and employment
- The Data Don’t Support That The U.S. Bank Bailouts Were Better Than the Swedish Model
- GATA - Judge throws out CFTC's position limits rule
| Greg: Markets, Gold, Silver, and More Posted: 30 Sep 2012 06:46 AM PDT Important Updates: Markets, Gold, Silver, Crude, U.S. Dollar. By Gregory Mannarino from gregvegas5909: ~TVR |
| IT MAY BE TIME TO BOOK SOME PROFITS IN THE MINING STOCKS Posted: 30 Sep 2012 06:16 AM PDT It's been a great run over the last two months but it may be time to tighten stops on mining stocks. You can see in the chart below that at least during this stage of the new C-wave gold is still inversely tethered to the dollar index, as are miners.  During the period from September 2011 to July 2012 the dollar was moving generally higher out of its three year cycle low and that forced a 10 month correction in the precious metals sector. It's been my opinion that the three year cycle in the dollar topped at that point, and should drift generally lower until the next three year cycle low sometime in mid-2014 (with occasional counter trend rallies from time to time). I've been expecting one more leg down in the dollar to test the February intermediate low before the first counter trend rally.  However, this bounce is now on the 10th day and in jeopardy of generating a right translated daily cycle (a cycle that rallies longer than half its duration and tends to form higher highs and higher lows). If a right translated daily cycle occurs it will probably signal that an intermediate degree counter trend rally has already begun. As you can see in the chart above just as soon as the dollar started to rally gold stagnated, mining stocks started to correct, as did the stock market. If this bounce in the dollar turns into a full-fledged intermediate degree rally then we can probably expect a 3-4 week correction in asset markets. I find it hard to believe that Bernanke is going to allow the dollar to rise and asset markets correct right in front of an election but the possibility definitely exists if the dollar doesn't turn down early next week. Those of you not willing to hold through a 10-15% correction in miners should probably consider tightening stops, possibly right below Thursday's intraday low. If that stop level gets violated it would start a pattern of lower lows and lower highs which is generally the definition of a down trend. If, on the other hand, Monday morning finds the dollar getting hit hard then I think we may see gold test $1900 before the next intermediate degree correction. In my opinion what happens Monday & Tuesday to the dollar index will probably set the stage for market direction over the next month and into the election. SMT premium newsletter. $10 one week trial.       This posting includes an audio/video/photo media file: Download Now |
| Cramer's Mad Money - 8 Things To Watch In The Week Ahead (9/28/12) Posted: 30 Sep 2012 04:12 AM PDT By SA Editor Miriam Metzinger: Stocks discussed on the in-depth session of Jim Cramer's Mad Money TV Program, Friday September 28. 8 Things to Watch in the Coming Week: Mosaic (MOS), Phillips Van Heusen (PVH), Family Dollar (FDO), Marriott (MAR). Other stocks mentioned: Monsanto (MON), Dollar General (DG), Wyndham Worldwide (WYN), Select Comfort (SCSS), Nike (NKE), Juniper (JNPR), Cisco (CSCO). Monday: The Institute for Supply Management's September Report: The report should indicate if a slowdown is happening. If the numbers are not good, stocks may be taken down. The German Purchasing Managers Index: While the German stock market has been up 23%, a lackluster number from this report could be a boon in disguise. It might show that Germany's hardline position against bailouts is hurting the country, and might indicate a softening of its economic strategy regarding poorer nations. Tuesday Mosaic (MOS) reports but Cramer prefers Monsanto (MON) as a way to play agriculture since Complete Story » |
| Karate Principles In Trading And Portfolio Management Posted: 30 Sep 2012 02:01 AM PDT By Emil Mark: I was introduced to Karate as a martial art during my teenage years. Recently I happened to re-read the major 20 Karate philosophy precepts summarized by Master Funakoshi Gichin before he established the Japan Karate Association around 1950s. As the behavioral finance gains popularity nowadays as a way to explain the edge that some traders and investors have over the market, it appeared to me that many of those Karate foundation points were clearly applicable to trading and portfolio management. Whether you trade the PowerShares Nasdaq 100 ETF (QQQ), the SPDR S&P500 fund (SPY), the gold through the SPDR Gold Trust (GLD), or engage in currency trading or hedging by some ETF like the CurrencyShares Euro Currency Trust (FXE), the principles presented below will be beneficial to you. Most of them, in one form or another, can be found as leading tenets of many famous traders and investors - from Complete Story » |
| Profiling Recent Berkshire Buys: Viacom - A Video Content Giant Posted: 30 Sep 2012 01:46 AM PDT By This is the sixth article in a series profiling publicly listed companies recently bought by Berkshire Hathaway (BRK.A). I've previously profiled BNY Mellon (BK), DaVita (DVA) and DirecTV (DTV). This time I'll have a look at a content company called Viacom (VIAB). Berkshire Hathaway added to their stake of Viacom in their most recent quarter and the stake is now worth about $370 million. In dollar terms the addition is quite small relative to Berkshire's total stock portfolio, but the stake has quadrupled during the last quarter, indicating some real interest in the stock. The buying is most likely done by one of Buffett's lieutenants, Ted Weschler or Todd Combs. According to their latest annual report, Viacom is a global content company that connects with its audiences through television, motion picture, online and mobile platforms. The company reports their earnings in two categories: Media Networks and Complete Story » |
| Gold or Silver the better deal? Posted: 30 Sep 2012 01:30 AM PDT |
| Modern Money and Public Purpose: The Historical Evolution of Money and Debt Posted: 30 Sep 2012 12:16 AM PDT L. Randall Wray and Michael Hudson present at the Modern Money and Public Purpose seminars. L. Randall Wray is a Professor of Economics at the University of Missouri-Kansas City. Michael Hudson Distinguished Research Professor of Economics at the University of Missouri (Kansas City), and President of the Institute for the Study of Long-term Economic Trends (ISLET). This video is an hour and three-quarters long — Wray begins, then Hudson takes over at 43:00 — so I suggest you listen to it over your Sunday morning coffee instead of NPR. (And if you've been taking note of all the "tally stick" jokes in the threads lately, I'm guessing this video is where that comes from…) Here's an interesting passage that I hope I've transcribed with reasonable accuracy from Michael Hudson's talk. Of Sumer:
Time passes, there is a dark age, and until 750BC we to Greece and Rome.
History does rhyme, doesn't it? * * * So, this is a great series, I wish them well, and maybe I'll be lucky enough to make my way down to Manhattan to listen to one or two of them, not least because the very concept of "Public Purpose" seems to alien to most contemporary discourse on political economy.
|
| Links for 2012-09-29 [del.icio.us] Posted: 30 Sep 2012 12:00 AM PDT
|
| Why This Depression Will Be Known As The Greatest Depression Posted: 29 Sep 2012 10:59 PM PDT Share/SaveProbably the last thing regular readers of this website need is additional evidence supporting the coming governmental and economic collapse. I apologize for yet another article on this topic, but newer readers need to understand what is coming and do what they can to protect themselves. Government default is inevitable and with it another Depression. ... Read More |
| Gold Is The Cure For The Job-Drain Posted: 29 Sep 2012 10:00 PM PDT |
| The Gold Standard Strikes Back… Posted: 29 Sep 2012 10:00 PM PDT |
| Posted: 29 Sep 2012 10:00 PM PDT Gold University |
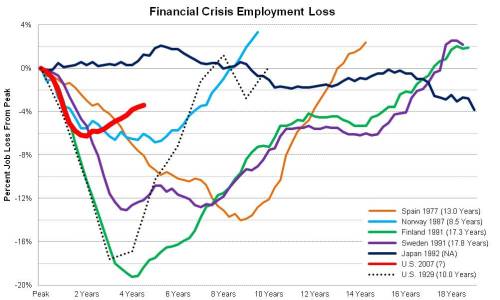
| The Data Don’t Support That The U.S. Bank Bailouts Were Better Than the Swedish Model Posted: 29 Sep 2012 09:40 PM PDT By Hugh, who is a long-time commenter at Naked Capitalism. Originally published at Corrente. On September 24, 2012, Josh Lehner published a post comparing employment (jobs) and unemployment rates in and after various financial crises, including Sweden in 1991 and the US in 2008. Lehner concluded that the policy response to the 2008 financial crisis "compares pretty favorably" and that
This has been used by some to argue erroneously that the Bernanke-Obama-Geithner-Bush-Paulson strategy of bank bailouts effectively proves the Swedish approach of resolving insolvent banks following the 1991 crisis was wrong. What is wrong is this assertion. It ignores Swedish economic history and the limitations of Lehner's evidence. I do not pretend to be an expert on Sweden, but the basic facts are not hard to come by. Sweden had a real estate bubble which burst in 1991. Rather than prop up and bailout the affected banks, the Swedish government went in guaranteed deposits (and creditors) and created a bad bank for bad debts with proceeds flowing back to the government. Banks were recapitalized either by the government (in exchange for stock) or by private investors (by issuance of new stock). By 1992, the banking sector had been restored. The rest of the Swedish economy had not. At this point, the Swedish government had options. It had a fiat currency, but instead chose to wastefully and unsuccessfully defend a currency peg, effectively imposing a gold standard on itself. This was at a time when the Swedish welfare state was in full flower. The added social costs from the bursting of the bubble, the bank recapitalizations, and the self-inflicted restraints of its monetary policy created an unsustainable situation. Rather than loosening monetary policy and increasing investment and stimulus, in 1994, the government opted for the neoliberal solution of partially dismantling the welfare state, promoting exports, and tolerating higher levels of unemployment in the name of increased "competitiveness". If you look at GDP, this worked out rather well with Sweden outperforming the other Nordics. Of course, GDP is not people. But it shows the weakness of the whole line of thought of those criticizing the Swedish model. They look at only a narrow range of indicators, and those not too closely, and overread their meaning. So what were these indicators? First, there is employment (jobs):
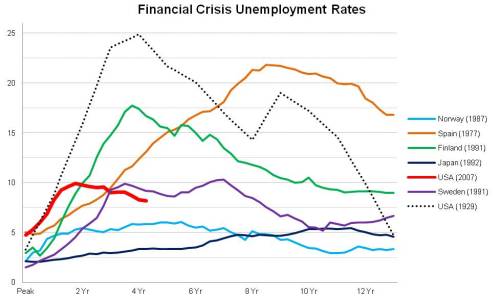
The point I wish to make here is about the red line representing the US. You will notice a quick turnaround in it, and this is supposed to demonstrate the superiority of the bailout approach. But what all comparisons of jobs to a peak leave out is population growth over the period. It is not enough for jobs to get back to January 2008 levels. As I pointed out in a recent post, the working age population grew by some 10.950 million in the interim. If we use the labor force participation rate for January 2008 (66.2), a by no means stellar rate, we come up with an extra 7.249 million jobs needed for them. This is not reflected in the chart. And needing a job and not having one is probably a more pressing concern in the US (with its high debt levels and poor safety net than it is in Sweden even with its partly dismantled welfare state). Finally and also as I have noted before, there is the issue of the deteriorating quality of American jobs. A chart like this one can not treat quality, but its analysis should. Reading the chart, it looks like it took about 10 years for the Swedish economy to hit a new, lower jobs level consistent with the prevailing neoliberal philosophy. This was followed by a goosing in the bubble years of the mid to late 2000s. If anyone wants to say that the Swedish model, along with everything else going on at the time, played some role in those first 10 years, I really have not problem with that. I do have one in describing it as the primary driver of events for 17.8 years. Lehner's second chart tracks unemployment. There are several things to say about this. The official U-3 rate of unemployment (people) topped out at 10% in October 2009 and gradually declined to the present level of 8.1%. However, the participation rate changed markedly from its peak in January 2008 of 66.2 to 63.5 in August 2012. As mentioned above, that change represents 7.249 million people. If these were incorporated into the stats, the unemployment rate in August 2012 would 12.2%. As it is, the decline in the unemployment rate in the US has not been because there are fewer unemployed. There are actually 4.899 million more than when the recession began in December 2007. The decrease is an artifact of a job-seeking definition of unemployment and the resulting removal of millions from the labor force. These are people who would work if jobs were available to them. We know this because from 1996 to 2000, the participation rate was .67 or higher. If we take .67 as a measure of where the labor force should be, the real vs. U-3 unemployment picture looks like this:
Real unemployment plateaued in September 2009 and has averaged 12.8% since. This is a very different from picture portrayed by the official rate. There are a few other things to consider as well. The US has large armed forces and prison populations and neither of these is counted as part of the labor age population, or non-institutional population over 16. Looking at the Swedish data, the following is based on harmonized unemployment figures from OECD Stats. I compared Sweden to Germany because I wanted to show that Sweden does not exist in isolation from its neighbors. The peaks and valleys in the Swedish data, though varying in degree, track with those in the much larger German economy. This argues against the notion that the Swedish model was the principal force behind unemployment in Sweden over a timeframe of some 10-20 years. Put simply, Lehner's charts are being misread and overread, and Sweden's economic history completely ignored. The Swedish model did the job it was designed to do. It fixed the banks, which is a lot more than can be said for what bailouts have done for our banking sector. The Swedish model didn't create years of economic turmoil in Sweden. That was done by the real estate bubble bursting and the government's other responses to it. At the same time, Sweden was not immune from the economic ups and downs happening in the rest of Europe and the world. As for the US, we are up to QE3. Need I say more? The banks remain predatory and broken, and unemployment is improving only because so many are being definitionally "exited" from the labor force and the counts. * * * Lambert here: So, the (issue (is (hardly ("settled")))).
|
| GATA - Judge throws out CFTC's position limits rule Posted: 29 Sep 2012 03:24 PM PDT Our friend Chris Powell at the Gold Anti-Trust Action Committee put CFTC Commissioner Bart Chilton's comment underneath a Reuters article which reports that a federal judge has thrown out the Commodity Futures Trading Commission's (CFTC's) new position limits rule practically on the eve of its adoption by the CFTC. Alexandra Alper and Karey Wutkowski, writing for Reuters, reported: "Judge Robert Wilkins of the U.S. District Court for the District of Columbia threw out the U.S. Commodity Futures Trading Commission's new position limits rule and sent the regulation back to the agency for further consideration. Wilkins ruled that, by law, the CFTC was required to prove that the position limits in commodity markets are necessary to diminish or prevent excessive speculation. He also ruled that the amendments to the 2010 Dodd-Frank financial oversight law "do not constitute a clear and unambiguous mandate to set position limits, as the commission argues."The ruling is a major victory for traders just two weeks before parts of the new position limits rule were scheduled to go into effect." ... More at the link below. Commissioner Chilton responded in a statement: "This is obviously tough news for those of us who believe there's too much speculative concentration in commodity futures and swap markets. While I respect the judgment of the court, there's no question that huge individual trader positions have the potential to influence prices in a way that hurts legitimate hedgers and ultimately consumers." For the entire story and Commissioner Chilton's full statement, please visit GATA at the link below. Source: GATA http://www.gata.org/node/11782 Comment: There were massive changes in the positioning of traders in last week's (for September 18) COT report which were likely associated with the impending position limits, that may or may not be reversed just ahead. We here at Got Gold Report have never been a proponent of draconian position limits per se, holding that position limits are not now and never have been the problem with the metals futures markets. Rather, it has been and may still be that a select group of elite traders are eligible for huge position and accountability limit exemptions from the existing limits, in effect granting an unfair advantage to traders the CFTC classes as "bona fide hedgers." If the CFTC would adhere strictly to the current position limit regime, granting zero exemptions to any trader, there could not be an unfair concentration by either side of the battlefield, assuming the regs are enforced. Indeed, we contend that the new position limits, as proposed, which we believe still allow the harmful position and accountability limit exemptions to "bona fide hedgers," are much more harmful than helpful. They almost certainly will lead to decreased liquidity, increased concentration and flight of market participants to opaque overseas markets. It's not the current limits that cause concentration in futures markets. It is the CFTC's granting of large exemptions to them for a favored few that does. Don't let Commissioner Chilton, Chairman Gensler or anyone else confuse to the contrary. -- Gene Arensberg for Got Gold Report. |


| You are subscribed to email updates from Gold World News Flash 2 To stop receiving these emails, you may unsubscribe now. | Email delivery powered by Google |
| Google Inc., 20 West Kinzie, Chicago IL USA 60610 | |
No comments:
Post a Comment