


saveyourassetsfirst3 |

- Precious Metal Summer Doldrums – Adam Hamilton
- Moody's lowers credit on Italy to Baa3 two notches above junk/Italy's 10 yr bond yield rises above 6%
- Gold & Stock Markets Rally, But Troubles Continue in Europe
- Fallacy of New Deal Rescue Refuted by Gold’s Record
- Western World Finance Is In Deep Trouble
- Does Central-Bank Gold-Buying Signal the Top Is Near?
- 3 Commodities To Buy Before Roubini's 'Perfect Storm'
- Managed money positions hint at bullish turns for gold and silver
- Commodities Update
- Links 7/15/12
- Gold Daily and Silver Weekly Charts - Up Again, Up Again, Jiggity Jig
- Allocated gold isnt there and all hell will break loose, Leeb tells King World News
- Monetary pollution and the Gold Standard
- Gold Standard University Live
- It’s Not a Dollar Crisis: It’s a Gold Crisis
- Greg Weldon’s Macro-analysis & Gold Outlook
- Sprott's Silver Trust Does Another Offering
| Precious Metal Summer Doldrums – Adam Hamilton Posted: 15 Jul 2012 10:20 AM PDT
from zealllc.com: With gold, silver, and their miners' stocks drifting listlessly near correction lows, the sentiment in precious-metals land is even more pessimistic than usual. Bears abound while bulls are now an endangered species. But interestingly, demoralizing consolidations are par for the course this time of year. Throughout most of their secular bull, the precious metals have suffered during the summer doldrums. Back in the era of wind-powered tall ships, the doldrums were the name given to the areas of the oceans near the equator where prevailing winds often didn't exist. These periods of dead calm meant there was no wind for sails, trapping ships for days or even weeks. Many years ago I thought this was a great analogy for how PMs feel in the summer. They drift lethargically and all hope for progress vanishes. The ironic thing is even though this phenomenon happens nearly every summer like clockwork, it always crushes sentiment. The great majority of traders aren't disciplined enough to study the markets and learn their rhythms, so each year the PM summer doldrums discourage them anew. It is amusing in a way, but also sad since the resulting poor sentiment bleeds everywhere eroding the resolve of all PM traders. The best way to combat this irrational bearishness is to understand why it happens and how it tends to look in terms of prices. Naturally gold is the key to the entire precious-metals realm, silver and the PM stocks merely follow its lead. The reason gold prices slump to a long seasonal ebb in summer is because this metal's primary driver, global investment demand, is very uneven across a typical calendar year. While worldwide gold demand sees big spikes in autumn, winter, and spring for various income-cycle and cultural reasons, there are simply none during the summer. If you are not familiar with the strong seasonality gold exhibits, you can get up to speed with one of my gold-bull-seasonals essays. There are no big buying catalysts in summer, and vacationing traders aren't all that interested in the markets anyway. In orbital-mechanics terms, summer starts at the summer solstice in late June (longest day of the year) and ends at the autumnal equinox in late September. But in financial-market terms, summer is simply considered to be calendar June, July, and August. It is these market summers over which the precious metals' performance needs to be considered. Understanding them will steel you against PM despair. Keep on reading @ zealllc.com |
| Posted: 15 Jul 2012 10:15 AM PDT
from harveyorgan.blogspot.com: Gold closed up today to the tune of $36.70 to $1591.60. Silver followed suit rising by 20 cents to $27.34. The total gold comex OI fell by a tiny 737 contracts despite the raid by the bankers. It seems that the raids are having lesser of an effect on longs lately. The total OI complex rests this weekend at 433,320 contracts from Thursday's level of 434,057. The front non official delivery month of July saw its OI rise by 5 contracts despite only 1 delivery. We thus gained 6 contracts or 600 oz of additional gold ounces standing. The next big delivery month is August which is about 2 1/2 weeks away. Here the OI fell marginally from 187,887 to 184,334 as we get our early rollovers into October and December. The estimated volume was quite small at 126,969 compared to the huge raid volume on Thursday at 202,048. The total silver comex OI again differs from gold as it rose by 688 contracts despite the raid. The OI closing level for the weekend is at 123,815 compared to Thursday's close of 123,127. The front official delivery month of July saw its OI drop from 1720 to 1711 for a loss of 9 contracts. We had only 2 deliveries so we lost 7 contracts or 35,000 oz of silver standing. The non official delivery month of August saw its OI fall from 269 to 263. The next big delivery month is September and here the OI rose by 898 contracts from 62,021 to 62,919. The estimated volume on Friday was very weak at 26,374 compared to the raid infested 46,263 contracts on Friday. Keep on reading @ harveyorgan.blogspot.com |
| Gold & Stock Markets Rally, But Troubles Continue in Europe Posted: 15 Jul 2012 10:10 AM PDT
from kingworldnews.com: With gold surging $20, and stock markets rallying around the world, today King World News interviewed 25 year veteran Caesar Bryan. Gabelli & Company has over $31 billion under management and Caesar Bryan has managed the gold fund since its inception in 1994. Here is what Ceasar had to say regarding what is happening around the globe: "There are still huge challenges because there is simply too much debt, and of course the medicine that's being prescribed is to cut government spending in a very weak economic environment. The Spanish, just yesterday, an approximately $60 billion euro further budget cut over the next two years, from 2012 through 2014." Caesar Bryan continues: "This was a significant announcement coming out of Spain. They also announced VAT increases, and sharply cut social security type payments. The VAT increase is over 1% of GDP. It's a rise in the VAT tax from 18% to 21%. Spain is already in a depression and this just adds to the downward bias. This takes additional growth away, it's counter-cyclical. Keep on reading @ kingworldnews.com |
| Fallacy of New Deal Rescue Refuted by Gold’s Record Posted: 15 Jul 2012 10:05 AM PDT
from wealthcycles.com: As we have written many times, statistics can be used to prove just about any point—and then used to refute the same point. (See the WealthCycles.com article Statistics Are A Central Banker's Best Friend, for a few choice examples.) Paul Krugman, the Nobel Prize-winning economist, uses statistics to bolster his argument that the solution to the global financial crisis is more government spending—big government spending. According to Krugman, the government spending (and taxpayer indebtedness) undertaken thus far is far too paltry to have the optimal positive effect on the faltering U.S. and global economies. Forbes columnist Brian Domitrovic calls Krugman and his co-author, New York Federal Reserve economist Gauti Eggertsson, on one statistical argument. In a 2008 article in the American Economic Review, Krugman and Eggertson argue that the years 1933 to 1937 "registered the strongest output growth (39 percent) of any four-year period in U.S. history outside of wartime." Their premise: that the alleged period of economic growth was sparked by President Franklin D. Roosevelt's New Deal, a campaign of massive government spending aimed at pulling the United States from the depths of the Great Depression. Referring to a 2011 Great Depression conference at Ohio University, where Eggertson repeated his claim, Domitrovic writes: In Ohio, Eggertsson and Rauchway made clear their intentions in lionizing the 1933-37 record. These were to indicate – to prove – that the New Deal government programs enacted in this period represented especially effective economic policy. Try the stuff again today in our depressed circumstances, they virtually screamed. But there are a few flaws in Krugman/Eggertsson's analysis, Domitrovic points out. First of all, they pulled their data from the government's own records—which as we have noted elsewhere are sometimes skewed to benefit the government's own interests. Domitrovic instead pulls from measuringworth.com, where adjusted for inflation, it is in fact the four-year period from 1878 to 1882 that shows the higher rate of growth, approximately 28% GDP per capita in 2005 dollars versus 25% for the later period. Keep on reading @ wealthcycles.com |
| Western World Finance Is In Deep Trouble Posted: 15 Jul 2012 09:59 AM PDT
from jsmineset.com: My Dear Friends, I will expand on this over the summer, but as an introduction: 1. Economics are not weekly and monthly statistics. It is comprised of motion and change that determines the trend. 2. The effect of economic actions is not a static amount, for example0 QE in some determined period of time, but rather an inescapable cumulative impact due to the rate of change. Each event of stimulation requires greater effort than the previous. 3. Economic activity is either increasing at an increasing rate or it is decelerating and an increasing rate. There are no Plateaus of Prosperity or Goldilocks Economics other than in the minds of spin doctors. 4. Debt has come home to be confronted here and now. There is no normal business means of accomplishing this. The conclusion to be outlined in many ways over the summer is clearly the Western world finance is in deep trouble. QE to infinity is the only political tool that can kick the can. Gold will trade at and above $3500 regardless of all the previous attempts to manipulate it. Cash market buyers will prevent all attempts to color gold otherwise. Respectfully, Keep on reading @ jsmineset.com |
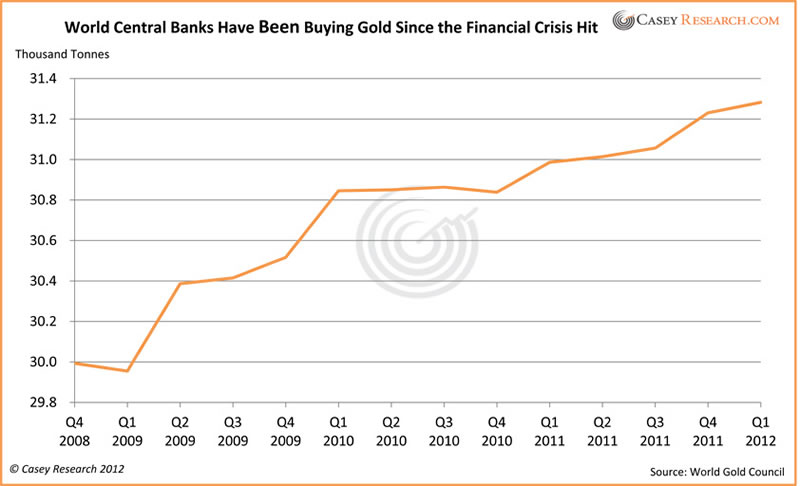
| Does Central-Bank Gold-Buying Signal the Top Is Near? Posted: 15 Jul 2012 09:55 AM PDT
from caseyresearch.com: Doug Casey told me in January, "The only thing that scares me is that central banks are buying a lot of gold; they're historically contrary indicators." When it comes to buying gold, central banks have such a poor timing record that they're frequently joked about as a contrary indicator. We dislike referring to tonnes of gold instead of ounces. Gold is priced by the ounce. But certain market players, especially central banks, report gold transactions in tonnes. One metric ton (tonne) equals 32,150.7 troy ounces. Recently, they have been buying, quite literally, tonnes of it. Consider the following: Net central-bank purchases in 2011 exceeded 455 tonnes. This was only the second increase since 1988 (the first in 2010) and the largest since 1964. Here's the picture of what has transpired since the financial crisis hit in late 2008. Keep on reading @ caseyresearch.com |
| 3 Commodities To Buy Before Roubini's 'Perfect Storm' Posted: 15 Jul 2012 08:15 AM PDT By CommodityHQ: By Jared Cummans Nouriel Roubini, known as "Dr. Doom" for his outlandish predictions on the economy, has a choppy forecast for the coming year. Back in May, Roubini predicted a tumultuous 2013 based on a combination of four factors, "stalling growth in the U.S., debt troubles in Europe, a slowdown in emerging markets, particularly China, and military conflict in Iran," writes Ansuya Harjani. Now, Roubini says that things are shaping up in favor of his foresight, as China is indeed faced with a slowdown, the euro zone is in shambles, the U.S. is sputtering along, and things in Iran have heated up once again [see also Doomsday Special: 7 Hard Asset Investments You Can Hold in Your Hand]. With a disturbingly accurate prediction of the future (although some would argue that all four of the aforementioned factors were already obvious at the time Roubini made his remarks), investors may want Complete Story » |
| Managed money positions hint at bullish turns for gold and silver Posted: 15 Jul 2012 07:00 AM PDT I have recently written about the breakdown of disaggregated data from the futures markets into producers and swap dealers for gold and silver futures, as reported in the Commitment of Traders ... |
| Posted: 15 Jul 2012 03:07 AM PDT These Updated Closing Numbers Are For July 5, 2012. Now that markets have settled down after several choppy months, we expect to find several new trades for our readers, auto-traders and your editor. It's been a long dry spell, but you cannot push trades in flat mess markets. 3-7-12 September Silver $36.00-$37.00 Call Spread Paid 32 or $1600. Settled at 1.2 or $60 ($1540) 54 days. Trader Tracks Situational Alert Tuesday, July 3, 2012, 8am PST. Today is the beginning of the largest wave three of five up in the gold futures for the August, 2012, contract this morning. However, two things can temporarily slow it down this week: (1) Wednesday is a holiday tomorrow and traders prefer to be a little long in this gold bull market but not overly so as gold can move short overseas while the USA markets are closed. Expect pausing and going neutral in most markets today as tomorrow they are closed. On Thursday, the wave three up can resume or, we can move back mildly on a normal wave four. If so, then Friday is five up, also normally a small movement in prices. (2) The second blocker on upward gold progress today…we are in the middle of our third attempt to breakout and through upward gold resistance at $1620-$1622.50. Usually, the breakout occurs on the third try like today but sometimes (rarely) it happens on number four. Considering the holiday taking away some trading power, the fourth try, probably the end of this week or, next week should give us the larger rally we are expecting. Last week, we called for a +$50 move up in gold futures and a +$.85 move in silver futures. We got the move on Friday instead of Thursday due to a news blocking event on Thursday in Europe, but releasing on Friday. Our intermediate goal for gold is $1,736.50 on a +50% retracement. Considering all the adventures coming between September 1, 2012, and March 31, 2013, we think gold not only has a chance to touch $1,923 late this year, and match the old high, but to rise even further to $2,000, $2,250 and $2,450 on the February, 2013, futures contracts. Our intermediate goal for silver futures is $38.15, with our price even higher after September, 2012. Our forecast on grains is proving correct from many months ago. We see worse weather, legendary low bin reserves and smashed crops on drought. Oddly, these crop failures have proven to consistently re-appear in economic depressions. There is a strong chance we can go to rationing on corn this fall in the USA crops as we said in several previous forecasts. Crude oil dominates the CRB and had traded down into the $77-$78 area, but has now jumped higher on more testy Middle Eastern news, a cut-back in reserves, better economic news (demand) and normal technicals. Crude oil for August most active futures this morning is $87.00 in the trading range of $84.50 to $88.50. That $88.50 is our next upper resistance. Iran is struggling with sanctions on hard inflation, difficult with sanctioned oil sales, and sparse imports of mandatory unleaded gasoline. Iran has no refining capacity and relies on ships to haul in their gasoline. They called an emergency meeting with OPEC this week saying they need $100 a barrel oil to make their budgets work. They'll get it but probably from market forces on Chinese buying not from OPEC. China for the most part ignores political games like the sanctions on Iran and nobody can stop them. The USA long bonds and US Dollar are in the red just a touch before the holiday tomorrow with all other futures and futures related currencies in the green on my screen at 8am, 7-3-12. –Traderrog This posting includes an audio/video/photo media file: Download Now |
| Posted: 14 Jul 2012 11:43 PM PDT GMO in sport: Genetically Modified Olympians? Raw Story The Call of Duty Villain of the Year is YOU Something Awful (FrankZappasGuitar) In Vast Effort, F.D.A. Spied on E-Mails of Its Own Scientists New York Times WikiLeaks wins case against VISA RT (skippy). This is cool. Italy in Crisis: the rise of 'Super Mario' technocracy Andrew Marshall, ROAR (Susan Pizzo) Martial Law Britain Craig Murray (just me) Liborfest! Adam Posen: it's time the UK stopped "fetish-ising" its banks Ian Fraser Tim Geithner's Libor: Where Was the Barking Dog? Scarecrow, Firedoglake Libor scandal – the net widens Independent U.S. Is Building Criminal Cases in Fixing of Interest Rates New York Times U.S. Drugged Detainees to Obtain FALSE Confessions George Washington Where Obama failed on forging peace in the Middle East Washington Post Obama TV ad attacks Romney business record Financial Times. Ad here. As several readers pointed out in Links yesterday, the media is falling in behind Obama and news coverage like this is proof. For reference, "Daisy" is the gold standard for attack ads. Guest post:The Romney job record in Massachusetts Jon Hammond, Angry Bear David House Grand Jury Notes Pastebin (Lambert). Bradley Manning related. Weakness in recent ISI company survey SoberLook How Jamie Dimon and 'Flexible Accounting' Hid JPM's London Whale Loss Jesse 'CIO Risk Management was ineffective in dealing with Synthetic Credit Portfolio' FT Alphaville. Cover page reads like Dimon's Congressional talking points. So which came first? Here Comes the Catch in Home Equity Loans Gretchen Morgenson, New York Times Mish & Steve Debate: Steve Says (I) Steve Keen (Glenn Condell) Antidumping as cooperation VoxEU Krugman sides with Wren-Lewis — and admits he was wrong about the crisis Mike Norman Occupy Argument: It's Constitutional Global Economic Intersection Antidote du jour (Richard Smith). Backstory here.
|
| Gold Daily and Silver Weekly Charts - Up Again, Up Again, Jiggity Jig Posted: 14 Jul 2012 11:00 PM PDT Jesse's cafe |
| Allocated gold isnt there and all hell will break loose, Leeb tells King World News Posted: 14 Jul 2012 11:00 PM PDT |
| Monetary pollution and the Gold Standard Posted: 14 Jul 2012 10:30 PM PDT Ferdinand Lips |
| Posted: 14 Jul 2012 10:00 PM PDT |
| It’s Not a Dollar Crisis: It’s a Gold Crisis Posted: 14 Jul 2012 10:00 PM PDT |
| Greg Weldon’s Macro-analysis & Gold Outlook Posted: 14 Jul 2012 03:28 PM PDT Greg Weldon analyzes key macroeconomic developments, potential new policy from central banks, the current lack thereof and the effect on the markets. Topics included the US Fed, the ECB, US economy, European economy, China, India and Japan. Learn more about Greg's work and research here.  Greg Weldon started his Wall Street career working in the Comex Gold and Silver Pits after graduating Colgate University. He progressed as an institutional sales broker at Lehman and Prudential before joining Moore Capital as a proprietary trader. At Moore, Greg honed his systematic trading methodology and risk management discipline before joining Commodity Corporation where he became one of their top risk-adjusted money managers. Today, he publishes Weldon's Money Monitor, The Metal Monitor and The ETF Playbook in addition to operating his Managed Futures Account Program as a CTA. He has a unique ability to define and forecast the market's direction through his proprietary dissection of fundamental and technical market data. Few publications offer the wide scope offered within the macro-perspective presented by Greg, and few newsletters so fluidly combine fundamentals, technical analysis, inter-market examinations, psychology, and intuitive insights as does Weldon's Money Monitor… stacking macro-trends against the micro-evolution taking place. Weldon Financial is now a highly regarded and profitable publishing company, having garnered some of the world's most respected fund managers as loyal and daily readers. Greg has been featured on CNBC Power Lunch and Fast Money, Moneytalks on the Corus Radio Network, Bloomberg radio and has been featured, as a global macro speaker, at several international financial conferences and mentioned in several articles and investment websites. Greg published, Gold Trading Boot Camp, How to Master the Basics and Become a Successful Commodities Investor, in late 2006 in which he predicted the current global credit crisis and discussed the impact on GOLD from intensified central bank debt monetization.
|
| Sprott's Silver Trust Does Another Offering Posted: 14 Jul 2012 06:07 AM PDT ¤ Yesterday in Gold and SilverThe gold price traded pretty flat and on little volume during the Friday trading session in the Far East. But a rally began shortly before 3:30 p.m. Hong Kong time that lasted right up until the London silver fix, which came shortly before 12:00 noon BST. From that point, gold got sold off to its New York low...$1,578.30 spot...which was set just a few minutes before the open of the equity markets. Then a far more substantial rally began that came close to blasting through the $1,600 mark, but before it could do that, a not-for-profit seller showed up, or the buyer disappeared. The high for the day [$1,598.00 spot] was set shortly after 10:00 a.m. Eastern...which could have been a slightly delayed London p.m. gold fix. After that bit of excitement, the gold price got sold off quietly in three different bouts of very light volume selling. The gold price closed at $1,589.40 spot...up $17.40 on the day...and well of its high. Net volume was pretty light...around 112,000 contracts.
Silver's price pattern on Friday was very similar to gold's...almost too similar...with the major inflection points occurring almost at the same moment as gold's...so I shan't bore you with the play-by-play on this, as it's readily evident on the Kitco silver chart below. Silver's New York low and high came within 35 minutes of each other. The high was $27.70 spot...and the low was $27.09 spot. Silver closed at $27.34 spot...up 13 cents...almost double Thursday's 7 cent gain. I was underwhelmed.
The dollar index traded within a 15 basis point price range during the entire Far East trading session. Then there was a bit of dip shortly after 10:00 a.m. London time...and from there it rose to it's high of the day at precisely 9:00 a.m. in New York. The dollar index then fell off the proverbial cliff starting about 9:20 a.m...dropping almost 40 basis points in less than forty minutes. From that point it traded flat to down a hair into the 5:15 p.m. Eastern time close. The dollar index closed at 83.35...down 36 basis points on the day. The waterfall decline in the dollar index at the time indicated on the ino.com chart below certainly accounts for the big rise in gold and silver prices during that time period. The timing was so precise on this that it looked like someone hit a 'Buy Gold/Silver-Sell the Dollar Index' button...as no normal trader could react to these changes this fast on their own...and you really have to look more closely to see this event in platinum and palladium during the same time period, as the price moves were not anywhere near as pronounced. The obvious targets were gold and silver.
The gold shares chopped higher all day in New York...with the high of the day coming shortly after 1:00 p.m. Eastern time...a good three hours after gold's high for day was in at the London p.m. gold fix. From that high, the stocks traded a bit lower into the close. The HUI finished Friday the 13th up 1.47%.
Virtually every large cap silver stock in Nick Laird's Silver Sentiment Index closed basically flat on the day...but the odd junior producer did much better than that. The SSI closed up a microscopic 0.09%.
(Click on image to enlarge) The CME's Daily Delivery Report showed that 2 gold and 122 silver contracts were posted for delivery on Tuesday. In silver, the big short/issuer was Jefferies with 121 of those contracts...and the biggest long/stoppers were, as usual, JPMorgan [68 contracts]...and the Bank of Nova Scotia [49 contracts]. The link to yesterday's Issuers and Stoppers Report is here. There were no reported changes in GLD...but over at SLV an authorized participant withdrew 1,066,548 troy ounces. There were some material changes in the short positions held in SLV and GLD. These were reported over at the shortsqueeze.com Internet site a couple of days ago. The short position in SLV declined by 17.78%...or about 2,400,000 shares/ounces...and is now down to 11,080,200 shares/troy ounces of silver, or 344.6 metric tonnes. This represents almost six days of world silver production. That's how much silver is owed SLV to back all the shares sold short. In GLD the short position declined by 25.98%...or around 4.93 million shares. GLD's short position is now down to 14,035,600 shares...none of which have any physical gold backing them at all. This is around 1.40 million ounces...which is equivalent to 43.5 tonnes of gold. The U.S. Mint had another small sales report yesterday. The sold 3,000 ounces of gold eagles...and 151,000 silver eagles. Month-to-date the mint has sold 16,500 ounces of gold eagles...1,500 one-ounce 24K gold buffaloes...and 906,000 silver eagles. Over at the Comex-approved depositories on Thursday, they reported receiving 616,012 troy ounces of silver...and shipped 343,099 of the stuff out the door. The link to that action is here. The Commitment of Traders Report showed improvements in the Commercial category in both silver and gold, but not as much as I would have liked. JPMorgan et al reduced their net short position in silver by 3,247 contracts, or 16.2 million ounces. The Commercial net short position in silver is back down to just 14,100 contracts, or 70.5 million ounces. That's not a record low, but still in the 'wildly bullish' range. The 'big 4' are short 143.3 million ounces of silver...and the '5 through 8' are short an additional 45.3 million ounces. These 'big 8' Commercial traders are short 188.6 million ounces of silver, or 267% of the entire Commercial net short position. And once you removed all the market-neutral spread trades, the 'big 8' are short 38.5% of the entire Comex silver market on a net basis...and that's a minimum number. Once you remove the spread trades that only show up in the Disaggregated COT Report, that percentage would certainly exceed 40%. And all of these traders are working together as a group to rig the silver market. In gold, the Commercial net short position declined by 13,871 contracts, or 1.39 million ounces. The Commercial net short position is now down to 15.28 million ounces. Like silver, this is not a record low, but still in the hugely bullish camp. The 'big 4' are short 10.40 million ounces...and the '5 through 8' short holders are short an additional 5.16 million ounces. The total of the 'big 8' short holders is 15.56 million ounces...a hair over 100% of the entire Commercial net short position show in the previous paragraph. If JPMorgan et al can easily control the gold market holding 101.8% of the Commercial net short position...they have the silver market in a vice...holding 267% of the Commercial net short position. And the 'big 8' shorts in silver are the same players as the 'big 8' short players in gold. Before getting into the stories for today, I had a reader send me these two bird pictures...and I've had them sitting on my desktop for the last month. I just couldn't bring myself to send them to the recycle bin without posting them first. The bird in question is a Himalayan Monal...a bird I'd never heard of before. But it's a beauty.
For a weekend, I don't have that many stories for you...but that probably has to do with the fact that Roy Stephens has been out Internet range all week. The world's economic, financial and monetary system continue to circle the drain at an ever-increasing velocity. Indian central bank wants people to exchange metal for paper. Richard Russell: Inflate, or die. LIBOR scandal brings gold price manipulation once more to the fore. ¤ Critical ReadsSubscribeJPM Admits CIO Group Consistently Mismarked Hundreds Of Billions In CDS In Effort To Artificially Boost ProfitsBack on May 30th we wrote "The Second Act Of The JPM CIO Fiasco Has Arrived - Mismarking Hundreds Of Billions In Credit Default Swaps" in which we made it abundantly clear that due to the Over The Counter nature of CDS one can easily make up whatever marks one wants in order to boost the P&L impact of a given position. As of moments ago this too has been proven to be the case. From a just filed very shocking 8K which takes the "Whale" saga to a whole new level. To wit: 'the recently discovered information raises questions about the integrity of the trader marks, and suggests that certain individuals may have been seeking to avoid showing the full amount of the losses being incurred in the portfolio during the first quarter. As a result, the Firm is no longer confident that the trader marks used to prepare the Firm's reported first quarter results (although within the established thresholds) reflect good faith estimates of fair value at quarter end." As a result of this, regulators who now are only 3 years behind the curve, are most likely snooping to inquire not only how JPM did it (call us: we can brief you in 2 minutes), but who else has been doing this? Hint: everyone. This must read Zero Hedge piece was sent to me by reader 'David in California'...and the link is here.  JPMorgan's Botched Trades May Generate $7.5 Billion LossBotched trades by a JPMorgan Chase & Co. unit that Jamie Dimon had pushed to boost profit were masked by weak internal controls and may ultimately saddle the bank with a $7.5 billion loss. JPMorgan's chief investment office has lost $5.8 billion on the trades so far, and that figure may climb by $1.7 billion in a worst-case scenario, Dimon, the bank's chairman and chief executive officer, said yesterday. Net income fell 9 percent to $4.96 billion in the second quarter, the bank said. It restated first-quarter results to reduce profit by $459 million after a review of the unit found employees may have hid souring bets. Dimon, 56, had brushed off concerns raised by some of his most senior advisers, including heads of JPMorgan's investment bank, about the lack of transparency and the quality of internal controls in the CIO in past years, Bloomberg News reported last month, citing a person with direct knowledge of the matter. Capping the potential loss's size and revamping management of the unit responsible may help him restore investor confidence. This Bloomberg story was posted on their website late Friday afternoon...and I thank West Virginia reader Elliot Simon for sending it...and the link is here.  Libor Rigging: The Tip of the IcebergThe rigging of the LIBOR interest rate...GATA consultant Rob Kirby of Kirby Analytics in Toronto wrote yesterday...was only a small part of the greater scheme of controlling interest rates and the price of gold and supporting the U.S. dollar with vast derivative positions on the books of investment bank JPMorgan Chase. Kirby's commentary is headlined "LIBOR Rigging: Tip of the Iceberg" and it's posted over at the goldseek.com website. This very long and rather involved commentary is well worth the read...and it's not the parts you won't understand that will scare you. The link is here.  Smackdown: Bartiromo vs. SpitzerThis CNBC video does not show Maria at her finest, as she looked like she'd totally lost it. Couldn't happen to a finer person. The video clip runs a hair over ten minutes...and I thank 'David in California' for his second offering in today's column. The link is here.  Bank of England says it acted on Geithner's Libor emailDocuments obtained by Reuters earlier on Friday showed that U.S. Treasury Secretary Timothy Geithner pressed the British central bank in June 2008 to make changes to the way that the widely used interest rate benchmark was set. Geithner, who was the head of the New York Federal Reserve Bank at the time, sent a private email to BoE Governor Mervyn King recommending six ways to enhance the credibility of the London interbank offered rate. The BoE passed on Geithner's thoughts in an email to the British Bankers Association (BBA) - the banking group responsible for Libor - which at that stage had already decided to launch a review of the rate. This story was posted on the Reuters website early yesterday afternoon Eastern time...and I thank Washington state reader S.A. for sharing it with us. The link is here.  Sir Mervyn left to flounder in a Libor can of wormsIt just gets worse. If Sir Mervyn King was up to his waist in Libor before, now he's drowning in it. And the Bank of England Governor's not the only one – top brass at the Financial Services Authority and the British Bankers' Association are hardly doing much better. The decision to release emails detailing how Tim Geithner warned the Bank in June 2008 about fears that Libor could be manipulated have opened a new can of worms. Then head of the Federal Reserve Bank of New York, Geithner's email recommended steps to "improve the integrity and transparency of the rate-setting process... including procedures designed to prevent accidental or deliberate misreporting". I found this story posted on The Telegraph's Internet site yesterday...and it's definitely worth the read. The link is here.  Moody's downgrades Italy's government bond rating to Baa2 from A3, maintains negative outlookMoody's Investors Service has downgraded Italy's government bond rating to Baa2 from A3. The outlook remains negative. Italy's Prime-2 short-term rating has not changed. The decision to downgrade Italy's rating reflects the following key factors: 1. Italy is more likely to experience a further sharp increase in its funding costs or the loss of market access than at the time of our rating action five months ago due to increasingly |


.png)


| You are subscribed to email updates from Gold World News Flash 2 To stop receiving these emails, you may unsubscribe now. | Email delivery powered by Google |
| Google Inc., 20 West Kinzie, Chicago IL USA 60610 | |
No comments:
Post a Comment