


saveyourassetsfirst3 |

- Schiff: "Gartman called a Gold bubble at $1900"
- Silver Market Update
- David Dreman's Favorite Stock Picks
- Is Gold In A Bubble?
- Gold "The Worlds Currency"
- PMFF is on a high today
- Royal Gold: Dethroned As King Of Gold Royalties
- Warren Buffett's Bank of America Investment: Not A Reason To Invest In The Financials
- Ingles Markets: Sleep Well At Night With Durable Dividend That Pays 4.5%
- Matt Stoller: Power Politics – What Eric Schneiderman Reveals About Obama
- The Wages of Destroying Labor Bargaining Power: Nearly 30% of Job Losses Due to Management Cutting Pie in Favor of Capital
- Gold And Silver Price Drop; Retail Sales Soar
- Is the Gold Correction Over?
- How To Get a Second Chance to Buy Gold at $1,700
- Interview with Meadow Bay Gold 8/26
- TheDailyGoldPodcast with Jeb Handwerger 8/26
- COT Report, Perth Mint, My poker game
- Gold Coins: The Mystery of the Double Eagle
- "Brief History of the Gold Standard in the United States"
| Schiff: "Gartman called a Gold bubble at $1900" Posted: 28 Aug 2011 03:59 AM PDT But will NEVER BE CALLED OUT ON IT WHEN ITS AT $3000. Whats new. Gartman= ponzi protector= Warren Buff. Nothing to see here. FAST FORWARD TO 43 minutes please.  | |||||||||||||||||||||||||||||||||||||
| Posted: 28 Aug 2011 02:44 AM PDT After one more up day silver reacted back with gold as predicted in the last update and then found support at the lower trendline shown on its 6-month chart above its rising 50-day moving average. We now have to be careful with silver because there is widespread rampant bullishness with some extravagent targets being bandied about, and we know what usually happens when that is the case. Also, as set out in the Gold Market update, gold is still way overbought and thought to be vulnerable to a potentially substantial correction. | |||||||||||||||||||||||||||||||||||||
| David Dreman's Favorite Stock Picks Posted: 28 Aug 2011 01:49 AM PDT By Insider Monkey: David Dreman founded Dreman Value Management and grew the mutual fund to a whopping $22 billion, but that was in 2007. Since then, the size of Dreman Value Management has dwindled to just over $5 billion. While the numbers still aren't nothing to sneeze at, it brings to mind worries that Dreman may be on a downward swing. After all, since the end of June, Dreman's top 25 stock picks have lost 16%, well underperforming the S&P 500 for the same period. Here are David Dreman's top stock picks at the end of June:
Complete Story » | |||||||||||||||||||||||||||||||||||||
| Posted: 28 Aug 2011 01:08 AM PDT By Thomas Noon: Last week, Wells Fargo (WFC) issued a "Gold Bubble" warning and this week, the WSJ headlines screamed "Gold Rally Hits a Wall". The Wells article gave no reason for gold prices to be mispriced -- other than the concern that people will sell in panic if prices go flat or decline. So, a decline will lead to further declines? And, this rise is only being caused by the rise itself? "Investors in gold are hoping that other investors will come along to bid up their holdings in the future," Wells Fargo says. Wells knows what the worldwide "hopes" of gold buyers are -- and sellers? So, the majority of gold holders are only holding it for a higher price? Once again, the basis of a call for a decline is "it has risen this far, therefore that is too far". I cannot accept this as real analysis; it just doesn't Complete Story » | |||||||||||||||||||||||||||||||||||||
| Posted: 28 Aug 2011 01:00 AM PDT | |||||||||||||||||||||||||||||||||||||
| Posted: 28 Aug 2011 12:58 AM PDT The Precious Metal Fondle Factor is on a high today!~~:w00t:~Attachment 10160 You know what this means you smart people! Take a minimum of 15 minutes sometime today, get out and play with it!~:love30:~Attachment 10161 Photos are encouraged too. | |||||||||||||||||||||||||||||||||||||
| Royal Gold: Dethroned As King Of Gold Royalties Posted: 27 Aug 2011 11:04 PM PDT It was not until late Friday, I had finally decided who will become the largest gold royalty company, Royal Gold (RGLD) or Franco-Nevada (FNNVF.PK). My decision now favors Franco-Nevada for three reasons.
Not only does Prosperity propel Franco's long term production growth, but it came a very cheap cost. Because the deal between Complete Story » | |||||||||||||||||||||||||||||||||||||
| Warren Buffett's Bank of America Investment: Not A Reason To Invest In The Financials Posted: 27 Aug 2011 10:55 PM PDT By The Independent Investor: I love how the press is covering news stories today in our apocolyptic world. It's as if every price move is either a tremendous buying opportunity or the chance to sell before the recession. Most economic data and market moves are interpreted within this black and white narrative, and everyone seems to be obssessed with determining that exact moment when the markets will bottom. There is no better example of this trend than the recent news story that Warren Buffett would be taking a 5 billion dollar stake in Bank of America (BAC) in exchange for preferred stock with 6% and warrants to purchase another several hundred million shares. The press and some in the trading community absolutely loved this story with screams coming from the floor and none other than CNBC's offical stock picking king, Jim Cramer, proclaiming that the day of shorting the financials had come to an Complete Story » | |||||||||||||||||||||||||||||||||||||
| Ingles Markets: Sleep Well At Night With Durable Dividend That Pays 4.5% Posted: 27 Aug 2011 09:20 PM PDT By Brad Thomas: Last week I wrote a Seeking Alpha article on the growth of the necessity-driven retail category and specifically, the rapidly expanding dollar store sector. Fueled by low job growth and continued consumer confidence pressures, the necessity-based retailers are all reporting strong results and performance, sustained by business models that are not dependant on discretionary spending. While these (discretionary) spending patterns fluctuate during uncertain economic times, the necessity-driven consumers tend to spend on food and other goods that are not dependant on discretionary buying habits. As noted in my latest article, the larger dollar store chains are all growing and quickly increasing market share within the dollar sector as well as over-lapping into the drug-store, grocery-store, and discount-store sectors. The dollar Complete Story » | |||||||||||||||||||||||||||||||||||||
| Matt Stoller: Power Politics – What Eric Schneiderman Reveals About Obama Posted: 27 Aug 2011 08:15 PM PDT By Matt Stoller, a fellow at the Roosevelt Institute. He is the former Senior Policy Advisor to Rep. Alan Grayson. You can reach him at stoller (at) gmail.com or follow him on Twitter at @matthewstoller A lot of people have asked why New York Attorney General Eric Schneiderman is going after the banks as aggressively as he is. It's almost unbelievable that one lone elected official, who happens to have powerful legal tools at his disposal, is doing something that no one with any serious degree of power has done. So what is the secret? What kind of machinations is he undertaking that no one else has been able to do? I've known Schneiderman for a few years, back when he was a state Senator working to reform the Rockefeller drug laws. And my answer to this question is pretty simple. He wants to. That's it. Eric Schneiderman is investigating the banks because he thinks it's the right thing to do. So he's doing it. This guy has thought about his politics. He wrote an article about how he sees politics in 2008 in the Nation, and in his inaugural speech as NY AG he talked about the need to restore faith in both public and private institutions. Free will still counts for something, apparently. In all the absurdly stupid punditry, the simple application of free will to our elected officials goes missing. Yeah, Obama got money from Wall Street. But Obama is choosing to pursue a policy of foreclosures and bank bailouts not because of any grand corporate scheme. He just wants to. He thinks it's the right thing to do, and he's doing it. If you don't think it's the right thing to do, then you shouldn't be disappointed in him any more than you might have been disappointed in Bush. Obama is not trying to do the opposite of what he's doing, he's not repeatedly suckered by Republicans, and he isn't naive or stupid. Obama is simply doing what he thinks is right. So is Eric Schneiderman. So is Tom Miller. So are any number of elected officials out there. In positions of power, the best expression I heard is that "up there the air is thin". That is, you have enormous latitude, if you want to use it. Power can be wielded creatively and effectively on behalf of whatever it is the wielder wants. Now of course there are constraints, plenty of them. Smart politicians spend their time working to maximize the constraints they want to impose and weakening the ones they want to overcome. But the basic Reaganite liberal argument defending supplication towards Obama these days is that Obama is "disappointing". In this line of thought, powerful corporate interests and Republicans are preventing him from enacting what his real agenda would be were he unfettered by this mean machine. Eric Schneiderman, who is in a far less powerful position as New York Attorney General, shows that this is utter hogwash. Obama is who he is, and anyone who thinks otherwise is selling something. The banking system is really at the heart of our politics, which is why it's such a great test of one's political theory of change. I've been following the foreclosure fraud story for a few years now, because it's the tail end of a massive economy-wide fraud scheme that started as early as 2003. The securitization chain failure can't be put back in the bottle, the housing system it collapsed is simply too big to bail. So elites keep trying to patch this up the way they have everything else. It isn't working. And their scheme has been obvious and obviously dishonest. Along with Obama (who I criticized as empty as early as 2004, ratcheting this up to dishonest and authoritarian by 2006-2007), I pointed out that Iowa Attorney General Tom Miller was engaged in serious bad faith only a few months after the negotiations started. I'm no genius, I just listened to what these people actually said and did. Obama mocks the idea that he is an honest politician, overtly, lying about NAFTA and FISA very early on in power. Miller lied to activists about being willing to put bankers in jail, and then said he was negotiating with banks in secret. It was overt. For Miller, as with Obama, few people really picked up on the lies until recently. Iowa activists who heckled Miller got it, as did Naked Capitalism readers. Now it's becoming more and more obvious. That's just how it is, I suppose, people in the establishment are paid to not notice corruption until the harsh glare is too bright. The crazy thing is that robosigning is apparently still going on. Right now, the "settlement" talks are the equivalent of law enforcement negotiating with a serial killer over whether he'll get a parking ticket, even as he continually sprays bullets into the neighborhood. Even having these "settlement" talks when the actual crimes haven't been investigated or a complaint hasn't been registered should be example enough that this process is rigged as badly as Dodd-Frank. It should not be a surprise that the administration is putting pressure on Eric Schneiderman, that Tom Miller is kicking him out of the club house. That's who these people are. It's what they believe in. Just as it should not be a surprise, though it is laudable, that Schneiderman isn't knuckling under to the administration. I suspect he probably is laughing at the idiocy of Miller's pressure tactic. I mean, this is a guy going up some of the most powerful entities in the United States: Bank of New York Mellon, Bank of America, the New York Fed, etc. And the Iowa Attorney General isn't going let him on conference calls? Mmmkay. When you look closely at most significant areas of government, it becomes clear that the President and his administration are enormously powerful actors who get a lot done. Handing over our national wealth to the banks and to China is not nothing. These people are reorganizing the economy and the political system so that there are no constraints on the oligarchical interests that fund and pay them. That is their goal, it has been their goal from day one (or even before that), and anyone who says otherwise is just wrong or deluding him or herself. Obama spoke at the founding of Robert Rubin's Hamilton Institute, and his first, and most important by far policy initiative, was his whipping for TARP, a policy that was signed by Bush but could not have passed without Obama getting his party in line. That was his goal, and he's still pursuing it. The numerous "what happened to Obama" wailing editorials overlook the consistency of his policy agenda, which stretches back years at this point. If someone worked or works for the Obama administration, or the Department of Justice, or any other executive branch agency, they need to remember their service as a mark of shame for the rest of their lives. Remembering how they participated in this example of how to govern is literally the least they could do for the damage they have caused. I would leave out the small number of people who are there to overtly prevent as much damage as possible, and those who resign or are fired in protest. For the rest of the Democratic Party, well, reality is just beginning to intrude into the fantasy-land of partisans, even though the 2010 loss should have delivered a searing wake-up call to the failure Obama's policy agenda. From 2006-2008, the Bush administration's failures crashed down upon conservatives, and they in many ways could not cope. But their intellectual collapse was bailed out by Obama. Faux liberals are seeing their grand experiment in tatters, though right now they can only admit to feeling disappointed because the recognition that they have been swindled is far too painful. And the recognition for many of the professionals is even more difficult, because they must recognize that they have helped swindle many others and acknowledge the debt they have incurred to their victims. The signs of coming betrayal were there, but in the end it all comes down to judging people based on what they do and who they choose as opponents. And this Democratic partisans did not do, choosing instead a comfortable delusional fantasy-land where foreclosures don't matter and theft enabled by Obama (and Clinton before him) doesn't matter. Eric Schneiderman's willingness to go after the banks and stand up to the corruption of the Bush and Obama administrations should be a reminder to all of us of this. We have free will. He is doing the right thing for no other reason than because he wants to, because he believes in it. He is going to face serious consequences for this, very nasty stuff. Eliot Spitzer was taken down and his name dragged through mud because of who he took on. Paying ugly costs for standing up is routine, unfortunately, in modern America. And the least powerful among us face far worse consequences than politicians who are embarrassed. But integrity exists, and Schneiderman is showing that free will can be exercised in its service. This fact is true of many people, not just Schneiderman; Bill McKibbin, Jane Hamsher, Dan Choi and others just got arrested in front of the White House to register dissent. So next time someone tells you that you have no choice but to support one of the two branches of the banking party, just remember, you also have free will. And the only person who can take that away from you, is you.
| |||||||||||||||||||||||||||||||||||||
| Posted: 27 Aug 2011 04:22 PM PDT Yves here. This short piece by Robert Gordon is important because it seeks to quantify the impact of a phenomenon that economists have noticed a bit late in the game: that the benefits of GDP growth, which used to go mainly to labor (via increased hiring and better wages) now benefit capitalists fare more than ordinary workers. The shift towards increases in GDP favoring corporate profits at the expense of labor became pronounced in the weak Bush expansion (we commented on it in a 2005 article) and Gordon's effort to try to translate that into the impact on unemployment levels is a useful step forward in the debate. By Robert Gordon, Professor in the Social Sciences and Professor of Economics at Northwestern University. Cross posted from VoxEU The US is missing millions of jobs. This column argues that the total is 10.4 million. It claims that 3 million of these can be traced to the weakened bargaining position of labour and the growing assertiveness of management in slashing costs to maintain share prices. Moreover, this employment gap is not shrinking because of the 'double hangover' effect—an excess housing supply and besieged consumers unwilling to spend. High and persistent unemployment in the US has emerged as one of the most important macroeconomic legacies of the 2007-09 world economic crisis. While the decline of business activity in the US was no larger than in Europe, the US is an outlier in its outsized response of the unemployment rate to its decline of output (IMF 2011). Here we quantify the shortfall of US employment – some 10.4 million missing jobs – and ask: Why did the number of jobs decline so much and why has it recovered so little? Two sets of causes stand out.
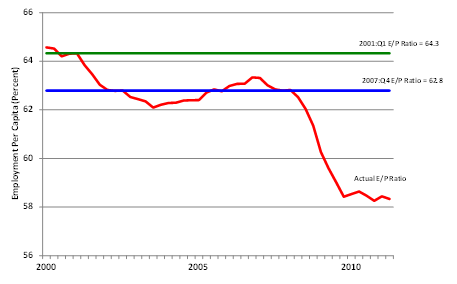
By explaining why the recovery of aggregate demand has been so weak, we provide an understanding of the refusal of the large negative output gap to shrink – a refusal shared by its twin, the employment gap. Dimensions of the job shortfall: 10.4 million missing jobs in the recovery Part of the job shortfall is reflected in the rise of measured unemployment. The rest comes from a decline in labour-force participation. The employment-population ratio (hereafter E/P) measure combines the two.1 As shown in Figure 1, the ratio (as shown by the green line) was 64.3% at the NBER business-cycle peak in 2001:Q1. By the next peak (2007:Q4) it had fallen to 62.8% (blue line).
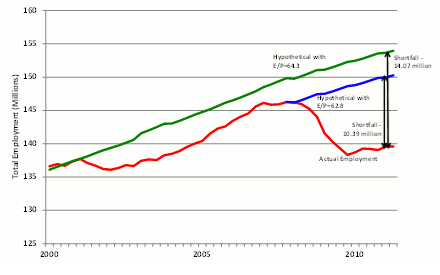
How many jobs are lacking? Figure 2 shows that the shortfall amounts to 10.4 million missing jobs compared to the 2007 version of normality and a much higher 14.1 million missing jobs compared to the 2001 definition. In the rest of this analysis, we take the less ambitious 2007 value for the ratio of 62.8% as the relevant benchmark.
Figure 2. Actual vs hypothetical employment, 2000:Q1-2011:Q2 What caused the destruction of 10.4 million jobs? The first explanation is the change in managerial power. For decades I have been tracking the responsiveness of labour-market variables to the output gap (see most recently Gordon, 2003, 2010).
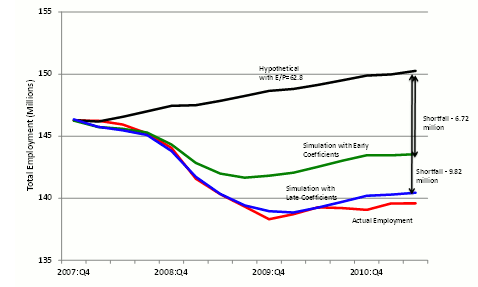
The observed ratios in the data for 1954-86 are roughly consistent with the predictions made by Arthur Okun (1962) in what soon became christened as "Okun's Law." After the mid-1980s, however, these responses changed in a process I have described as the "Demise of Okun's Law." The response of the ratio jumped from 0.45 in the 1954-86 interval to 0.78 in an otherwise identical regression equation applied to 1986-2011. This means that when output slumps, employment drops much more than it would have done previously. The "disposable worker hypothesis" When the economy begins to sink – like the Titanic after the iceberg struck – firms begin to cut costs any way they can; tossing employees overboard is the most direct way. For every worker tossed overboard in a sinking economy prior to 1986, about 1.5 are now tossed overboard. Why are firms so much more aggressive in cutting employment costs? My "disposable worker hypothesis" (Gordon, 2010) attributes this shift of behaviour to a complementary set of factors that amount to "workers are weak and management is strong." The weakened bargaining position of workers is explained by the same set of four factors that underlie higher inequality among the bottom 90% of the American income distribution since the 1970s – weaker unions, a lower real minimum wage, competition from imports, and competition from low-skilled immigrants. But the rise of inequality also has boosted the income share of the top 1% relative to the rest of the top 10%. In the 1990s corporate management values shifted toward more emphasis on shareholder value and executive compensation, with less importance placed on the welfare of workers, and a key driver of this change in attitudes was the sharply higher role of stock options in executive compensation. When stock market values plunged by 50% in 2000-02, corporate managers, seeing their compensation collapse with profits and the stock market, turned with all guns blazing to every type of costs, laying off employees in unprecedented numbers. This hypothesis was validated by Steven Oliner, Daniel Sichel, and Kevin Stiroh (2007), who showed using cross-sectional data that industries experiencing the steepest declines in profits in 2000-02 had the largest declines in employment and largest increases in productivity. Why was employment cut by so much in 2008-09? Again, as in 2000-02, profits collapsed and the stock market fell by half. Beyond that was the psychological trauma of the crisis; fear was evident in risk spreads on junk bonds, and the market for many types of securities dried up. Firms naturally feared for their own survival and tossed many workers overboard. 3 million missing jobs due to altered management response to recession Figure 3 provides the results of a simple experiment regarding the loss of jobs.
Given the decline in the output gap, simulated employment fell short by 9.82 million with the "late" dynamic adjustment behaviour, quite close to the 10.39 million actual shortfall. Yet with the "early" coefficients employment fell by a substantial but significantly smaller total of 6.72 million. Figure 3. Actual vs hypothetical and dynamic simulation employment, 2007:Q4-2011:Q2 Thus labour's weakened bargaining situation with changes in management behaviour toward greater emphasis on cost-cutting in recessions accounts for roughly 3 million lost jobs in the current jobless recovery. The other 6.72 million would have been lost even with the earlier responses because the output gap was so large. Why is aggregate demand so weak? The 'double hangover' explanation This explains the outsized job cuts that came in response to the recession. But we are still left with the question of explaining why the output gap is still so negative 2 years after the NBER business-cycle trough (June 2009). America's double hangover goes back to the consumption binge that accompanied the 2000-06 housing bubble.
Households could use not only their own income to buy consumer goods and services but could finance expenditures in excess of income through second mortgages and refinancing that allowed them to drain cash from their appreciating residences. Once the bubble burst and house prices began to tumble, the 'double hangover' began.
This led to a glut of unsold houses and condos that put continuous downward pressure on home prices. Foreclosures added to the glut; each foreclosure raises the supply of vacant housing units by one unit while increasing the demand for housing units by zero, because the foreclosed family has by definition defaulted on its mortgage and cannot obtain credit for several years into the future. Many homeowners avoided foreclosure but were "underwater," with houses now worth less than the face value of the mortgage and thus faced the hapless choice of draining resources to pay the mortgages or defaulting, with the consequence of a ruined credit rating. Just as hangovers have negative impacts on family members and job performance, so the double hangover of the slump in residential housing investment and in personal consumption expenditures has spilled over to other components of GDP. Nonresidential investment was hit as firms supplying consumers and home builders reduced their need for new computers, machinery, factories, office buildings, and hotels. State and local governments, by law required to balance their current budgets, began to lay off school teachers and other employees. Dissecting the shortfall of aggregate demand We now turn to the "shortfall" of each component of aggregate demand.
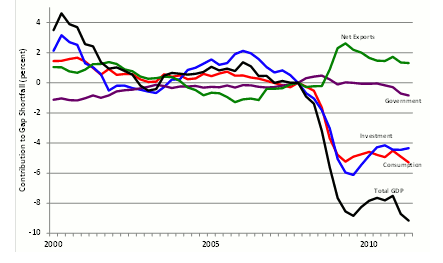
Figure 4 illustrates the gap shortfall relative to normal for total GDP and its four major spending components. The total gap shortfall is shown by the black line and is divided into the shortfall of consumption (red), investment (blue), government spending (purple), and net exports (green).
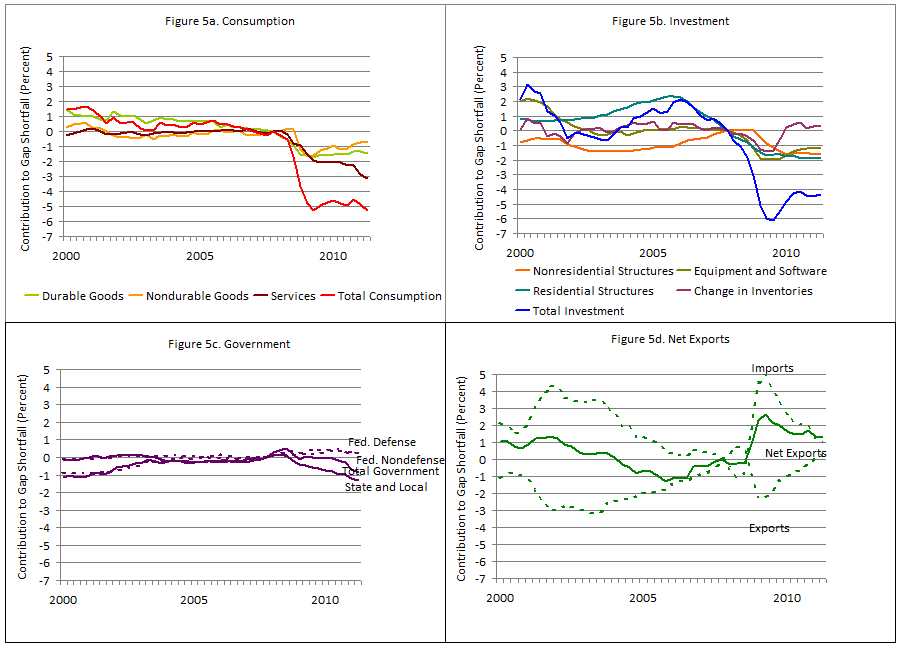
Notice that in 2000 and again in 2005-07 the total gap was positive rather than negative, and this was mainly attributable to a positive gap for equipment investment in 2000 and housing investment in 2005-07. Four graphs in the addendum (see Figures 5a-5d below) show the subcomponents of the four main types of spending. The surprising result that by far the biggest part of the consumption shortfall is provided by services, which has more than twice the shortfall of durable goods. Over the past two quarters the consumer-services shortfall has become even larger. The services and durables gaps were positive for the entire period between 2000 and 2006, indicating that easy credit and cash-out refinancing were used for consumer services, not just to finance consumer durables. Figure 4. Components of gap shortfall, 2000:Q1-2011:Q2
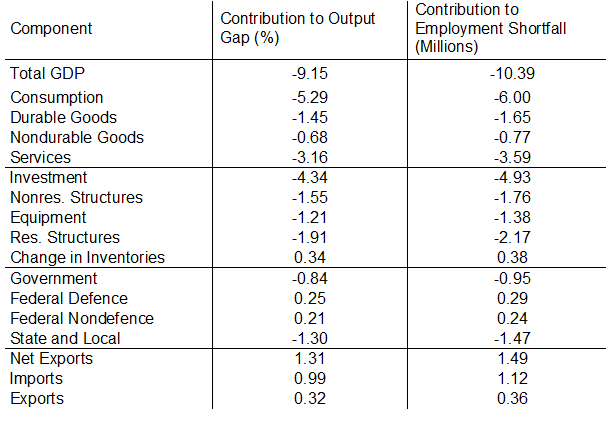
In contrast to the overall consumption shortfall – which continues to be as negative as in early 2009 – the total investment shortfall is somewhat smaller now. Surprisingly the current shortfall for nonresidential construction is almost as large as for residential construction. This occurs because much of the collapse of residential construction had already occurred between 2006:Q1 and 2007:Q4. Figure 5c (below) decomposes government spending into state and local government spending, federal military, and federal nonmilitary spending on goods and services. Transfer payments, including unemployment compensation and social security payments, are by definition excluded from GDP. Total government spending's contribution to the output gap was positive in 2008, neutral in 2009, and has become increasingly negative (i.e., contributing to the overall shortfall in total GDP) since early 2010. The small positive contribution of the two federal government components has been more than cancelled by declining state and local spending. Net exports (Figure 5d below) have helped to offset the shortfall in the other spending components. In 2011:Q2 exports returned to the same ratio of potential GDP as in 2007:Q4, i.e., the total of real exports in the past 3.5 years has grown as much as potential real GDP (that is, by 9%). Imports, which are a subtraction from real GDP, have not recovered to their ratio to natural real GDP and thus have prevented the total output gap from being larger than it is. Without the contribution of the decreased level of imports, the total output gap would have been -10.2 instead of -9.2%. Table 1 lists the major components of spending and the subcomponents and displays the percentage shortfalls already displayed in Figures 4 and 5. Then we use the shares of each subcomponent in the total output shortfall to calculate the jobs shortfall for each subcomponent. Notice that this method treats all components of spending as equally labour-intensive, an acceptable approximation for this exercise. It includes in the jobs shortfall attributable to, say, residential structures, not just the construction jobs in the residential industry but all the jobs involved in raw materials and intermediate inputs to that industry, including lost jobs in providing lumber, nails, tools and equipment, heating and cooling equipment, built-in appliances, and more.
The overall simulated job shortage would have been 11.88 million but for the helpful performance of net exports. It's positive contribution brings the figure to a smaller but still unfortunate 10.39 million. Table 1. Contribution of GDP components to output gap and employment shortfall, 2011:Q2
Conclusion A change in labour market dynamics accounts for about 3 million of the over 10 million missing jobs in mid-2011. This shift can be traced to weakness of labour and growing assertiveness of management. But even with the labour-market institutions of 1955 through 1985, the weakness of aggregate demand in the recession and recovery would have cost roughly 7 million jobs instead of the 10 million jobs that are actually missing compared to normal economic conditions such as occurred in 2007. The recession itself is usually and correctly traced to the collapse of the housing bubble and the post-Lehman financial panic. But the recovery has been unusually weak, completely unlike the economy's rapid bounce-back in 1983-84, and this requires an explanation as well. The best place to start is the double hangover approach, which explains not just the collapse of residential structures investment but also the continued and growing weakness in consumer spending. Perhaps the most surprising result of this essay is that the spending component responsible for the largest share of the missing jobs is not residential investment but consumer spending on services. This is not the place to talk about remedies. The spending decomposition shows that fiscal policy has failed in that the government spending sector has made the output gap shortfall worse, not better. The double hangover theory helps to explain why monetary policy is impotent, no matter how much "Quantitative Easing" is attempted. Authors including Hall (2011) focus on the zero lower bound as the crux of the Fed's problem and ignore the complementary problem of low interest-insensitivity of consumers who are trying to pay off old debt instead of taking on new debt. The failure of consumer and investment spending to respond to an ever-lower 10-year government bond rate, which fell below 2.3% this past week, demonstrates that the problem is an "IS" curve that is very steep if not vertical at an output level far below that necessary to generate a normal level of employment. The vertical IS curve is just as relevant for understanding today's economy as that of the 1930s, and it plays an essential role in the twelfth edition of my macro textbook (2012) in explaining why monetary policy may at times be impotent, just as it did in the first edition more than three decades ago. Addendum: Details on the aggregate demand shortfall (click to enlarge)
| |||||||||||||||||||||||||||||||||||||
| Gold And Silver Price Drop; Retail Sales Soar Posted: 27 Aug 2011 12:12 PM PDT | |||||||||||||||||||||||||||||||||||||
| Posted: 27 Aug 2011 08:08 AM PDT After the panic of a couple of days ago, gold has recovered nicely. As I was telling you, waterfall moves are the time to buy in a bull market. Spike moves are the time to sell, even in a bull market. I think the odds favor a correction before $2000-$2100, but this was a nice trade for people with the discipline to buy. It takes discipline to sell when everyone is euphoric and it takes discipline to buy when everyone says the world is ending. The best traders do both consistently. Gold equities remain extremely cheap and they are screaming buys on corrections. If gold stocks go down 20%, I buy. If they go down another 20%, I celebrate, then buy some more. This debt crisis was a long time in the making and the repercussions will therefore be very serious. I'm so confident in this trade because I'm not trading against facts, I'm trading against human nature, self-imposed delusion, and government stupidity. Human nature is a constant. Government stupidity cycles, and we are in a clear bull market in government stupidity. These are the kind of trades that don't come around often. Even gold bugs are not believers, if this makes sense. These are the type of people that can see gold rise to $1000, but that's it. Then $1200. Then $1500. Then $1800. At every point they were more bullish than the masses, yet they were dead wrong. They were not bullish enough. They did not grasp the full extent of the debt crisis. For everyone who truly understands what lies ahead, I'm telling you that without a doubt the best thing that can happen right now is a monster correction. This is something I'm expecting. I expect a period of calm in markets where everyone thinks the worst is behind us. This is when you should be getting aggressive. Like a pendulum, gold will be building energy for the upside on any correction. Source: Is the Gold Correction Over?
| |||||||||||||||||||||||||||||||||||||
| How To Get a Second Chance to Buy Gold at $1,700 Posted: 27 Aug 2011 07:42 AM PDT Did you miss out on buying Gold when it was at $1,700? In this article, we will describe a way to get a second chance to Buy Gold at $1,700! Let's assume you would have to pay the "worst-case"-price (the ask price), being $5.40. With the collected premium of $11, you would be able to buy 2 call-options. You would pay $5.40x100x2=$1,080 for the RIGHT to buy 200 shares of SGOL on December 17th at a price of $200 per share. If gold would trade at $2,500 by December 17th 2011, that would be about $250 per share of SGOL, the Premium of those call-options would be worth $50 (that is, the Share price of $250 minus the strike price of $200). Because you have 2 call-options, the total value would be 2x100x50= $10,000. If you have any questions, feel free to contact us at info@profitimes.com
| |||||||||||||||||||||||||||||||||||||
| Interview with Meadow Bay Gold 8/26 Posted: 27 Aug 2011 05:59 AM PDT Here is out interview with sponsor company, Meadow Bay Gold. This company acquired the past producing Atlanta mine in Nevada and is working update, verify and expand the resource before pushing towards production.
| |||||||||||||||||||||||||||||||||||||
| TheDailyGoldPodcast with Jeb Handwerger 8/26 Posted: 27 Aug 2011 05:56 AM PDT | |||||||||||||||||||||||||||||||||||||
| COT Report, Perth Mint, My poker game Posted: 27 Aug 2011 05:08 AM PDT Hope everyone is having a fabulous weekend thus far as its bright and sunny here. One of those perfect weather lower humidity weekends that suit my lifestyle. I would like to go straight into the COT report as its it seems that the criminal minds that want to keep a lid on this silver game have conspired, yet again, and this is why we saw the massive sell offs in both metals. GOLD COT: Commercials: ADDED 14,588 Long, and COVERED 3823 This is bullish. SILVER COT: Commercials: reduced longs by 274, and ADDED 6144 SHORT. If you are thinking "You have to be kidding me.." you are not alone. I am assuming the majority of these were covered on the $44-39 move as this is from Tuesday. Not too sure what to think of this, I think they have covered most of it on the downside volatility that they manufactured themselves. If they haven't covered them yet, we should see lemons being squeezed into fresh juice within 3 weeks. I wrote a warning about the Perth Mint being ransacked yesterday. I have now two confirmations from very large distributors, and one mint, that have heard the same thing. Let me clarify what this is. First, all NEW orders FROM dealers that want 1 oz silver coins from the PMint has BEEN SPOKEN FOR BY A SOVEREIGN CHINESE SOMETHING. Company's like APMEX etc. may already have orders in to get them, by any NEW orders they request have been spoken for, so we hear. So you can still get the 2012 coins, albeit they will disappear in the first day, and that may be the end to that distribution. Now, is this the Perth Mint just trying to create more sales? I am not 100% sure on this yet, but as usual, I always inform my loyal readers of any insider news I receive. My poker game last night, with the exception of one degenerate gambler who is for sure 500K in the whole and needs serious help, was a blast. I always try to test out the public's waters once to test the 'bubble' theory of precious metals. These players that I am surrounded by have money and perceive them to be in the 'know' about our current situation. This is the polar opposite of reality. I bought in for a tube of Maples. Everyone said, "what is that?" I said its money. They said, "no no buying in with car keys and bullshit, bring out the wallets." So I gladly took my maples back (knowing full well this idea would be dismissed) and gave them fresh crisp paper linen with various worthless denominations. So much for the bubble. Long live Silver.  | |||||||||||||||||||||||||||||||||||||
| Gold Coins: The Mystery of the Double Eagle Posted: 26 Aug 2011 11:33 PM PDT  How did a Philadelphia family get hold of $40 million in gold coins, and why has the Secret Service been chasing them for 70 years? The most valuable coin in the world sits in the lobby of the Federal Reserve Bank of New York in lower Manhattan. It's Exhibit 18E, secured in a bulletproof glass case with an alarm system and an armed guard nearby. The 1933 Double Eagle, considered one of the rarest and most beautiful coins in America, has a face value of $20—and a market value of $7.6 million. It was among the last batch of gold coins ever minted by the U.S. government. The coins were never issued; most of the nearly 500,000 cast were melted down to bullion in 1937. | |||||||||||||||||||||||||||||||||||||
| "Brief History of the Gold Standard in the United States" Posted: 26 Aug 2011 11:33 PM PDT  Here's a piece that was published by the Congressional Research Service that's worth your time. I'll let GATA's Chris Powell do the rest of the introduction...and he provides the link as well. The introduction that Chris provides, is just as important as the document itself...and the link to both is here. |
| You are subscribed to email updates from Gold World News Flash 2 To stop receiving these emails, you may unsubscribe now. | Email delivery powered by Google |
| Google Inc., 20 West Kinzie, Chicago IL USA 60610 | |

No comments:
Post a Comment