


Gold World News Flash |

- International Forecaster March 2011 (#6) - Gold, Silver, Economy + More
- Look who's calling Utah and gold 'eccentric'
- First signs of a parabolic spike for silver
- Salivating at the Upside Potential of the Gold Market
- Dirty Old Tricks
- Making Money on Miners, Part III
- Best Coins to Buy in 2011
- Gold Seeker Weekly Wrap-Up: Gold and Silver Gain Almost 1% and 6% on the Week
- COT Silver Report – March 25, 2011
- DRC cashes in as gold smuggling plot smashed
- Bull run for gold may be nearing its end – China Central Bank
- US Currency in Circulation & US Gold Reserves: Part 2 of 3
- Graham Summers’ Free Weekly Market Forecast (the Fed is Terrified Edition)
- Latest Fukushima Headlines
- Euro and Sterling Vs The Dollar!
- “One man, who is most assuredly not an SEIU member is finance pundit Max Keiser. Keiser has been leading a campaign named “Crash JP Morgan Buy Silver,” which aims at encouraging people worldwide to buy physically delivered silver to put JP Morgan ou
- Got Gold Report - Gold, Silver Test New Highs
- MARCH 2011 – MAJOR MARKETS (DOW, S&P, GOLD, OIL) Analysis
- The Contrarian View 28th March-1st April
- 1999 Or 2008 All Over Again?
- 3 Top Performing Small Cap Gold Stocks
- Guest Post: What If "What Everyone Knows To Be True" Is Wrong?
- Money & Markets - Week of 3.27.11
- Gold and Silver Rally Lacks Momentum
- Rickards' first question to Bernanke would be about gold
- Solution to the U.S. Budget Crisis: Keeping the State's Money in the State
- Japan evacuating now! Nuclear meltdown! Tokyo Evacuation! Japan meltdown (doesn’t this guy know that James Surowiecki and The New Yorker magazine welcome this opportunity for ‘creative destruction’)
- 3 Gold Miners Set to Profit Big From Gold Above $1375
- Silver Pairs Trade Delivering as Planned: More Room to Run?
| International Forecaster March 2011 (#6) - Gold, Silver, Economy + More Posted: 27 Mar 2011 06:09 PM PDT The US dollar continues under acute pressure, as the world seeks an alternative reserve currency. The days and years of manipulation, fraud and criminal behavior are fast coming to an end. New alliances are evolving, as are outspoken advocates of a new world reserve currency. As a result more and more foreigners are bypassing Treasury and Agency bonds, as well as other US dollar denominated investments. We watch as other major nations accumulate gold and cannot help but think that the new world reserve currency will be gold backed.
|
| Look who's calling Utah and gold 'eccentric' Posted: 27 Mar 2011 06:07 PM PDT There's revolution and war in the Middle East and Africa, devastation and nuclear contamination in Japan, and turmoil throughout the world financial system, but the Financial Times always has time to try to make fun of gold and those who see any virtue in it.
|
| First signs of a parabolic spike for silver Posted: 27 Mar 2011 06:03 PM PDT Any investor in silver must have found the past six months pretty exciting. This precious metal has more than doubled in that time. The pessimists see a high flying price heading for a fall, and they did so last autumn before this take-off.
|
| Salivating at the Upside Potential of the Gold Market Posted: 27 Mar 2011 06:02 PM PDT Not long ago, as I recall, a pension fund in some foreign country, one of those Scandinavian ones I think, was ordered to invest no more than about 3% of its custody assets in gold, meaning that the fund had too much gold, and to sell part of its gold holdings in order to comply.
|
| Posted: 27 Mar 2011 04:30 PM PDT [U]www.preciousmetalstockreview.com March 26, 2011[/U] All in all it was a great week. Markets rebounded nicely and shrugged off higher oil prices and put in very good performances. Bottoms seem to be in, in nearly every market I watch, Egypt’s being one exception but after being closed for so long it did hold up very well in my view. The bag of dirty old tricks was pulled out late in the week though in regards to silver, as the CME raised margin rates on futures. That exact moment has marked short-term tops in silver and gold every single time in the last six months. It appears that is the case once again. But these are just that. Short-term tops. Gold and silver are likely to feel some more pressure but it will be very short lived. I suggest you look for technical levels which have held during short-term corrections in the recent past and look at those as buy areas. Still, the Japanese situation is not under control...
|
| Making Money on Miners, Part III Posted: 27 Mar 2011 04:17 PM PDT By Jeff Nielson, Bullion Bulls Canada In Part I of this series, I outlined the seven stages of development which characterize the evolution of almost every mine, and then described the preliminary exploration which occurs with a mining project. In Part II, I discussed the drilling-phase of development, and how to evaluate whether a property is being developed in an efficient (and potentially lucrative) manner or whether management has fallen into the "dilution trap". Resource Estimate: We are now ready to move on to the third major phase of mine-development: calculating a resource estimate of the ore deposit which the miner has been drilling. While this may seem like a very straightforward stage in the evolution of a mine, there is certainly the potential for "surprises" here – and also opportunities for the astute investor who takes the time to do his/her homework. At some point during the extensive drilling necessary to identify a potential, commercial ore deposit a mining company will make the decision to prepare a resource estimate of the mineralization contained in the ore being drilled. As I hinted at in my previous commentary, there are many factors which go into the decision of when is the appropriate time to engage in such an assessment. Generally, a mining company will not engage in the time/effort/expense of commissioning such a study until they are reasonably sure they have uncovered a sufficient body of ore so that a completed resource estimate will show a deposit with sufficient profit-potential to justify (at least) an economic assessment. They then hope that the economic assessment will conclude that the body of ore is large enough, and the grades good enough so that it is commercially viable to construct and operate a mine. Occasionally, however, a miner will engage in a preliminary resource estimate as merely a stepping-stone in the drilling process. In other words, as I explained in Part II, when a miner is engaged in extensive drilling, this generally requires several infusions of cash to pay for this capital-intensive activity. To avoid the "dilution trap" I warned about, it's important that a miner be able to do each new financing at a significantly higher share price, otherwise the equity financings used to raise this cash result in too much dilution – and shareholders will be unlikely to reap much of a return by holding such companies over the longer term. Thus sometimes a miner will conclude that doing a small, preliminary resource estimate is the best way to raise more capital at an attractive price. This is not a decision to be made lightly. Not only is there significant time and expense involved in calculating a resource estimate, but it requires a considerable amount of "in-fill drilling" to connect-the-dots with the previous drilling holes – in order to provide enough data for the scientific calculations which go into such an estimate. This in-fill drilling is not considered "newsworthy", since it is only adding to data which has previously been released. As a result, unlike exploratory drilling where a news release of the results can (and often does) cause a "pop" in the share price, in-fill drilling generates no news, and thus no additional appreciation in the share price. Indeed, since most activity on a project will usually be put on hold (pending the results), the time spent in preparing these estimates tends to be one of those uncomfortable lulls in the evolution of a junior miner. Often this period will mark some erosion in the share price, as short-term oriented investors and traders will pull out in impatience. However, for true long-term investors, the short wait required for this report to be assembled is justified by the concrete information yielded on the size of the mineral deposit. More articles from Bullion Bulls Canada….
|
| Posted: 27 Mar 2011 04:08 PM PDT The best coins to buy in 2011 will depend on if you are a collector of this art form or looking to make a return on your investment.
For those into Coin Collecting the US Mint has already releases the 2011 proof sets for the year. This is the Silver Proofs that include the 5 different quarters that are being released this year from the America the Beautiful collection. There are also 4 Presidential $1 collection, 1 Native American $1 coin, 1 Kennedy Half Dollar, 1 Jefferson Nickel and One Lincoln Penny included in this set. The asking price form the US Mint is currently at $67.95.
The current price of gold closed in New York on March 24 2011 at $1438.80. This is up nearly $50 in the past 2 months. Those riding the gold boom are still on their way up. This will continue as long as the world's economies continue to faultier.
Gold has always been the safe haven for investors when the markets are in turbulent times. This should last the remainder of the year. If you have invested in gold coins as an investment, it is time to consider cashing in on your investment before the price drops and the values of your investment diminishes. It might be too soon now, but you need to keep it in mind as the year progresses.
The 2010 American Buffalo one ounce Gold Proof coin is currently listed at the US Mint as selling for $1,710. The Chinese 1 ounce Gold Panda coin for 2011 is currently being sold for $1510.10 if purchased in a bulk set of 10. These are 0.999 pure gold coins.
These are some of the best coins to buy in 2011. It all depends on the reason you are purchasing the coins.
For additional resources on coins, please see Best Coins to Buy 2011. This site and all of its contributors strive to bring you the most accurate information available. If you have any comments to help us improve out site, please leave them. Thank you for visiting.
|
| Gold Seeker Weekly Wrap-Up: Gold and Silver Gain Almost 1% and 6% on the Week Posted: 27 Mar 2011 04:07 PM PDT Gold fell $10.60 to $1424.10 in after hours access trade yesterday before it rebounded in Asia and London and saw a $3.14 gain at $1437.84 at about 7:30AM EST, but it then fell back off sharply in late New York trade and ended with a loss of 0.59%. Silver dropped to $36.82 in after hours access trade yesterday before it rebounded to $37.775 at about 8AM EST, but it also fell back off in late trade and ended with a loss of 1.04%.
|
| COT Silver Report – March 25, 2011 Posted: 27 Mar 2011 04:07 PM PDT |
| DRC cashes in as gold smuggling plot smashed Posted: 27 Mar 2011 04:06 PM PDT Authorities in the Democratic Republic of Congo (DRC) have freed five after a $3 million fine paid and gold and cash confiscated in a plot to smuggle gold to Nigeria from the conflict-ridden east of the country.
|
| Bull run for gold may be nearing its end – China Central Bank Posted: 27 Mar 2011 04:06 PM PDT Western recovery will continue, but loose monetary policies will push commodity prices higher, while downside risk on gold is seen by China's Central Bank.
|
| US Currency in Circulation & US Gold Reserves: Part 2 of 3 Posted: 27 Mar 2011 03:59 PM PDT Mark J. Lundeen [EMAIL="Mlundeen2@Comcast.net"]Mlundeen2@Comcast.net[/EMAIL] 25 March 2010 I have an important announcement to make. In Barron's 21 March 2011 issue, the Federal Reserve announced that for the first time in history, the sum total of all US paper dollars and base-metal coins in circulation (CinC) has exceeded $1 trillion dollars. For a proper perspective of exactly what this means, CinC in January, 1920 was only 4.48 billion dollars. Ninety years ago, two silver quarters could buy a pork-chop supper for a family of 4 with vegetables & potatoes, according to my father. Do you think I'm kidding? Next time an old movie from the depression era is shown on Turner Classic Movies, check the prices for meals posted on the walls of diners. A dollar, spent frugally could buy a meal for two, and still leave a nice $0.10 tip. So, you see these trillion dollars didn't pop into existence overnight, and that's why I cringe every time I hear someone in the me...
|
| Graham Summers’ Free Weekly Market Forecast (the Fed is Terrified Edition) Posted: 27 Mar 2011 03:19 PM PDT Graham Summers' Free Weekly Market Forecast (the Fed is Terrified Edition)
This is the most important chart related to the financial system today:
This is a chart of the US monetary base. In simple terms, it charts how much money the Fed has pumped into the system (at least that it admits). So it's a kind of visual of the Fed hitting the PANIC button: when the monetary base explodes higher, the Fed is FREAKING out.
This is the 31-year weekly chart of the 30-Year Treasury. As you can see, since 1988, the 30-Year has respected the above trendline. Every time we touched up against it, the 30-Year bounced hard and continued its long-term bull market. The last time we nearly took out this line? The very beginning of 2011:
Remember, the interest-rate based derivatives market in the US is $196 TRILLION. If the Fed lets interest rates get out of hand, then the entire system breaks down even worse than it did in 2008: 2008's crisis was triggered by the credit defaults swap market which was just $50-60 trillion in size (less than 1/3 of the interest rate based derivatives market). Small wonder the Fed is going nuts pumping $500 billion into the system in the last three months alone. After all, once the Fed loses control of interest rates (and it will) we're going to see a market 4-5X bigger than the credit default swap market implode. On that note, if you're looking for a means of profiting from the coming market collapse, few investors on the planet match my ability to make money during Crises. Case in point, I had my clients move to cash three weeks before the 2008 Crash hit. And my Crisis Trades produced triple digit gains in the October-November '08 disaster, while everyone else lost their shirts. We've since used my Crisis Trades to produce gains of 10%, 13%, 13%, 14%, 16%, 18% and 19% during the Euro Crisis back in May 2010. In fact, during stocks' initial collapse from mid-May to early July 2010, these trades resulted in the Private Wealth Advisory Crisis Portfolio outperforming the S&P 500 by a WHOPPING 15%. To find out what our Crisis Trades are (including their names and symbols) and start taking action to prepare for what could potentially be an even BIGGER debacle than the 2008 ones, all you need to do is take out a "trial" subscription to my Private Wealth Advisory newsletter. To do so… Good Investing! Graham Summers
|
| Posted: 27 Mar 2011 03:09 PM PDT
The latest in the tragic story that just gets weirder by the minute.
And our personal favorite:
As this whole farce has gone beyond the surreal, we are now actively waiting for a cartoon Mr. Burns to show up at any ongoing press conference and announce that Springfield Nuclear Power Plant has LBOed Fukushima with Discount Window financing, at a #Ref! EV/EBITDA considering 9501.JP will not see any positive cash flow for millennia, and is appointing Mr. Sparkle (aka Homer Simpson) chief safety inspector.
Source: Kyodo
|
| Euro and Sterling Vs The Dollar! Posted: 27 Mar 2011 02:33 PM PDT Currencies such as the Euro and the Sterling are hitting at near last years highs vs the dollar so do we extend the up run or reverse right about now? Read More...
|
| Posted: 27 Mar 2011 01:27 PM PDT Economic Terrorists: That’s You Share this:
|
| Got Gold Report - Gold, Silver Test New Highs Posted: 27 Mar 2011 11:27 AM PDT Liquidity is again flowing into oil, gold, silver and other commodities as the Big Markets bounce back. This, despite or perhaps due to unsettling geopolitical uncertainty in Northern Africa and renewed focus on European budgetary and fiscal misery. Now we see rioting in the U.K., of all places. We don't want to sound incendiary, but isn't that where much of the world's precious metals are stored? You know, because it is "stable" there? Just a question.
|
| MARCH 2011 – MAJOR MARKETS (DOW, S&P, GOLD, OIL) Analysis Posted: 27 Mar 2011 09:45 AM PDT
DOW We had both Long and Short levels charted out, but none of them were set up. Daily chart shows that the price broke below 50SMA on 10 March 2011, but since then it has reversed and is now above both 50SMA and 20SMA. It is still within long-term bullish channel. Weekly chart showed a lot cleaner price action, after bouncing off 200SMA on weekly chart (as noticed in January newsletter), it created a doji type of candle (commonly called pin bar) and then continued the uptrend. Looking back at it, although I had weekly 20SMA as buying level, but I did not update my levels based on the movement of 20SMA. Next resistance is at 12500, after which any pullback should be bought with confirmation of bullish candles. Aggressive traders may look for counter trend short opportunities around that level. Alternatively, if the weakness continues, then look for buying opportunities around the support cluster between 11000 and 11450 which also coincides with 200SMA support, demand line for the bullish channel, 50% fib support zone for the rally between 9925 and 12400, and previous support based on price patterns (see chart below). If you get this much confluence confirmed by a bullish candle around this zone, you just have to BUY THAT DIP with stops and appropriate risk management.
AAII bullish sentiment index has also come off its highs (see chart below), further highlighting that perhaps a mid term top is not in place yet.
GOLD This one was a bit risky, but according to buy zone charted in January 2011 analysis, there is strong support between 1227 and 1269 extending upto 1300 round number figure. A long was triggered at 1337 after a reversal candle printed just before 1300 on 28 January 2011. Upswing from 682 to 1227 carves out a Fibonacci extension up to 1435 as next resistance, therefore my target was 1435. Now the resistance has already come into play, and I am looking for short candles, price carved a reversal candle (doji style) on 21 March 2011, at the break of this candle on the downside; I will place shorts around 1405 with tight stops, as this is an aggressive counter-trend trade. However, the Gold bull story is far from ending - per technical structure. I am only looking for its reversal to the base around 1320 - 1340 region (which could again be a buying zone).
S&P 500 Significant resistance carved out around 1302 and 1350 in January newsletter were played with shorts, and though first opportunity was stopped out, the second opportunity around 21 February 2011 made up for it quite handsomely. Also, the exit from short was based on reversing the position to longs which are still held. Long objective and exit from short around 1350 region were established as price reversed from 50% fib level around 1259 and previous price support level around 1266. Still holding the long with profit locked in as stops moved to the low of 23 March 2011 at 1280. Targeting 1350, which is previous high, before we revaluate the bias.
Bullish view and trade is also supported by VIX as it bounced off its support zone around 15 as expected in January newsletter but is now in relatively neutral zone.
OIL Text book example of previous resistance becoming support was highlighted in January 2011 newsletter establishing a bullish view, the Libyan crisis was obviously not expected through charts, but it helped the fundamental backdrop of Oil’s climb. Before shorts could trigger based on January newsletter, a long trade was entered at previous support levels, which initially was stopped out, but second entry just like S&P was exited in profit at 105 because this level was highlighted earlier for looking for short entries. So, long was closed and a short entry was triggered at 104.40 on 08 March 2011. This short was also exited at reversal at the breaking of reversal candle printed on 16 March 2011. Now looking for shorts again below 104.60, as double top forms, and also RSI also confirms weakness. Perhaps too many trades were taken in Oil. However, due to the volatility the opportunities have been plenty as well.
Model Portfolio
Price Patterns (to watch for levels /zones discussed above) Levels and zones are potential pivot areas – For trade entries, the price patterns / candles around these levels/zones should be observed or pyramid your entries with money management for aggressive trading approaches. BULLISH PATTERNS
DISCLAIMER
Trading in the financial markets is a challenging opportunity where above average returns are available for educated and experienced investors who are willing to take above average risk. However, before deciding to participate in financial markets trading, you should carefully consider your investment objectives, level of experience and risk appetite. Do not trade / invest money you cannot afford to lose. This website/newsletter is neither a solicitation nor an offer to Buy/Sell/Hold. No representation is being made that any account will or is likely to achieve profits or losses similar to those discussed on the website/newsletter. The past performance of any trading system or methodology is not necessarily indicative of future results.
|
| The Contrarian View 28th March-1st April Posted: 27 Mar 2011 09:29 AM PDT
#222222; font-family: Georgia; font-size: 13px; ">So why bother with a contrarian outlook? Click me to get some background on these reports This weeks COT Index Review
S&P 500: Since Mid Feb we have seen a bearish set up in the S&P COT report, this positioning led to a strong bias, in that time the S&P declined around 100 points. This #222222; font-family: Georgia; font-size: 13px; ">week we see a dramatic shift in commercial positioning, the strongest on a weekly basis I have seen in a long while. Commercial positioning has again become bullish, the large trader set up needs to be a lit#222222; font-family: Georgia; font-size: 13px; ">tle weak#222222; font-family: Georgia; font-size: 13px; ">er (below 30) for a full bullish setup overall. (Commercial traders lead this COT report). Bias: Neutral but close to a Bullish set up
EURUSD: The long bias remains strong and firm in the Euro and we are #222222; font-family: Georgia; font-size: 13px; ">not seeing much of a change from last weeks report. (Large traders lead this COT report) Bias: Bullish
GBPUSD: We saw strong selling after last weeks report, the overall set up was neutral last week, but the lead large trader group did show bearish strength, This week we a#222222; font-family: Georgia; font-size: 13px; ">re seeing a strong about turn and are getting close to a bullish set up, again the overall set up is neutral, its not quite hitt#222222; font-family: Georgia; font-size: 13px; ">ing the figures we need for a full on bullish set up. (Large traders lead this COT report) Bias: Neutral
USDJPY: Surprisingly not a big change at all in COT positioning after the Earthquake events, the USDJPY COT remains bearish. (Large traders lead this COT report) Bias: Bearish
GOLD: This weeks COT remains bearish with a similar strength level to last weeks report. We do have the beginnings of a double top in Gold which adds weight to this bearish bias. (Large trader lead this COT report) Bias: Bearish
CRUDE OIL: Still a strong bullish set up in play with crude #222222; font-family: Georgia; font-size: 13px; ">oil that doesn’t seem like it will be leaving us anytime soon. (Large traders lead this COT report) Bias: Bullish FX Retail Trader Position Analysis This report describes a contrarian view on current retail trade#222222; font-family: Georgia; font-size: 13px; ">r positioning in FX #222222; font-family: Georgia; font-size: 13px; ">Click me to get some background on these reports
USDJPY: 74.26% of retail traders remain long USDJPY, maintaining our bearish bias for this pair. Bias: Bearish
EURUSD: With the % of retail traders short the euro decreasing to 60.25% the strength of our bullish bias has receded a little we still remain bullish but this pir is getting closer to the neutral bias zone. Bias: Bullish
GBPUSD: This week as with the COT report our overall bias for the GBPUSD according to the retail positioning report is neutral. Bias: Neutral
|
| Posted: 27 Mar 2011 07:57 AM PDT
On Sunday morning, I watched an interview on CNN's State of the Union with Candy Crowley (see video below or click here to watch or click ). The interview was on the US economy and the guests were two two former directors of the Congressional Budget Office, Alice Rivlin who's now a Brooking's expert, and Doug Holz-Eakin, president of DHE Consulting, LLC.
Let me comment on this exchange. First, as I stated above, given their background and ideological views, it hardly surprises me that Ms. Rivlin and Mr. Holz-Eakin are sounding the alarm on US debt and entitlement spending. But to claim the US might suffer a sovereign debt crisis is simply ridiculous. The US is the largest economy in the world by far, it prints the world's reserve currency and the risk of a US sovereign debt crisis lies somewhere between zero and zero. All the doomsayers will tell you otherwise but that's a fact.
Mr. Holz-Eakin also noted that they see "interest rates start creeping up and then elevate sharply". If that happens, it will kill any recovery in the housing market. But I just don't see rates rising sharply for two reasons. First, the Fed's policy remains reflate and inflate at all costs to avoid a prolonged period of debt deflation. They will continue with quantitative easing (QE) which will cap long-term bond yields. Second, without a robust housing and more importantly jobs recovery, the risks of deflation remain elevated. I simply cannot understand all these doomsayers who see hyperinflation on the horizon. Why? Because oil prices are rising again? Again, if they rise too high, too fast, it's ultimately deflationary for the US and global economy.
Semis, networking stocks and materials have been on fire following the earthquake disaster in Japan. Earnings have been strong but there is a lot of hot money flowing into these sectors too, making them very volatile. It all looks and feels like the reemergence of the tech bubble, a point covered by Jameson Berkow of the Financial Post, Bootup: Experts warn of Internet bubble 2.0:
I would also caution people to avoid chasing stocks that run up too high, too fast. There is a lot of liquidity spurred by hot money, hedge funds and banks engaging in high-frequency trading, mutual fund flows, pension flows, sovereign wealth fund flows, and last but not least, retail investor flows (they're always the last ones to the party and typically get slaughtered). Tread carefully, these markets may appear easy but if you become complacent and ignore risks, you'll get killed. I will however tell you that I feel like we're heading towards another 1999 rather than another 2008. Call it a gut feeling but I look at the stock market every single day, tracking unusual volume and which stocks and sectors are making new highs. I also study the quarterly holdings of top hedge funds and mutual funds. Right now, I see the "Risk On" trade. Will it last? Will it be in tech or so will it be in some new bubble like renewable energy? Who knows? All I know is that the liquidity party will continue on Wall Street for the foreseeable future, which is why I continue to advise people to keep buying the dips.
|
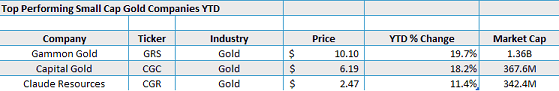
| 3 Top Performing Small Cap Gold Stocks Posted: 27 Mar 2011 07:38 AM PDT Ian Wyatt submits: With gold hitting another historic high recently I thought it would beneficial to see which small cap gold stocks performed the best year-to-date.. Gammon Gold (NYSE: GRS) Gammon Gold posted the best small cap gold stock performance, year-to-date. The company reported Wednesday that its fourth quarter net earnings rose 74 percent, which far surpassed analysts' expectations. For the quarter, the gold and silver producer increased net earnings by $23.5 million, or 17 cents a share. This was up from $13.5 million or 10 cents a share during the same quarter last year. Revenue from mining operations was also higher at $71 million, up 4% from last year. Capital Gold (AMEX: CGC) Capital Gold jumped $0.20 higher to hit a 52-week high on Complete Story »
|
| Guest Post: What If "What Everyone Knows To Be True" Is Wrong? Posted: 27 Mar 2011 06:57 AM PDT
Submitted by Charles Hugh Smith from Of Two Minds When the consensus is confidently weighted on one side of a trade or view, reality has a nasty habit of introducing blowback and/or unintended consequences.
In other words, if the rebuilding and insurance claims will end up costing $300 billion, a significant chunk of that will come from insurers and re-insurers who will have to liquidate globally distributed assets such as stocks and bonds to raise the cash.
|
| Money & Markets - Week of 3.27.11 Posted: 27 Mar 2011 04:00 AM PDT J.P. Morgan Chase, HSBC May Have Gained Billions from Influencing Silver Prices Forbes (25 March 11) G.E.'s Strategies Let It Avoid Taxes Altogether The New York Times (24 March 11) YouTube (27 Jan 11) UK Government May Offload Stake in Lloyds, RBS: Report Reuters (24 March 11) IRS Audit Red Flags: The Dirty Dozen Kiplinger (Dec 10)
|
| Gold and Silver Rally Lacks Momentum Posted: 27 Mar 2011 03:24 AM PDT The precious metals had a great week, so why is the momentum of these moves so lacking in strength? Speculators who can move prices seem not yet to be convinced that gold stocks will continue zooming into ever higher ground. Is there peace in the oil fields or something?
|
| Rickards' first question to Bernanke would be about gold Posted: 27 Mar 2011 03:18 AM PDT 11:18a ET Sunday, March 27, 2011 Dear Friend of GATA and Gold (and Silver): Interviewed for 19 minutes by Eric King of King World News, market analyst James G. Rickards of consulting firm Omnis elaborates on his expectations for what he calls "stealth quantitative easing," whereby the Federal Reserve would announce that QE was over even as it continued buying government bonds using the income from the vast securities portfolio it lately has accumulated. Rickards sees confirmation of this expectation in remarks made Friday by Chicago Fed President Charles Evans: http://www.reuters.com/article/2011/03/25/us-usa-fed-evans-idUSTRE72O43Q... Rickards expects the civil war in Libya, which has cut off that country's oil exports, to put a floor under oil prices. He senses strength in the gold price insofar as it did not retreat much on the disaster in Japan, where people might have been inclined to raise cash by selling gold rather than stocks, which already had fallen. In regard to Fed Chairman Ben Bernanke's plan to hold four press conferences per year to explain the Fed's monetary policy, Rickards says that this will be all propaganda and that, if he attended one of those conferences, "My first question would be: What are you doing in the gold market?" Rickards adds a personal observation about what he sees as China's desperation to get gold. This week probably hasn't provided an interview about economic issues more relevant than this one and you can listen to it at King World News here: http://kingworldnews.com/kingworldnews/Broadcast/Entries/2011/3/27_Jim_R... CHRIS POWELL, Secretary/Treasurer ADVERTISEMENT Sona Drills 85.4g Gold/Ton Over 4 Metres at Elizabeth Gold Deposit, Company Press Release, October 27, 2010 VANCOUVER, British Columbia -- Sona Resources Corp. reports on five drillling holes in the third round of assay results from the recently completed drill program at its 100 percent-owned Elizabeth Gold Deposit Property in the Lillooet Mining District of southern British Columbia. Highlights from the diamond drilling include: -- Hole E10-66 intersected 17.4g gold/ton over 1.54 metres. -- Hole E10-67 intersected 96.4g gold/ton over 2.5 metres, including one assay interval of 383g of gold/ton over 0.5 metres. -- Hole E10-69 intersected 85.4g gold/ton over 4.03 metres, including one assay interval of 230g gold/ton over 1 metre. Four drill holes, E10-66 to E10-69, targeted the southwestern end of the Southwest Vein, and three of the holes have expanded the mineralized zone in that direction. The Southwest Vein gold mineralization has now been intersected over a strike length of 325 metres, with the deepest hole drilled less than 200 metres from surface. "The assay results from the Southwest Zone quartz vein continue to be extremely positive," says John P. Thompson, Sona's president and CEO. "We are expanding the Southwest Vein, and this high-grade gold mineralization remains wide open down dip and along strike to the southwest." For the company's full press release, please visit: http://sonaresources.com/_resources/news/SONA_NR19_2010.pdf Join GATA here: An Evening with Bill Murphy and James Turk https://www.amsterdamgold.eu/gata/index.asp?BiD=12 Or a colorful GATA T-shirt: Or a colorful poster of GATA's full-page ad in The Wall Street Journal on January 31, 2009: http://gata.org/node/wallstreetjournal Or a video disc of GATA's 2005 Gold Rush 21 conference in the Yukon: Help keep GATA going GATA is a civil rights and educational organization based in the United States and tax-exempt under the U.S. Internal Revenue Code. Its e-mail dispatches are free, and you can subscribe at: To contribute to GATA, please visit: http://www.gata.org/node/16 ADVERTISEMENT The Gold Standard Now: It Can Work Today a dollar is worth 80 percent less than it was 40 years ago, and less than 5 percent of its value a hundred years ago. We deserve a dollar that is as good as gold, a dollar that will hold its value from year to year so we can be financially secure and our economy can generate more and better jobs. For most of America's history, our dollar was literally as good as gold. But on August 15, 1971, our politicians destroyed the link between gold and the dollar. They destroyed the foundations of our economic system. A new Internet site, TheGoldStandardNow.org, provides news and cutting-edge analysis about this most important issue and explains how the gold standard worked in the past and how it can work in the future. Visit us today: http://www.thegoldstandardnow.org/about/137-welcome-newsmax
|
| Solution to the U.S. Budget Crisis: Keeping the State's Money in the State Posted: 27 Mar 2011 12:50 AM PDT Cut spending, raise taxes, sell off public assets – these are the unsatisfactory solutions being debated across the nation; but the budget crises now being suffered by nearly all the states did not arise from too much spending or too little taxation. They arose from a credit freeze on Wall Street. In the wake of the 2009 financial market collapse, banks curtailed their lending more sharply than in any year since 1942, driving massive unemployment and causing local tax revenues to plummet.
|
| Posted: 27 Mar 2011 12:28 AM PDT MK: Those who argue that this guy (and 30 mn. other residents) should leave are sadly missing the point. Nuclear holocaust in Japan – like AGW – is adding to the hundreds of thousands (soon to be millions) who are already ‘climate migrants’ thanks to AGW and other corporate schemes to incinerate humans for quick [...]
|
| 3 Gold Miners Set to Profit Big From Gold Above $1375 Posted: 27 Mar 2011 12:02 AM PDT Investment Underground submits: by Gerry Greer Complete Story »
|
| Silver Pairs Trade Delivering as Planned: More Room to Run? Posted: 26 Mar 2011 10:56 PM PDT Dan Pritch submits: This week, I posted about a silver pairs trade strategy to exploit a clear market arbitrage opportunity whereby the premium on a silver closed-end fund had gotten out of hand. In essence, by shorting the physical-back closed-end fund (PSLV) and going long the silver ETF (SLV) at the same time with equivalent funds, you could capture the difference in premium that occurs over time with no net outflows, save for commissions. I thought it would be instructive to revisit the outcome after a short period of time. At the time of posting, the premium on PSLV was approaching 24% and by the end of trading Friday, the premium was a mere 21.3% (Sprott's NAV page). Therefore, one would expect that this strategy would have delivered about an 2.7% return in just a few short days. A quick comparison of the two ETFs overlapped at any charting site like Google Finance Complete Story »
|


| You are subscribed to email updates from Save Your ASSets First To stop receiving these emails, you may unsubscribe now. | Email delivery powered by Google |
| Google Inc., 20 West Kinzie, Chicago IL USA 60610 | |
No comments:
Post a Comment