


Gold World News Flash |

- These Indicators Suggest Stock Markets Have More Upside ? and Gold Some Uncertainty
- Bullion? He Prefers Mining Shares…
- Gold is Free Enterprise Money
- Silver is Approaching Stage Two of its Bull Market
- Gold Seeker Closing Report: Gold Rises and Silver Surges 1.6%
- From Japan: An Interesting Comment On US Economic Planning, the Dollar, and Peak Cheap Oil
- Gold For Valentine’s Day
- Paulson Sells 10% Of BofA Stake, Increases Equity AUM From $23 To $30 Billion, Adds Numerous New Positions
- Why Increasing Bank Credit Can Only End in Catastrophe
- The Six Words That Will Dominate the Financial Markets Going Forward...
- Guest Post: Obama's Budget Banter Omission: The Banks Broke the Bank
- The Six Words That Dominate the Financial Market
- Largest bond fund, Pimco, cuts US government holdings
- A Look at 8 Silver Producers by Cost Per Ounce of Resources
- Gold For Valentine's Day
- Silver Is on the Brink of a Breakout
- If The Gold Price Wants to Turn Up, It Needs to Close Clean Through $1,368, Then March On. Enough of This Fiddling Back and Forth
- Guest Post: Economy Flight 666 - Our One-Way Ticket To Zimbabwe
- It's End Game: Dollar Is Gone, Currency Revaluation..
- Zuma speech raises nationalisation fears
- Viral Bubbleomics: Debt infected Housing infected Oil …Now Gold
- Bernanke’s Undying Love of QE2
- Comex gold at upper end of range ahead of Chinese inflation report
- Gold Daily and Silver Weekly Charts
- Grand Theft USA – Prices Go Parabolic
- Why Silver Backwardation Matters
- Look to History to Profit from Gold
- Brien Lundin: Look to History to Profit from Gold
- BitCoin virtual currency reaches parity with Dollar. Forget the Yuan, Yen, Euro and Real, the Dollar can't even keep up with economic ghosts in virtual machines
- Amarillo Gold Corp: The Scoop from the Field
- China and Russia: 2 Giant BRICs in the Economic Growth Wall
- Things
- The New #2
- “Silver is still in stage one. It won’t advance into stage two until $50 is exceeded, just like gold did not enter stage two until its previous high of $850 was hurdled.”
- Gold prices: Where will they finish 2011?
- James Turk On Silver, and A Possible Twist of My Own
- Gold Positioned for 2011 Run Up
- The Myth of the ‘Primary Silver Mine’
- Gold In A Bubble? And Other Irritations - Like Obama's Budget...
- Viva La Revolution
- Technically Precious with Merv
- For week ending 11 February 2011
- £1,000 Olympic gold coin to become legal tender
- $2100 ‘Sounds Right’ For an Ounce of Gold
- Egypt army says post-Mubarak protests harming economy
- Current Silver Definition Move Not Like the Others
- Revolution in Egypt and Where to Be When Black Swans Appear
- Gold Meanders at 50% Retracement
- I said this last year you conspiracy fucktards! The ‘fake' gold spiked with Tungsten is WORTH MORE!!!
- Exeter Exercises Option and to Acquires Caspiche Gold Copper Project
| These Indicators Suggest Stock Markets Have More Upside ? and Gold Some Uncertainty Posted: 14 Feb 2011 06:40 PM PST A variety of technical analyses all clearly indicate that the S&P 500′s run is by no means over. Here*are some charts and*an analysis of what they mean for the markets, the U.S. dollar and gold.*Words: 1234 So*concludes Dr. Nu Yu**(http://fx5186.wordpress.com/) inthe aboveparaphrased comments*from an article* reformatted*and edited [...] below by Lorimer Wilson, editor of www.munKNEE.com,*for the sake of clarity and brevity to ensure a fast and easy read. Please note that this paragraph must be included in any article re-posting to avoid copyright infringement.*Dr. Yu*goes*on to say:* Breakdown of Treasury Yield Ratio Suggests Significant Changes Coming to Financial Markets The treasury yield ratio is the ratio of a long-term treasury yield to a short-term treasury yield. Although the yield ratio is not plotted exactly the same as the traditional yield curve, it has a similar importance*in that it*gauges changes in rates and maturities*of treasury securities that will impact o...
|
| Bullion? He Prefers Mining Shares… Posted: 14 Feb 2011 06:01 PM PST In a guest commentary here yesterday, our friend Erich Simon used grocery prices from the good old days to buttress his conclusion that $2100 was the "right" price for an ounce of gold. The essay provoked a lively discussion, including the interesting note below from "Radek," who'd rather own bullion shares than the actual metal.
|
| Posted: 14 Feb 2011 05:45 PM PST
|
| Silver is Approaching Stage Two of its Bull Market Posted: 14 Feb 2011 05:05 PM PST FGMR - Free Gold Money Report February 14, 2011 – Back in April 2007, I wrote about the three stages that appear in every bull market, and more to the point, that gold was approaching the end of stage one. Gold back then was still trading around $690, and therefore well below its then record high of $850 reached in January 1980. My view was that “gold looks ready to make a new all-time high. When that happens, stage two begins. There will not yet be widespread excitement about gold in the next stage, because that won't occur until stage three. But when gold makes a new record high, and particularly after it breaks into a 4-digit price, people will begin paying attention.” I wrote a follow-up article in November 2009 entitled Welcome to Stage Two of Gold's Bull Market, just two months after gold broke above $1,000. Focusing on the change in prevailing sentiment, I noted how differently gold was being treated. "During the first stage of a bull market, ...
|
| Gold Seeker Closing Report: Gold Rises and Silver Surges 1.6% Posted: 14 Feb 2011 04:00 PM PST Gold fell $4.15 to $1355.65 in London, but it then climbed to as high as $1366.74 by late morning in New York and closed with a gain of 0.34%. Silver fell $0.17 to $29.88 in Asia before it rose to as high as $30.715 in New York and then fell back off a bit in the last few hours of trade, but it still ended with a gain of 1.6%.
|
| From Japan: An Interesting Comment On US Economic Planning, the Dollar, and Peak Cheap Oil Posted: 14 Feb 2011 02:31 PM PST |
| Posted: 14 Feb 2011 02:22 PM PST www.theablespeculator.com [EMAIL="analyst@theablespeculator.com"]analyst@theablespeculator.com[/EMAIL] DAILY REPORT February 15, 2011 "Be ashamed to die until you have won some victory for humanity." ---Horace Mann (1796 - 1859) Today the White House sent its budget to Congress and it will hit US $1.6 trillion for 2011, well above the previous US $1.3 trillion estimate. The proposed budget deficit for 2012 is US $1.1 trillion. In spite of cutting US $1.5 trillion over the next decade, at no time is the deficit projected to be less than US $655 billion over the next nine years. Don't forget that these are "estimates" and the government is always too low. Now both parties will start to bargain and fight for their respective pork as the deadline to extend the debt ceiling is less than sixty days away. If both parties fail to agree, government would have to shut down operations and that would have a detrimental affect on the US economy. I predict that it will...
|
| Posted: 14 Feb 2011 02:07 PM PST
The much anticipated Paulson & Co. 13F is out and there are quite a few changes. First, the total equity AUM has increased from $23 billion to $30 billion. Paulson is now bigger than many mutual funds: "nimble" unwinding should the market ever sell off again sure will be an amusing sight. After all, his top 10 positions, which amount to $16 billion, represented 55% of his entire equity AUM (of 102 names). While there are not many dispositions, most notable is the decline of Paulson's third biggest holding - Bank of America - by 10% from 137.8 million shares to 123.9 million. Also, as Zero Hedge speculated, Paulson reduced his holdings in Citi modestly, from 424 million shares to 413.5 million (it appears he was selling to Tepper). Otherwise the top two holdings, the GLD for the dollar denomination shares, and Anglogold, are still in first and second place. In terms of notable increases, Paulson added 7.9 million shares to his Anadarko stake (conceived in Q3), bringing the total to 21.3 million, making it his 5th largest position. Rounding out the top 10 are Hartford (a small decline), Suntrust (a 5 million share increase), Comcast (flat), Capital One (3 million shares added) and MGM (flat). Buffett fans will be delighted to learn that Paulson added 5 million shares to his Wells position, making it his 11th largest holding at $635 million. Those curious what other additions are in Paulson's portfolio can do so by looking at the green highlighted rows in the table below (also, the rightmost column shows increases in green and declines in red). As for complete dispositions, here is the list: Hewitt Associates, NBTY, Mariner Energy, Mirant, Burger King, General Growth Properties (Ackman will not be pleased), Airgas, Family Dollar, Starwood, Zymogenetics, Potash, Mead Johnson, Boyd Gaming, and Starwood Property Trust. Full breakdown of holdings as of Dec. 31 (full green row highlight is new position).
|
| Why Increasing Bank Credit Can Only End in Catastrophe Posted: 14 Feb 2011 01:50 PM PST I have to admit that I was stunned that Fed Credit (the magical fairy dust from which money appears out of thin air) went up last week by a huge $19 billion, which the Fed itself used to buy $18.4 billion in government debt. In one week! In One Freaking Week (OFW)!! As Eric Fry, Editorial Director of The Daily Reckoning, puts it, "The effect of this bizarre transaction is that one branch of the government issues debt securities, while another branch of the government purchases those securities"!!! You can tell by my OFW acronym and extreme punctuation that I am still upset about all this new money and all this new debt, even though it is exactly as per the plan laid out by the Federal Reserve, which causes people to ask, "What in the hell is wrong with you, you Big Mogambo Idiot (BMI)? The Fed said that they were going to do it, and now they are doing it! So, why all the OFW crap and all the exclamation points making you look like some kind of raving idiot?" Now, here is obviously a...
|
| The Six Words That Will Dominate the Financial Markets Going Forward... Posted: 14 Feb 2011 01:11 PM PST The Six Words That Will Dominate the Financial Markets Going Forward... THE most important dynamic in the financial world today is that of the monetary policies between China and the US. This relationship can be summated in six words: The US wants inflation, China DOESN'T.de China has now hiked interest rates three times in the last four months. It's also raised reserve requirements at several of its banks. And it is rumored to be planning a 30% real estate market crash. China is a country controlled by a small sliver of rich bureaucrats. They can only remain in power so long as the Chinese economy continues to grow and unemployment is contained. This is why China pumped some $580+ billion (nearly 14% its GDP at the time) into its economy. This policy was further exacerbated by the US Federal Reserve's money printing. All told the Fed has pumped TRILLIONS of Dollars into Wall Street. And Wall Street has done what it does best (aside from paying bonuses): funneled this money into risk assets to generate returns. Which has resulted in Agricultural commodities EXPLODING higher in price:
What you're looking at is a 65% increase in the ENTIRE Agricultural Sector in a little over seven months' time. In the US, where food is so processed it's barely food anymore, this has resulted in significantly higher food prices. However, in emerging market economies (most notably the Middle East, India, and China), where hundreds of millions of people live off $2 per day or even less, the increase in food prices has resulted in outright starvation and riots. This is going to be making things VERY difficult for the Chinese government. Social unrest has already unseated several regimes in the Middle East. And the same formula that created those situations (tons of poor, repressed folks no longer able to afford food) exists today in China as well. With that in mind, expect the relationship between the US and China to deteriorate in the coming months. The flirtation underlying trade tensions (steel and tires) we've already seen will erupt into full-scale trade wars. We could very well even see an actual physical war the way things are heading. With that in mind, now is the time to be preparing for all eventualities. This means buying physical Gold and Silver, stockpiling food and supplies, etc. We will be seeing shortages at some point in the future. And a little preparation now can go a long way towards bettering the future. Each "trial:" subscription to Private Wealth Advisory also comes with a fourth report, The Debt Spiral, which details in nine clear, concise pages exactly how the US debt situation will come unhinged and the single best means of profiting from it. On top of these Special Reports, a subscription to Private Wealth Advisory also comes with 26 bi-weekly issues of my detailed financial investment analysis. Each issue is devoted to outlining the dominant financial and economic trends impacting the financial markets… as well as how to profit from them. Case in point, in the last few months alone, I've shown investors gains of 26% and 75% from inflation, 10% from the European banking crisis, and more. In fact, no less than 16 of our last 22 trades have been winners. To get started with your trial subscription… Best Regards, Graham Summers
|
| Guest Post: Obama's Budget Banter Omission: The Banks Broke the Bank Posted: 14 Feb 2011 12:57 PM PST
Submitted by Nomi Prins Obama's Budget Banter Omission: The Banks Broke the Bank Since the White House announced its 2012 budget, the requisite punditry stream has been breaking down its specific pluses and minuses. I could grab illustrative quotes from various places and people, or add to the analytical details, but for the most part, it boils down to something like this: GOP and GOP supporters: Obama didn't make enough spending cuts, he's not taking this whole budget thing seriously. Oh, and about the cuts he did suggest with regard to corporate tax benefits, high-end mortgage-holder deductions and (his-own) extension of wealthy individual Bushian tax breaks - well, that's just plain anti-American and - will kill jobs. (The fact that corporations were contributing just 6.6% and 7.2% in 2009 and 2010, of the total federal tax receipts, a 50% drop relative to the rate before the financial crisis, or about $150 billion per year, isn't relevant in the scheme of things.) Now, where can we cut another $100 billion? DEMs and DEM supporters: Obama inherited a bum economy, bum budget and bum deficit from Bush. And, he's turning around the crap hand he was dealt, slowly. That means he has to cut back on some important programs, but he's gonna champion a high-speed railway, electric cars (to drive along side the high-speed railway?), and clean energy initiatives, and those will most certainly put millions of people back to work. Yes, he appointed Tim Geithner, one of the lead bank bailout builders, whose Treasury department colluded with the Fed, under Ben Bernanke, the other guy Obama kept on deck to help the economy, to increase the amount of US Treasury debt to $9.4 trillion from $5.4 trillion since the financial system began inhaling subsidies in the fall of 2008, and went on to post record bonuses and profits. But, he had no choice. The intent of the actual discourse kind of makes me imagine a burning building across the street, raging flames, engulfing smoke, crumbling over its foundation, and there are two people watching, one's a Democrat and one's a Republican. While the fire intensifies, they are arguing over whether it's better to use a thimble or a teaspoon of water as an extinguisher aid. Somewhere, off in the distance, is an engineer trying to figure out how to rebuild the building over its ashes. The sad truth is that the budget deficit is a direct outcome of the economic policies that were adopted by both parties over the years. National debt nearly doubled under Bush, and continued to grow under Obama, while the financial system pillaged the country for trillions of dollars twice - first, during the leveraged build-up to the economic collapse, and then, via a stockpile of creative subsidization awards afterwards, the underlying debt build-up for which, lingers like a bad hangover. Unless the real economy becomes healthier, more people are employed and we institute a far more progressive tax and distribution structure, there is simply no mathematical way, to balance this budget. So, there is no silver bullet amount of spending cuts that is sufficient to balance it either, particularly as long as we are only looking at, and debating about, the spending side of the US balance sheet, and only a portion of the non-discretionary component, at that. Quibbling over whether Obama is cutting enough or not enough, is quibbling over the wrong question. Obama showcasing just the cuts as these 'hard choices' that will get us more towards balance, is meaningless. It is equally misleading for the GOP to focus on a separate subset of potential spending cuts, and conclude that this extra $100 billion will do the trick. Making $1.1 trillion of cuts over ten years, all things equal, with a projected deficit per year that's higher than that, won't balance any budget, for any political party. You know what would have been really cool? If Obama had just said - you know what - the budget can't be balanced, deal with it. And you know why? Because over the past two years, the economy, that was trashed by the banking sector, still sucks. And, during the entirety of the Bush administration, while prepping the economy to suck, debt to pay for wars and tax cuts kept growing. And, when the banking system was facing the abyss, we opened our checkbooks, we stimulated the hell out of it, but we did it mostly through issuing Treasury debt and the magical Fed printing machines - so it doesn't show up in the budget that we're all debating, except for a couple hundred billion to Fannie and Freddie and what remains of the stellar TARP project. And you know what? I admit that was a stupid thing to do. It was stupid when it started under Bush, and it was stupid when it continued under me and the economic team I appointed to keep it going. The bailout binge increased our public debt by 50% under my reckless economic advisors, Treasury Secretary, the Federal Reserve. And, hell if other countries decide to dump Treasuries in bulk, and their interest rates rise, and Bernanke can't QE them down fast enough, our budget deficit will gap like the Grand Canyon. Meanwhile folks, we need revenue. Just like banks need profits to pay bonuses. And, that's something that can only be remedied through a healthier economy - not just for corporations, stock market investors and banks - that are sitting on $2 trillion in cash, with $1 trillion parked at the Fed - but for the general population that still counts 26 million people under or unemployed, not to mention a historically high 48.9% unemployment rate for youth, rising food and basic needs costs, continued foreclosures on entire families, and health insurance rates that will double within the next three years. You know what, when this country needed revenue in the past, Republican presidents and congresses did the math. Now, it's my turn. Let the GOP explain exactly how a lower corporate tax contribution created more jobs in the past two years, and while they're trying to figure that out, I'm gonna show some real leadership, and do everything I can - not to balance the budget - but to balance our economy. Oh well.
|
| The Six Words That Dominate the Financial Market Posted: 14 Feb 2011 12:28 PM PST
THE most important dynamic in the financial world today is that of the monetary policies between China and the US. This relationship can be summated in six words:
The US wants inflation, China DOESN’T.
China has now hiked interest rates three times in the last four months. It’s also raised reserve requirements at several of its banks. And it is rumored to be planning a 30% real estate market crash.
China is a country controlled by a small sliver of rich bureaucrats. They can only remain in power so long as the Chinese economy continues to grow and unemployment is contained. This is why China pumped some $580+ billion (nearly 14% its GDP at the time) into its economy.
This policy was further exacerbated by the US Federal Reserve’s money printing. All told the Fed has pumped TRILLIONS of Dollars into Wall Street. And Wall Street has done what it does best (aside from paying bonuses): funneled this money into risk assets to generate returns.
Which has resulted in Agricultural commodities EXPLODING higher in price:
What you’re looking at is a 65% increase in the ENTIRE Agricultural Sector in a little over seven months’ time. In the US, where food is so processed it’s barely food anymore, this has resulted in significantly higher food prices.
However, in emerging market economies (most notably the Middle East, India, and China), where hundreds of millions of people live off $2 per day or even less, the increase in food prices has resulted in outright starvation and riots.
This is going to be making things VERY difficult for the Chinese government. Social unrest has already unseated several regimes in the Middle East. And the same formula that created those situations (tons of poor, repressed folks no longer able to afford food) exists today in China as well.
With that in mind, expect the relationship between the US and China to deteriorate in the coming months. The flirtation underlying trade tensions (steel and tires) we’ve already seen will erupt into full-scale trade wars. We could very well even see an actual physical war the way things are heading.
With that in mind, now is the time to be preparing for all eventualities. This means buying physical Gold and Silver, stockpiling food and supplies, etc. We will be seeing shortages at some point in the future. And a little preparation now can go a long way towards bettering the future.
Best Regards,
Graham Summers
PS. If you’ve yet to take steps to prepare your portfolio for the coming inflationary disaster, our FREE Special Report, The Inflationary Holocaust explains not only why inflation is here now, why the Fed is powerless to stop it, and three investments that absolutely EXPLODE as a result of this.
All in all its 14 pages contain a literal treasure trove of information on how to take steps to prepare AND profit from what’s to come. And it’s all 100% FREE.
To pick up your copy today, got to http://www.gainspainscapital.com and click on FREE REPORTS.
|
| Largest bond fund, Pimco, cuts US government holdings Posted: 14 Feb 2011 12:21 PM PST By Dan McCrum http://www.ft.com/cms/s/0/c90b72d6-3877-11e0-959c-00144feabdc0.html#axzz... NEW YORK -- The world's largest bond fund sharply cut its exposure to US government-related debt in January, before US bond yields rose this month to their highest level in almost a year. Pimco's Total Return Fund, run by Bill Gross, a founder of Pimco, reported that its holdings of US government-related securities fell from 22 per cent in December to 12 per cent in January. The proportion of US government-related holdings, which includes US Treasuries, is at the lowest level held by the $239 billion fund since January 2009 when it held 15 per cent of its assets in the category. In September last year, one-third of the fund was held in government-related securities. The category can include a variety of conventional and inflation-linked Treasuries, agency debt, derivatives, and bank debt backed by the Federal Deposit Insurance Corp. ... Dispatch continues below ... ADVERTISEMENT Prophecy Resource Spins Off Platinum/Palladium Venture: Company Press Release, January 18, 2011 VANCOUVER, British Columbia -- Prophecy Resource Corp. (TSX-V:PCY)and Pacific Coast Nickel Corp. announce that they have agreed that PCNC will acquire Prophecy's Nickel PGM projects by issuing common shares to Prophecy. PCNC will acquire the Wellgreen PGM Ni-Cu and Lynn Lake nickel projects in the Yukon Territory and Manitoba respectively by issuing up to 550 million common shares of PCNC to Prophecy. PCNC has 55.7 million shares outstanding. Following the transaction: -- Prophecy will own approximately 90 percent of PCNC. -- PCNC will consolidate its share capital on a 10 old for one new basis. -- Prophecy will change its name to Prophecy Coal Corp. and PCNC will be renamed Prophecy Platinum Corp. -- Prophecy intends to distribute half of its PCNC shares to shareholders pro-rata in accordance with their holdings. Based on the closing price of the common shares of PCNC on January 17, $0.195 per share, the gross value of the transaction is $107,250,000. For the complete announcement, please visit: http://prophecyresource.com/news_2011_jan18.php Such a move to cut exposure to government debt would fit with the public comments of Mr Gross, an outspoken critic of US deficit spending and the quantitative easing measures employed by the Federal Reserve and other central banks. "Something has to change or the inevitable consequence is that inflation will go up and bond prices go down," Mr Gross told the Financial Times last month. He has warned that the 30-year run in bond prices, which rise as interest rates decline, has come to an end. With little room for rates to fall further and inflationary pressures building in the emerging world, developed world government debt is an unattractive option for investors, he said. However, analysts caution that Pimco's use of numerous derivatives as a substitute for direct positions in securities means that independent interpretation of portfolio exposures for the Total Return Fund is extremely difficult. Mr Gross is known for swiftly changing his holdings in response to market moves. The breakdown of the fund, meanwhile is published with a time lag. The market for US government debt may already have started to recover. Last Wednesday, the 10-year Treasury auction saw record demand, with 71.3 per cent of the $24bn issue bought by large US and foreign investors, much higher than the recent average of 44 per cent. The following day, pension funds and long-term investors stepped up and bought a higher than usual share of the $16 billion 30-year issue. Yields on 10-year US Treasury bonds were 4 basis points lower at 3.61 per cent at midday on Monday in New York. Yields hit 3.766 per cent on February 9, the highest level since April last year. The Pimco Total Return fund has lost 0.34 per cent in the year-to-date as of Friday. Last year, the fund was up 7 per cent for the year, which came in slightly less than its 10-year average return of 7.1 per cent. Mr Gross, a director of Pimco, the investment manager now owned by German insurer Allianz, was named fixed-income manager of the decade by Morningstar. The Total Return Fund is the best performing fund in its category over the last 15 years, according to Morningstar. Join GATA here: Phoenix Investment Conference and Silver Summit Or a colorful poster of GATA's full-page ad in The Wall Street Journal on January 31, 2009: http://gata.org/node/wallstreetjournal Or a video disc of GATA's 2005 Gold Rush 21 conference in the Yukon: Help keep GATA going GATA is a civil rights and educational organization based in the United States and tax-exempt under the U.S. Internal Revenue Code. Its e-mail dispatches are free, and you can subscribe at: To contribute to GATA, please visit: http://www.gata.org/node/16 ADVERTISEMENT Sona Drills 85.4g Gold/Ton Over 4 Metres at Elizabeth Gold Deposit, Extending the Mineralization of the Southwest Vein on the Property Company Press Release, October 27, 2010 VANCOUVER, British Columbia -- Sona Resources Corp. reports on five drillling holes in the third round of assay results from the recently completed drill program at its 100 percent-owned Elizabeth Gold Deposit Property in the Lillooet Mining District of southern British Columbia. Highlights from the diamond drilling include: -- Hole E10-66 intersected 17.4g gold/ton over 1.54 metres. -- Hole E10-67 intersected 96.4g gold/ton over 2.5 metres, including one assay interval of 383g of gold/ton over 0.5 metres. -- Hole E10-69 intersected 85.4g gold/ton over 4.03 metres, including one assay interval of 230g gold/ton over 1 metre. Four drill holes, E10-66 to E10-69, targeted the southwestern end of the Southwest Vein, and three of the holes have expanded the mineralized zone in that direction. The Southwest Vein gold mineralization has now been intersected over a strike length of 325 metres, with the deepest hole drilled less than 200 metres from surface. "The assay results from the Southwest Zone quartz vein continue to be extremely positive," says John P. Thompson, Sona's president and CEO. "We are expanding the Southwest Vein, and this high-grade gold mineralization remains wide open down dip and along strike to the southwest." For the company's full press release, please visit: http://sonaresources.com/_resources/news/SONA_NR19_2010.pdf
|
| A Look at 8 Silver Producers by Cost Per Ounce of Resources Posted: 14 Feb 2011 11:42 AM PST Thomas Kelly submits: Following up from my attempt at getting a comparative look at junior gold miners, I've put together a similar spreadsheet for analyzing silver producers by their cost per ounce of silver reserves and resources in the ground. This was done by dividing each miner's market cap by its total reserves (proven and probable) plus resources (measured and indicated) of silver in the ground to come up with the company's valuation per ounce of silver. The companies that appear in the table below are all US listed and have market caps between $400 million and $4 billion. Just as in the last analysis, this is a starting point for further research. I have not included non-silver assets in this analysis, and many of the companies have significant gold or base metal resources. Additionally, I have made no attempt to control for near term production profiles, cost of production, mineral grades, exploration Complete Story »
|
| Posted: 14 Feb 2011 11:12 AM PST Today the White House sent its budget to Congress and it will hit US $1.6 trillion for 2011, well above the previous US $1.3 trillion estimate. The proposed budget deficit for 2012 is US $1.1 trillion. Read More...
|
| Silver Is on the Brink of a Breakout Posted: 14 Feb 2011 11:09 AM PST The dynamics of the silver market are setting up what I think will be an explosive move to the upside in the short term (3 months). Comex warehouse inventories are depleted to what is now a 4 year low, which is just one of the several examples illustrating an extremely tight physical market. The Perth Mint in Australia has recently run out of 100oz bars, which I think speaks volumes as it is one of the more recognized bullion bank depositories in the world. We have already seen the problems with newly created silver ETFs obtaining their metal in a timely manner. The U.S mint continues to break record after record in Silver Eagle sales as well as saying they are unable to keep up with the current demand. We are also seeing the physical constraint in the futures market as Backwaration has steepened even further, which now goes out Complete Story »
|
| Posted: 14 Feb 2011 10:52 AM PST Gold Price Close Today : 1364.60 Change : 4.70 or 0.3% Silver Price Close Today : 30.529 Change : 0.537 cents or 1.8% Gold Silver Ratio Today : 44.70 Change : -0.644 or -1.4% Silver Gold Ratio Today : 0.02237 Change : 0.000318 or 1.4% Platinum Price Close Today : 1831.50 Change : 25.60 or 1.4% Palladium Price Close Today : 823.75 Change : 12.20 or 1.5% S&P 500 : 1,332.32 Change : 3.17 or 0.2% Dow In GOLD$ : $185.85 Change : $ (0.70) or -0.4% Dow in GOLD oz : 8.990 Change : -0.034 or -0.4% Dow in SILVER oz : 401.85 Change : -0.24 or -0.1% Dow Industrial : 12,268.19 Change : -5.07 or 0.0% US Dollar Index : 78.60 Change : 0.091 or 0.1% I continue to take a whipping from my friends and readers because silver and gold are making me not wildly optimistic but cautious, guarded, and suspicious. The GOLD PRICE peaked last Friday at $1,368, closed down two bucks to a cliff-hanging $1,359.90, then rose $4.70 (0.3%) to $1,364.60. High came at $1,366.65. It's hard for me to call this progress because it didn't close at a new high or even through past resistance while silver rose 1.7%. Why the disagreement? What are we not seeing? If gold wants to turn up, it needs to close clean through $1,368, then march on. Enough of this fiddling back and forth by two-sie/three-sie dollars. The SILVER PRICE has a flat contango, but a contango still and not a backwardation. The really far out months, in 2012 -2015, are in backwardation, but I have no data on how they behave. Silver is pressing the issue and about to reach a resolution nobody can argue with: its 3 January old high. Today silver recovered from Friday's blowing-hot- and-cold-out-of-both-sides-of-your-mouth close and gained 53.7c to close at 3052.9c, smashing 3025 AND 3050c resistance. Momentum indicators say silver can move higher still. If it breaks through 3109c close silver will quickly race for 3500c. This can't keep on. Either SILVER will begin agreeing with gold or gold with silver. GOLD closing above its 50 dma (now $1,372.27) will scream that both will rise. The Dollar Index is filling out all the boxes and painting the right shoulder of an upside-down head and shoulders on its 6 month chart. Assuming the dollar does not fall below 78.50 (78.30 lowest!) it ought to rise the rest of the week. Markets are oddly quiescent. Stocks are bobbling, but won't follow through. Silver is tugging, but gold lagging. Platinum and Palladium bounce to minimal new highs, then fall back. Euro has clearly broken, dollar definitively bottomed, it appears, but where's the confirming follow-through? Equilibria ain't. That is, equilibria don't last. Usually they are born not of exhaustion of buyers and sellers, but of a transitory equal balancing of their ferocious force. One or the other slips and the market takes off. Therefore some day soon, triggered by who knows what, markets will see big moves up or down. Or not. STOCKS today showed befuzzlement, some indices up and some down, slightly. "Which way should I jump?" they seemed to say. Against gold stocks have run out of gas and can't break through G$188.00 (9.094 oz of gold equals the Dow). Dow today ended at a 5.07 loss, 12,268.19. So far Dow has proven itself incapable of breaking through 12,280. S&P500 rose today 3.17 to 1,332.32. Stocks have painted out a fatal and deadly rising wedge, which in bear markets almost always resolves by plunging badly. By the way, the RSI and MACD momentum indicators are so overbought on stocks that they look like a joke. Even the unpracticed eye would mark their exaggeration. It's Valentine's Day and I can't shake out of my head the words of that great Southerner Andrew Nelson Lytle: "The opposite of love is not hate but power." Long have I turned that over in my mind, and the more I turn, the deeper Lytle's insight drives. Argentum et aurum comparenda sunt -- -- Gold and silver must be bought. - Franklin Sanders, The Moneychanger The-MoneyChanger.com Phone: (888) 218-9226 or (931) 766-6066 © 2011, The Moneychanger. May not be republished in any form, including electronically, without our express permission. To avoid confusion, please remember that the comments above have a very short time horizon. Always invest with the primary trend. Gold's primary trend is up, targeting at least $3,130.00; silver's primary is up targeting 16:1 gold/silver ratio or $195.66; stocks' primary trend is down, targeting Dow under 2,900 and worth only one ounce of gold; US$ or US$-denominated assets, primary trend down; real estate in a bubble, primary trend way down. Whenever I write "Stay out of stocks" readers inevitably ask, "Do you mean precious metals mining stocks, too?" No, I don't.
|
| Guest Post: Economy Flight 666 - Our One-Way Ticket To Zimbabwe Posted: 14 Feb 2011 10:19 AM PST
Submitted by Davos Sherman Okst Economy Flight 666 - Our One-Way Ticket To Zimbabwe Part 1 of 2 I’ve finally had the time to thoroughly study Bernanke’s entire Press Club speech, his appearance before Representative Paul Ryan’s House Budget Committee and bulk of the recently released 2005 FOMC minutes. Nice flying Captain @$$face. And Chris’s short chapter on inflation while you are at it. Chris is a brainiac who pulled the economy apart and explained it so even an economically challenged fourth grader could “get it”. Best yet he fully grasps the fact that a population pushing 7 billion and finite resources, resources that our economy is predicated upon is all tied together.
|
| It's End Game: Dollar Is Gone, Currency Revaluation.. Posted: 14 Feb 2011 09:51 AM PST
|
| Zuma speech raises nationalisation fears Posted: 14 Feb 2011 09:33 AM PST (miningmx.com) — Opposition parties are concerned that South Africa has shifted closer to nationalising its mines, following President Jacob Zuma's third state of the nation speech on Thursday.
"I think we're one step closer to the nationalisation of mines, and I'm very concerned about that," DA parliamentary leader Athol Trollip told Sapa after Zuma's address in Parliament. … In his address delivered earlier in the National Assembly, Zuma said the country's mineral wealth "is a national asset and a common heritage that belongs to all South Africans, with the state as the custodian". He noted the country had significant mining assets, currently valued at $2.5 trillion. [source] RS View: Choose your type of gold investments wisely. Gold in your hand is practically kin, whereas gold in the ground is destined to remain that perfect stranger whose path you shall never cross, whose acquaintance you shall never have to enjoy.
|
| Viral Bubbleomics: Debt infected Housing infected Oil …Now Gold Posted: 14 Feb 2011 09:15 AM PST This article, references two articles put out recently, one on oil and one on how America has been financing its trade deficit. The only place that published them was Market Oracle:
|
| Bernanke’s Undying Love of QE2 Posted: 14 Feb 2011 09:00 AM PST Three months ago, Ben Bernanke promised lower mortgage rates and lower corporate bond rates. He promised. Quantitative Easing – i.e. the Fed's scheme to print money and buy bonds – would deliver these benefits, Bernanke promised in a November 4, 2010, op-ed piece for The Washington Post. "Easier financial conditions will promote economic growth," the Chairman declared. "For example, lower mortgage rates will make housing more affordable, and allow more homeowners to refinance. Lower corporate bond rates will encourage investment. And higher stock prices will boost consumer wealth and help increase confidence…" But the Chairman was wrong. Three months after issuing his promise, interest rates are rising steeply, which is causing mortgage rates to rise as well. Quantitative Easing is not magic. It is a shell game that is producing predictably inflationary results. The prices of stocks and commodities are soaring, while the prices of long-dated bonds are tanking (which means bond yields are soaring). This is "Inflation 101," folks. Nevertheless, Bernanke credits QE2 for all things good. "The Chairman reviewed his Quantitative Easing, Second Inning (QE2) at the National Press Club on Thursday, February 3, 2011," writes financial market observer, Fred Sheehan. "His conclusion: 'The economic recovery that began in the middle of 2009 appears to have strengthened in recent months… A wide range of market indicators supports the view that the Federal Reserve's securities purchases have been effective at easing financial conditions. For example, equity prices have risen significantly, volatility in the equity market has fallen, corporate bond spreads have narrowed… Yields on 5- to 10-year Treasury securities initially declined markedly as markets priced in prospective Fed purchases; these yields subsequently rose, however, as investors became more optimistic about economic growth…" As to bond yields, Bernanke's assessment of his handiwork seems a bit disingenuous. While true that "yields…initially declined," it is also true – and more to the point – that yields subsequently soared. Therefore, to claim success because yields "initially declined" would be a bit like declaring the Titanic's maiden voyage a success because the ship initially floated. "The yield on 10-year Treasury bonds has jumped from 2.48% on November 4, 2010, to 3.65%," Sheehan points out. "That's a 47% boost, during the period in which the Federal Reserve bought approximately $200 billion of Treasury bonds to reduce mortgage rates… Accordingly, since November 4, 2010, Freddie Mac 30-year fixed-rate mortgage rates have risen from $4.10% to 4.81%. Housing – which accounted for 40% of new jobs during the ersatz-boom – is sinking, partially due to the higher rates since Bernanke's November 4, 2010, manifesto." Elsewhere in Washington, the Executive and Legislative branches of our democracy are busy making Bernanke's job even more hopeless. Enormous deficits are extending far, far toward the horizon, like amber waves of grain. As our colleagues at The 5-Minute Forecast observed earlier today, "The White House has given up any pretense: Its latest forecast for the fiscal 2011 deficit is now $1.65 trillion – which would set a record. And at 11.3% of GDP, the deficit's share of the overall economy would be the highest since World War II. "Today the Administration unveils a plan to cut $1.1 trillion from the budget…over the next 10 years. These 10-year projections, no matter which political party trots them out, are always a ruse to distract you from the fact that 'budget cuts' never seem to be 'deficit cuts.' If you want to talk about the next 10 years, here's the only number that matters: Under the White House plan, the official national debt would grow by 50% over the next decade, to $21 trillion." Hmmm… Since it might be a little tricky to borrow all of those dollars, we may have to print a few extras for ourselves. Eric Fry Bernanke's Undying Love of QE2 originally appeared in the Daily Reckoning. The Daily Reckoning has published articles on the impact of quantitative easing, bakken oil, and hyperinflation.
|
| Comex gold at upper end of range ahead of Chinese inflation report Posted: 14 Feb 2011 08:56 AM PST by Tom Jennemann Gold futures for April delivery closed up $4.70 at $1,365.10 an ounce in New York. Trade ranged from $1,354.40 to $1,367.50. Gold's safe-haven appeal eased after Egyptian President Mubarak announced his resignation on Friday. "There might be a slight premium because there's still some uncertainty but that's only a small component of the gold price. The US deficit, which is now front-and-centre, and inflation are much bigger factors," Larry Young, president of Covenant Trading LLC. "We established a base on January 23 ($1,309/oz) and since then we've seen three consecutive weeks of higher highs and higher lows. That really has traders excited, especially the ones who endured January. Unless another shoe drops, we will see this market gradually gain with our next two targets at $1,369 and $1,394," Young added. … the US is approaching its debt ceiling of $14.3 trillion, an issue that will soon be the centre of passionate debate. [source]
|
| Gold Daily and Silver Weekly Charts Posted: 14 Feb 2011 08:39 AM PST |
| Grand Theft USA – Prices Go Parabolic Posted: 14 Feb 2011 08:18 AM PST
Grand Theft USA – Prices Go ParabolicTwo percent! That’s how much the price of EVERYTHING has gone up IN AMERICA since Christmas Day, just 6 weeks ago. This is according to the very reliable Billion Prices Project at MIT, which collects pricing data every day from online retailers using a software that scans the underlying code in public webpages and stores the relevant price information in the database. The daily online index is an average of individual price changes across multiple categories and retailers that provides real-time information on major inflation trends.
He tells us that inflation was down in 2010 from 2.4% in 2009 to 1.2% last year and that he sees no inflation. In fact, he is basing his mathematical models on it and directing our nation’s policies on this basis and he is conducting the most dangerous monetary experiment in the history of the Universe – ALL BASED ON HIS PREMISE THAT INFLATION DOES NOT EXIST! But, what if it does? What if every other nation on Earth, including now even Japan, who see 3, 4, 6, 8, 12% and 20% inflation are not wrong and it is, in fact, Ben Bernanke who is wrong. I would not be as worried if The Bernank got on TV and said: Inflation is heading up to double digits, which is our plan but that’s not at all what he’s saying. This means either the Chairman of the Federal Reserver is either lying right to our Congresspeople’s faces, under oath, or that he is a clueless policymaker with his finger on the button of a weapon that can wipe out the wealth of nations – that can kill tens of millions of people through starvation and can just as easily wipe out everything the American people have worked to save their entire lives. Crazy or lying – take your choice… "Wait," you might say – "If Ben Bernanke is that wrong about inflation, wouldn’t there be some other hard evidence?" How about racking up $76Bn worth of losses in the 3 month-old POMO program already? Yes, that’s right, in just 90 days the Fed has racked up $76Bn in losses on existing and new Treasury, Agency and MBS purchases, according to Zero Hedge. "Gosh that sounds like a lot of money," you might be inclined to say. Don’t worry about it, it’s not going to be the Fed’s problem – it will be yours. As Dr. Bernanke testified last week: "At the appropriate time, the Federal Reserve will normalize its balance sheet by selling these assets back into the market."
Inflation is certainly creeping into our budget deficit, which is coming in at a whopping $1.65Tn for 2011, and amount that will equal (assuming GDP growth is 3.6%) 10.9% of our Nation’s Gross Domestic Product. Overall, the Government which collected less than $300Bn in Corporate Taxes against that $15,000Bn GDP (less than 1.5%) in 2009. The actual amount of taxes paid by US Corporations in 1999 was $191Bn out of $15,000 Bn of goods and services sold in the United States that year. Those must have been some horribly unprofitable sales, right? Poor General Electric – who produces the News that tells you how unfair corporate taxes are in America had such a rough time with their $156Bn in 2009 revenues that they had to ask for a $1Bn Tax REBATE from Uncle Sam last year. It’s amazing how fast a gross profit of $77.8Bn (49%) can disappear as it becomes an Operating Income (bonuses must be paid) of $29Bn (18.5%) and then, for tax purposes, just $10Bn which, somehow, causes GE to get a refund of $1Bn (10% of reported Income). Did they have a loss in 2008 that offset it? No, they declared $19Bn in taxable income and paid $1Bn in taxes (5%). How about 2007? No, they declared $26.5Bn of taxable income and paid $4Bn in taxes (15%).
We are playing a game and the game is called "Grand Theft USA" and our country is being stolen from us by Corporations, who use the skills of our people (government education), the health of our people (pay your own health care), the infrastructure of our nation (best in the World and falling apart) and the life savings of our people (top-level borrowing rates kept artificially low through massive Federal devaluing of our currency) while placing the PEOPLE (not the Corporations) of America ever deeper in debt. Our Multinational Corporations use and use and use and use and pay nothing back. Despite the fact that many may have had their origins here, they are now nothing more than Global Carpetbaggers. In post Civil War in America, Carpetbagger was the pejorative term for Northern Capitalists (mainly Wall Streeters) who came in post-disaster and politically manipulated and controlled former Confederate states for varying periods for their own financial and power gains. In sum, carpetbaggers were seen as insidious Northern outsiders with questionable objectives meddling in local politics, buying up plantations at fire-sale prices and taking advantage of Southerners. Gosh, wrap a flag around that and it’s exactly what the multi-nationals are doing to our country now! By the way, notice how the Mainstream Media has changed the definition of carpetbagger over the years to mean a politician who runs from another district. In fact, I challenge you to come up with 3 negative phrases that describe Corporate activity. Come on, you’ve lived long enough – you’ve watched thousands of newscasts, read thousands of pages of newspapers – what are the phrases they use to describe negative corporate behavior? I know poor people are fat, lazy, illegal, unwashed, unmotivated, uneducated, lying, cheating, scamming, octo-baby producing big losers who suck on the government teat every chance they get but, what are Multi-National Corporations?
The rising tide of inflation can certainly lift all market ships. Of course we’re ignoring the relative value of stocks to real inflation but that’s a deep kind of discussion we have with Members over months, not in 2 paragraphs of a morning post. As a quick example, check out the S&P 500 priced in gold since the crash. If we assume gold is a real hedge against inflation and the real value of a dollar, then US equities are STILL down 41% off the highs with a DECLINING 200-day moving average. In other words, we are losing ground to inflation and currency devaluation with our market plays:
Does this mean we don’t buy stocks? No, stocks need to catch up to inflation and they, like prices, are likely to go parabolic if inflation continues at the pace being measured by the Billion Prices Project. Also, we are blessed to be able to leverage our stock market gains and that should keep us well ahead of inflation but not so much for the tired, huddled masses we will be leaving behind as we hunker down in our luxury bunkers to ride out the revolution, which may come sooner than you think if speculators are right in projecting an additional 50% jump in the price of rice. As Mubarak has shown us – you can rob and oppress people for three decades without a peep as long as you feed them but, once they begin to starve – it is amazing how fast they take to the streets. Les Miserables is the World’s most popular musical – you would think some lessons would have been learned by the bourgeois audiences that walk out of the theater humming the tunes, but no… Happy Valentine’s Day!
|
| Why Silver Backwardation Matters Posted: 14 Feb 2011 08:05 AM PST Hard Assets Investor submits: By Laura Crigger Last week, silver slipped into backwardation, and, as Monty Python would say, there was much rejoicing. Backwardation in silver is a Big DealTM, as it's been over 10 years since we last saw near-term futures contracts trading higher than ones further out in the curve. In fact, not since Warren Buffett snatched up 130 million ounces back in 1997 have we seen the metal go backwardated. Even then, the condition was short-lived. This time, however, backwardation may prove to be more persistent. Compare the silver futures curve as of last Thursday's close, the chart that sent so many silver bugs into the streets ... ... with the silver futures curve as of today, Monday, Feb. 14 [current as of 11:30 a.m.]:
In last week's chart, we see that even though backwardation showed up in 2011, it remained slight, with merely the September 2011 contract trading a few Complete Story »
|
| Look to History to Profit from Gold Posted: 14 Feb 2011 08:03 AM PST Gold in the Carolinas? "Absolutely," says Jefferson Financial President and CEO Brien Lundin, who also publishes the Gold Newsletter. It's just one region where historic discoveries, ignored when gold prices were low, are now being re-examined with modern exploration techniques. The results, he says, are promising. Learn more about his take on the economy, the seasonal effect on gold prices and the "frothy" metals market in this exclusive interview with The Gold Report.
|
| Brien Lundin: Look to History to Profit from Gold Posted: 14 Feb 2011 08:01 AM PST Source: Brian Sylvester of The Gold Report 02/14/2011 Gold in the Carolinas? "Absolutely," says Jefferson Financial President and CEO Brien Lundin, who also publishes the Gold Newsletter. It's just one region where historic discoveries, ignored when gold prices were low, are now being re-examined with modern exploration techniques. The results, he says, are promising. Learn more about his take on the economy, the seasonal effect on gold prices and the "frothy" metals market in this exclusive interview with The Gold Report. The Gold Report: When we last talked in September, you said there were "very good arguments for significantly higher gold prices." Have those arguments changed? And, if so, how? Brien Lundin: They have changed a bit. Back then, the investing environment was tough because it was so uncertain. There weren't any clear trends. We didn't know if the economic recovery was really taking hold. At this point, we've firmly established that the economy is in a...
|
| Posted: 14 Feb 2011 07:59 AM PST
|
| Amarillo Gold Corp: The Scoop from the Field Posted: 14 Feb 2011 07:54 AM PST A Monday Morning Musing from Mickey the Mercenary Geologist [EMAIL="Contact@MercenaryGeologist.com"]Contact@MercenaryGeologist.com[/EMAIL] February 14, 2011 After a few delays because of conflicting schedules and the complications and hassles with getting a Brazilian visa, I finally made it to Sao Paulo on October 14, 2010. As you may imagine, giving up my passport to the Brazilian consulate for three weeks requires some advance planning. The visa application and processing procedure was convoluted at best; luckily my visa to Brazil is good for 10 years. Based on that experience, I was prepared for similar bureaucratic snafus at immigration and customs. But no sweat, I was in and out of the entire process in little more than ten minutes. It was probably the quickest and easiest entry into a foreign country in my 20+ years of international travel. I was met a couple of hours later by Buddy Doyle, CEO of Amarillo Gold Corp, and two of the company's more eccentric ...
|
| China and Russia: 2 Giant BRICs in the Economic Growth Wall Posted: 14 Feb 2011 07:49 AM PST China just overtook Japan as the world's second largest economy, according to an estimate by Japan's own government. Japanese GDP shrank at an annualized 1.1% during the last quarter of 2010. Remember Japan Inc.? How the Japanese were buying up Rockefeller Center and would soon own the world? Funny how things change in a little over 20 years…
The curious thing is that according to a Gallup poll out this morning, 52% of Americans mistakenly believe China is already the world's biggest economy. Fact is, the International Monetary Fund says China's $5.75 trillion GDP is still just 40% of the United States' $14.62 trillion. But perhaps the poll tells us that on a gut level, a majority of Americans realize they're living on borrowed prosperity…while the Chinese build up an immense reserve of savings. In another emerging market, the billionaires are back. Finans, one of Russia's leading business magazines, counts a record 114 Russian billionaires, measured in US dollars, as of year-end 2010. Steel tycoons dominate the top of the list. No. 1 is Vladimir Lisin, chairman of NLMK Steel. The new total surpasses the previous record of 101 in 2007. And it's a remarkable comeback considering how the number collapsed to just 49 in 2008; Russia's high rollers were insanely leveraged. "In the wake of Russia's financial crisis in 2008 and given all that we know about the problems in Russia," writes Chris Mayer, editor of Mayer's Special Situations, "I think most investors then would not have given the country much of a chance. "If we had to pick then which of the BRICS – Brazil, Russia, India and China – would have had the best decade, I don't think many people would've picked Russia. In fact, the casual investor today asked the same question about which one did best in the decade 2000-2010 would probably pick anyone but Russia. "Yet Russia was the best by far."
True, natural resources performed well during the decade, and Russia has a lot of them – a quarter of the world's natural gas reserves, 15% of the coal reserves, 15% of the coal, and 20% of the nickel. But there's more to the story. "Russia also has the advantage of having less debt relative to the size of its economy than its BRIC peers," Chris continues. "And it's a growing consumer market. "Russia is also General Motor's No.1 market worldwide in terms of market share and profit. Coca-Cola recently announced sales rose 31% in Russia. Its Russian division makes three times the profit of its Chinese unit on one-third of the sales. "I've driven home this point in many different ways in the past," Chris concludes, "but it's worth saying again: The world is shifting. The world's markets are becoming less and less of a US-centric story. "Last week, we had news that a German firm may buy the New York Stock Exchange. An iconic American institution could well be in foreign hands soon. It's the kind of world we live in. We don't have to like it, but as investors, we should accept it and try to take advantage of it." Dave Gonigam China and Russia: 2 Giant BRICs in the Economic Growth Wall originally appeared in the Daily Reckoning. The Daily Reckoning has published articles on the impact of quantitative easing, bakken oil, and hyperinflation.
|
| Posted: 14 Feb 2011 07:41 AM PST The following is automatically syndicated from Grandich's blog. You can view the original post here. Stay up to date on his model portfolio! February 14, 2011 11:29 AM [LIST] [*]Article on Grandich Client Donner Metals [*]Good bye U.S. Dollar? [*]Reminder [*]Debt spike [*]Shhhh…. [*]More taxes… What a surprise [*]Path to bankruptcy [*]Boxed in [*]Looming risks [*]Housing crash coming to a town near you? [*]What do insiders know? [*]Food for thought [*]Thank God it’s for peaceful purposes [/LIST] [url]http://www.grandich.com/[/url] grandich.com...
|
| Posted: 14 Feb 2011 07:41 AM PST The 5 min. Forecast February 14, 2011 11:58 AM by Addison Wiggin - February 14, 2011 [LIST] [*]China now No. 2 economy, while Russia's billionaires stage stunning comeback [*]Chris Mayer on one emerging market's stunning growth… and the chart to prove it [*]Sarnoff on stocks… Gold-silver gap narrows… WTI-Brent gap widens [*]Atlas Shrugged movie soon to debut… The 5 recounts a brief history of aborted Atlas projects [*]Readers sound off on record corporate cash, the Odyssey Marine saga and our commitment to truth (or TRUTH, as the case may be) [/LIST] As Addison wings his way to an emerging market today (this time, the "Chill Weekend" at Rancho Santana falls in the middle of the week)… emerging markets are making news left and right. China just overtook Japan as the world's second largest economy, according to an estimate by Japan's own government. Japanese GDP shrank at an annualized 1.1% during the last quarter of 2010. Remember Japan Inc.? How the Japanese were buying up Roc...
|
| Posted: 14 Feb 2011 07:40 AM PST Jesse'sCafeAmericain: James Turk On Silver, and A Possible Twist of My Own Share this:
|
| Gold prices: Where will they finish 2011? Posted: 14 Feb 2011 06:42 AM PST by Alix Steel
… Big time investor, Jim Rogers, stands behind his long term $2,000 gold price prediction. "It'll probably be much higher than $2,000 in the [next] decade but maybe even sooner, I don't know. But to me it seems pretty clear that it'll go to at least $2,000. If you adjust the old high back in 1980 for inflation, gold should be over $2,000 now." … Other estimates fall right in the middle. Out of the slew of mining executives I spoke to at the Denver Gold Forum in September of 2010, those from Angico-Eagle, Eldorado Gold and Randgold all predicted $1,500 gold. Goldman Sachs has predicted $1,650 an ounce for gold in 2011, although has called for a top in prices during 2012. Morgan Stanley has a 2011 gold price target of $1,512 an ounce while JPMorgan will now accept gold as collateral. [source]
|
| James Turk On Silver, and A Possible Twist of My Own Posted: 14 Feb 2011 06:38 AM PST |
| Gold Positioned for 2011 Run Up Posted: 14 Feb 2011 06:31 AM PST |
| The Myth of the ‘Primary Silver Mine’ Posted: 14 Feb 2011 06:17 AM PST One of the problems with soaking-up the "conventional wisdom" on any particular subject is the risk of mistakenly being misled by a widely-held misconception, instead. Such is the case when the subject of "primary silver mines" comes up for discussion. Any investor even modestly familiar with the red-hot silver sector will know that the majority of silver currently mined each year is produced as a "byproduct" of other mines (roughly 2/3 of all silver production). In other words, contrary to the vast majority of other metals, silver is unique in relying upon this "incidental" production to satisfy the massive and growing demand for silver both as an "industrial metal", and as an investment/insurance/"good money". There are many supply/demand dynamics which flow from this current paradigm of production, but even before we get to those factors, we need to analyze how we ever reached this current scenario. Certainly, throughout thousands of years of history, "silver mines" (i.e. mines which primarily produce silver) have been just as prevalent as "gold mines" – subject to the qualification that local geology will make one or the other more predominant in any particular region. The obvious question then becomes: how did the precious metals sector evolve into the current state where (on the one hand) we have most gold still produced from "gold mines" (i.e. primary gold producers) while with silver we are dependent upon mainly "byproduct" production for most of our silver? The answer can be reduced to one, very simple equation: the gold/silver price ratio. While most informed, precious metals analysts (including myself) will state unequivocally that gold is under-valued today, the price-ratio of silver to gold (which has averaged roughly 15:1 over 5,000 years) is currently at the still-extreme level of more than 40:1, despite the explosion in the price of silver in 2010. Thus if gold is "cheap", then silver is "dirt-cheap". Part of the reason why the general public has been inadequately informed (or arguably misinformed) by experts within this sector is because of the failure to engage in the most preliminary step of all analysis: definition of terms. When we define a particular mine as a "primary gold producer" or "primary silver producer" (or "primary lead producer"), we do so on the basis of the revenues produced from each metal, and not the quantity of metal produced. The reason for doing so is obvious: because each of these metals have vastly divergent prices, classifying mines based upon the ounces/pounds/tons produced of the particular metals contained in various ores would produce grossly misleading labels. Any/every mine which produced (for example) both precious metals and copper would inevitably be labeled as a "copper mine" since even if 90% of revenues came from gold and/or silver, most of the tonnage would certainly come from the copper production – given that copper is so much more plentiful and so much cheaper than gold or silver. Thus it is obviously necessary to classify mines according to revenues rather than tonnages. However, the fact that analysts in this sector never take the time to make their own reasoning explicit in this regard has caused them to misinterpret this data. Without exception, the current scenario where most silver is produced as a "byproduct" is treated as a "normal state of affairs" by these analysts, when (in fact) it must be nothing but a temporary aberration. Specifically, the only reason why there are so few "primary silver mines" in the world today is 100% due to the fact that silver is grossly under-priced versus any and every other metal on the planet. |
| Gold In A Bubble? And Other Irritations - Like Obama's Budget... Posted: 14 Feb 2011 06:08 AM PST By now everyone has seen the article this weekend in the Wall Street Journal about gold being in a bubble. The media keeps rolling out these financial "experts" to explain why gold is risky now - yet not one of these experts even remotely understands what he is talking about. Most of these "experts" are so clueless that it's beyond the proportions of Dickensian absurdity. But how come no one in the financial media is referring to Netflix stock as being in a bubble? Here is a great analysis on gold from Victor Sperandeo, notable for having worked for George Soros, that summarizes the golden truth about gold: Sperandeo explained that history showed that in 30 examined cases of hyperinflation exactly this amount of capital preceded an uncontrollable inflationary development. The current situation was therefore comparable with these historic cases. The US dollar is very much threatened by this development and will become subject to an enormous devaluation. In this context gold and silver are expected to continue to develop extremely well, since investors are hedging against a bond and US dollar crash by purchasing precious metals. According to Sperandeo, the current development in the precious metals prices was nothing more than a correction in a continuing bull market. As long as policy makers do not find another solution to their dilemma than printing more and more money, things will just stay the same.Here's the link to the article from James Turk's http://www.goldmoney.com/: LINK As for NFLX, today it is up over 6% and trading at 83x trailing earnings. Someone on Bloomberg TV just jubilantly proclaimed that Wall Street's new price target for NFLX is $316. Now, without examining NFLX's earnings, let me just state that the quality of NFLX's earnings is likely very questionable. GAAP requirements for accounting for fulfillment costs, thanks to Jeff Bezos and Amazon.com, are very "loose." In brief, the cost-accounting for fulfillment costs are similar to that of a ponzi scheme, and as long as revenues keep growing, a company with heavy fulfillment expenses, like NFLX, can hide the cash flow and earnings from what in effect are hidden cash expenses that don't run through the income statement. Just ask Bezos why he's on a program to unload stock every month if he really thinks AMZN stock is cheap. Same deal in terms of the accounting with NFLX. But the big question for me is how come Wall Street's anti-christ, gold, is continually labelled a bubble and ponzi stocks like NFLX get more adoration and cult status the more overvalued they become? Yes, this question is strictly rhetorical in nature. But here is a daily price performance chart of NFLX vs. GLD. You tell me which one is in an investment mania/bubble: (click on chart to enlarge)  When I woke to the horrifying nightmare referred to as "Obama's 2012 budget," I was going to dissect and pontificate the reasons why what he has proposed is patently absurd in terms of reducing this country's absurdly tragic fiscal spending disaster. But instead I'll just make a few general observations so I can relieve the nagging irritation I'm feeling. And I'll add that Obama has completely discredited his abilitly to lead with this budget proposal (as if he hasn't done that already...). To begin with, for him to seriously put forth projections that show budget deficit contraction after a couple of years of even larger projected deficits is retarded. Our Government can't even accurately report last month's economic numbers. So to think that it can project the likelihood of reduced budget deficits 10 years from now is insane. I truly hope Obama doesn't think any of us are stupid enough to buy into that joke he presented today. But let me just say that trillion dollar deficits require the phase-in of $100's of billions of dollars in spending cuts. Not the insiginficant snipping of a couple hundred million here and maybe a billion from a program that shouldn't even exist. Obama projects $1.1 trillion in deficit reduction over the next 10 years. But this forecast relies substantially on the Government's ability to grow revenues faster than expenses grow. And revenue growth relies on economic growth. Obama expects to achieve this by closing tax-loopholes, letting tax benefits expire and increasing some taxes. But to increase revenues from taxes, you need to have big growth in employment and income. Where will that come from, Barack? Given that the definitive trend in employment is being emasculated by a rapidly shrinking labor force, I would be a lot more curious to see how Obama would expand the labor force and enable personal income growth... And the bulk of the spending problems in this country come from defense spending and entitlements. Those areas of spending were largely left untouched. Unfortunately, this country is engaged in a policy of castrophically unsustainable domestic welfare - yes, this includes social security, medicare, food stamps and unemployment benefits - and international imperialism, which together the President AND both political parties refuse to touch. Until our Government significantly slashes and restructures the Governmental anatomies of defense spending and entitlement programs, this country is on a definitive path of collapse. In the words of Victor Sperandeo from the article linked above: [T]he political leadership in the United States will continue to print large amounts of fresh money until foreign investors lose their confidence in the repayment of the outstanding US debts. This would eventually lead to a panic at the bond markets. The incipient bond sales avalanche would then trigger the outbreak of a hyperinflation in the United States.And hyperinflation precedes systemic collapse.
This posting includes an audio/video/photo media file: Download Now |
| Posted: 14 Feb 2011 06:05 AM PST By Captain Hook, Treasure Chests In the spirit of my recent observations concerning our corrupt bourgeoisie's penchant for turning up the heat in order to get what they want, and that we could be very close to a turning point in this regard, it would be fitting to see the seeds of revolution planted within sight of our racial origins (Northern Africa), considering this time around the drama will encompass the globe on a profound level. Along these lines, one must wonder if this is the real McCoy, or just a dress rehearsal for things to accelerate to more dangerous levels next year, within biblical dimensions during 2012. Certainly on a more practical level there is reason for revolution moving forward due to the growing energy imbalance required for the human race to keep increasing with peak oil in the here and now, however who knows, maybe new technologies will allow us to tack on more billions of population growth in the years to come. If this is not the case however, and the human race rolls over into decline, then, the implications associated with 'these times' could in fact prove to be 'biblical' in dimension, where it's best to embrace the concept of 'viva la revolution' in order to survive. And of course if this is true, then, it's important to realize that on a basic level fewer people will need less money, which although not realized by many, is why our fiat currency / credit based economy(s) are in peril of rolling over as well. So you see the condition our condition is in is all tied together down to the most basic level(s), and is at a minimum cyclical in nature. The important thing to realize here is that our perception of the concept 'survival of the fittest' is just that during the good times, a concept, however during times of stress, like in revolutions, understandings tend to come alive into something more real and primitive. And along these lines, and because trust is also lost during such times, our money returns to it's more primitive roots also, anchored closer to the ground in which we need to grow things, but yet needing more lasting qualities. This is naturally why we as a race have embraced precious metals in this regard, with gold and silver our undisputed and preferred eternal money. And gold will remain the world's undisputed and preferred eternal money even in times like these, when it's going down. You may say, along with James Turk, yes, but gold is not going down. It's merely had a correction and is now poised to shoot back up to new highs. Unfortunately if you believe this you are premature and don't understand either the gold market, or our faulty and fraudulent markets in general at all, because it's not fundamentals that make markets these days, it's speculator betting practices. In the first place, it should be noted gold failed to reach the larger degree Fibonacci resonance related target just above $1500, as can be seen here in Figure 1, which can be construed as being bearish under present circumstances. And pray tell, exactly what circumstances do we refer? Well, for one thing, precious metals shares have a tendency to underperform when input costs are rising rapidly, with energy at center presently. So the trouble in Africa will not help in this regard if crude oil keeps going up $3 a day. Secondly however, and most importantly, make no mistake about it, as alluded to above open interest put / call ratios across the precious metals sector have been crashing, with those of the shares (NEM, GG, etc.) and share indexes (GDX, XAU, etc) at center in this regard. What's more, you can see how important speculator betting practices are in our faulty and fraudulent markets when the performance of precious metals shares is set against the broads that have been increasingly shorted, as can be seen in the heavily traded SPY contract, where the open interest put / call ratio is soaring. This is why stocks did not crash yesterday, not because things are improving overseas. (i.e. or because the economy is getting better.) Liquidity is on the rise, with not only growth rates of M2 and other conventional money supply measures accelerating; but more, monetary authorities are also pumping daily POMO injections (like a drug) and excess reserve allowances ($25 billion per week over the next 8-weeks) into the system as well, which is the other key element in supporting the perpetual squeeze in anything speculators are dumb enough to short. (i.e. think the broads.) So, don't be surprised if the performance gap between precious metals and the broad measures of stocks continues to grow, because it will. And it will continue to grow as long as crazed speculators continue to buy every dip in precious metals (buy calls on stocks, indexes, etc.) and selling the rallies in the broads (short selling, buying puts, etc.). Of course at some point the speculators will stop buying puts on the broad measures of stocks due to combination of exhaustion and / or good news becoming prevalent and then they will join precious metals shares. And make no mistake about it, precious metals shares are breaking down, where in spite of the probability a bounce might be in order soon, this would likely just be shoulder building on the head and shoulders pattern forming in the Amex Gold Bugs Index (HUI) seen below. (See Figure 1) Figure 1
The measure in the above noted head and shoulder's pattern is down to 400 (500 – 100), which not many investors / speculators in the sector are expecting, which is why it can happen. All we need to see is the 200-day moving average go to confirm the fact prices are falling in five-wave sequences and the die will be cast – precious metal share fate will be cemented. So, needless to say we will be watching events in coming days closely, watching to see if gold breaks below the trend definer (in pink) too, as has already occurred in the shares. (i.e. which are leading the way down.) All we need now is for interest rates (think TNX) to confirm the bullish trend higher and this should be about as much as gold could handle under present circumstances (think deflationary), and this break lower should occur soon enough. (See Figure 2) Figure 2
And don't be fooled by the big drop in open interest last week, neither this nor physical supply side constraints will help once the larger equity complex rolls over, given if this is not to be the case for some time (think options expiry in March like in 2000), then sporadic rallies would occur. All such rallies should be sold until a more profound correction occurs however, because the liquidity draw of such an occurrence will envelop macro-conditions in a profound manner. Again however, with the Fed pumping an extra $25 billion per week into the system until the end of March this is not expected right away, however a top in equities could be seen prior to the liquidity feed running out, like at options expiry in March if this is when the speculators / hedgers are finally to cease buying puts in betting against the broads. This is how long it took for these types to become exhausted off the Fed's extreme liquidity event surrounding the Y2K scare in 2000, so this might repeat once again in terms of seasonality associated with such extremes. Unfortunately we cannot carry on past this point, as the remainder of this analysis is reserved for our subscribers. Of course if the above is the kind of analysis you are looking for this is easily remedied by visiting our web site to discover more about how our service can help you in not only this regard, but also in achieving your financial goals. Along these lines, you should know your subscription to Treasure Chests would include daily commentary from either the myself or Dave Petch. As you may know, I cover macro-conditions, sector timing, and value oriented stock selection, while Dave covers the HUI, XOI, USD, SPX, and TNX technically each week. Mr. Petch is a world class Elliott Wave Theory technician. In addition to this, you would have access to all archived commentaries, the Chart Room, exhibiting 100 annotated charts of the precious metals and stock markets, along with stock selection and sector outlook pages. Here, in addition to improving our advisory service, our aim is to also provide a resource center, one where you have access to well presented 'key' information concerning the markets we cover. And if you are interested in finding out more about how our advisory service would have kept you on the right side of the equity and precious metals markets these past years, please take some time to review a publicly available and extensive archive located here, where you will find our track record speaks for itself. Naturally if you have any questions, comments, or criticisms regarding the above, please feel free to drop us a line. We very much enjoy hearing from you on these matters. Good investing and best of the season all. Captain Hook The following is commentary that originally appeared at Treasure Chests for the benefit of subscribers on Tuesday, February 1st, 2011. Copyright © 2011 treasurechests.info Inc. All rights reserved. Treasure Chests is a market timing service specializing in value-based position trading in the precious metals and equity markets with an orientation geared to identifying intermediate-term swing trading opportunities. Specific opportunities are identified utilizing a combination of fundamental, technical, and inter-market analysis. This style of investing has proven very successful for wealthy and sophisticated investors, as it reduces risk and enhances returns when the methodology is applied effectively. Those interested in discovering more about how the strategies described above can enhance your wealth should visit our web site at Treasure Chests. Disclaimer: The above is a matter of opinion and is not intended as investment advice. Information and analysis above are derived from sources and utilizing methods believed reliable, but we cannot accept responsibility for any trading losses you may incur as a result of this analysis. Comments within the text should not be construed as specific recommendations to buy or sell securities. Individuals should consult with their broker and personal financial advisors before engaging in any trading activities. We are not registered brokers or advisors. Certain statements included herein may constitute "forward-looking statements" with the meaning of certain securities legislative measures. Such forward-looking statements involve known and unknown risks, uncertainties and other factors that may cause the actual results, performance or achievements of the above mentioned companies, and / or industry results, to be materially different from any future results, performance or achievements expressed or implied by such forward-looking statements. Do your own due diligence.
|
| Technically Precious with Merv Posted: 14 Feb 2011 05:58 AM PST By Merv Burak, CMT, Precious Metals Central The upheaval in the Middle East has done nothing for gold. It looks like gold is ready for more downside action. A move to $1305 would not be good. The "Penny Arcade Index" is still okay so any downside activity shouldn't last for too long. GOLDLONG TERM First, the P&F chart. As mentioned previously, it had given me a bear signal but there was still a support at the $1320 mark to be overcome before really going bearish. This requires, on the P&F chart, a move to the $1305 level, which the price has not yet met. So, we are in limbo for now. A move to the $1305 level would also cross below the long term moving average line and turn the line downward further confirming the bear, at that time. So, we wait. Looking at the usual indicators, the price of gold remains above the long term moving average line. The line itself is still in an upward slope but is turning towards the horizontal ready to turn down on the slightest provocation. The long term momentum indicator continues in its positive zone and is once more above its now positive trigger line. However, weakness is shown in that it just can't seem to get any significant upward trend going. The volume indicator seems to have topped out and is in a basic lateral drift. It continues to move above and below its trigger line in the process. It is below the trigger on Friday however, the trigger is still very, very slightly in a positive slope. All in all the long term rating still remains BULLISH. INTERMEDIATE TERM On the intermediate term we have a somewhat less favorable story. Gold continues to track below its negative sloping moving average line. The intermediate term momentum indicator has now moved above its neutral line into the positive zone and above a positive trigger line. As for the volume indicator, it continues to be basically below its trigger line and the trigger remains in a negative slope. On the intermediate term the rating is only at the – NEUTRAL level, one step above a full bear. The short term moving average line, although moving upwards, is still below the intermediate term line for a negative reading and confirmation of the negative rating. SHORT TERM Although it looks like we are in a short up trend it also looks like a topping activity getting ready for some more down side action. A drop below $1350 would put us into such a negative phase. For now gold price remains above its short term moving average line and the line slope remains upward. The momentum indicator is just very slightly above its neutral line and above its positive trigger line but that could change with another negative day of activity. The daily volume action is still pretty low and below its average volume over the past 15 days. For now the rating remains BULLISH with the very short term moving average line confirming.
As for the immediate direction of least resistance, I'm going with the down side for Monday. The past two days have been negative days and the Stochastic Oscillator has just dropped below its overbought line and below its trigger line and seems to be heading lower. SILVERSilver has out performed gold this past week and just about made it into new high territory but stumbled and is getting ready for more down side action. A little bit of positive view is the fact that although the last two days were negative days for silver, the price each day seems to have rebounded significantly from the day's lows and appears not to want to go lower. So, maybe the downside is not in the works but only a very short rest. For today everything is still on the plus side. For the long term silver is still in no danger from any reversal so the rating remains BULLISH. On the intermediate term everything is also positive with silver above its positive moving average line and the momentum indicator in its positive zone above its positive trigger line. The volume indicator is slightly above its trigger line although the trigger is still pointing downward. In all, the indicators suggest the intermediate term rating is BULLISH. The short term moving average line has just crossed above the intermediate term line for confirmation. On the short term the trend is still in a positive direction BUT it does seem to be topping out. We do have a slight up trending short term wedge pattern that was broken to the down side on Friday. A short term up trend in the momentum indicator was broken the day before. However, as of the Friday close we are still in positive territory. The price of silver remains above its positive sloping moving average line and the short term momentum indicator remains in its positive zone. The indicator has, however, turned to the down side and is sitting right on top of its trigger line. The daily volume activity is still pretty low and not helping. It is slightly below its average volume over the past 15 days. Still, with everything considered the short term rating remains BULLISH with the very short term moving average line confirming. PRECIOUS METAL STOCKSI had been asked by many viewers to post my Composite Index of Precious Metals Indices more often, so here it is today.
The Composite Index is, of course, based upon the average weekly performance of all the components of the Table posted here each week. There are a few interesting features shown on the chart. We have a slight expanding wedge pattern (commonly referred to as a megaphone pattern). This pattern, once well established, is not a positive pattern and usually suggests a volatile weakness in the price activity. Too often it ends up with the price moving to lower levels, breaking the lower support line. For now we see the recent Index price hitting the upper resistance line and reacting. Now the question is, how low will it go? Although difficult to see, we did have a sharp up trend line from the August low which was broken on the first week of January. Going over to the long term momentum we see that it is still comfortably, for now, within its positive zone and more importantly, the recent January top did not give us a negative divergence so the move was still quite positive. I wouldn't go into performing a ratings review on the Composite. I think it's more important to rate the individual Indices and especially the particular sector (see the Merv's Indices) of the precious metals one is interested in. Merv's Precious Metals Indices Table
Well, that's it for this week. Comments are always welcome and should be addressed to mervburak@gmail.com. Merv Burak, CMT Hudson Aero/Systems Inc. Technical Information Group for Merv's Precious Metals Central
13 February 2011 For DAILY Uranium stock commentary and WEEKLY Uranium market update check out my new Technically Uranium with Merv blog at http://techuranium.blogspot.com. During the day Merv practices his engineering profession as a Consulting Aerospace Engineer. Once the sun goes down and night descends upon the earth Merv dons his other hat as a Chartered Market Technician (CMT) and tries to decipher what's going on in the securities markets. As an underground surveyor in the gold mines of Canada's Northwest Territories in his youth, Merv has a soft spot for the gold industry and has developed several Gold Indices reflecting different aspects of the industry. As a basically lazy individual Merv's driving focus is to KEEP IT SIMPLE. To find out more about Merv's various Gold Indices and component stocks, please visit http://preciousmetalscentral.com. There you will find samples of the Indices and their component stocks plus other publications of interest to gold investors. Before you invest, Always check your market timing with a |
| For week ending 11 February 2011 Posted: 14 Feb 2011 05:57 AM PST Technically Precious with Merv The upheaval in the Middle East has done nothing for gold. It looks like gold is ready for more downside action. A move to $1305 would not be good. The “Penny Arcade Index” is still okay so any downside activity shouldn’t last for too long. GOLD LONG TERM First, the P&F chart. As mentioned previously, it had given me a bear signal but there was still a support at the $1320 mark to be overcome before really going bearish. This requires, on the P&F chart, a move to the $1305 level, which the price has not yet met. So, we are in limbo for now. A move to the $1305 level would also cross below the long term moving average line and turn the line downward further confirming the bear, at that time. So, we wait. Looking at the usual indicators, the price of gold remains above the long term moving average line. The line itself is still in an upward slope but is turning towards the horizontal ready to turn dow...
|
| £1,000 Olympic gold coin to become legal tender Posted: 14 Feb 2011 05:45 AM PST The Royal Mint plans to manufacture the first ever £1,000 gold coin, which will be legal tender, and is designed to celebrate the London 2012 Olympics.
|
| $2100 ‘Sounds Right’ For an Ounce of Gold Posted: 14 Feb 2011 05:44 AM PST
|
| Egypt army says post-Mubarak protests harming economy Posted: 14 Feb 2011 05:17 AM PST By Mariam Fam, Maram Mazen and Ahmed Namatalla …The army yesterday dissolved parliament and suspended the constitution, meeting demands made by the opposition movement that forced Mubarak from office, and said it will rule Egypt until elections are held. Finance Minister Samir Radwan said yesterday that more than two weeks of unrest cost the economy $310 million a day, as tourists shunned the country and borrowing costs rose. … The central bank ordered banks to shut today due to protests by employees at lenders including the Principal Bank for Development and Agricultural Credit. Workers at the Public Transport Authority have been on strike since Wednesday, demanding pay rises. 'Where's the Money?' Five buses drove past Tahrir square to the state-television building, with transport workers inside chanting "Where is the authority's money?" … Foreign companies in Egypt shut down operations during the protests, and the visitors who represent one of the country's key sources of foreign currency stayed away. That cost Egypt about $1.5 billion of tourism revenue, according to Central Bank Governor Farouk El-Okdah. [source] RS View: The silver lining to emerge from chaos is a sharper focus on elements long ignored or taken for granted.
|
| Current Silver Definition Move Not Like the Others Posted: 14 Feb 2011 05:14 AM PST For those who may be wondering what they might have missed in Sunday’s full Got Gold Report, posted on the password-protected subscriber pages and emailed to subscribers this past weekend, below is a short excerpt from the report. It is two pages of a 23-page update for Vultures, our valued subscribers. Subscribe to the GGR. Subscribers help to make Got Gold Report possible. With no further preamble, below is this Valentine’s Day excerpt of the full Got Gold Report. *** Backwardation and tightening contango is a sign of very heavy immediate demand and this is definitely something that bears close watch in the days and weeks just ahead. We are also convinced that unless some of the most recent buyers lose their nerve and return physical to the market en masse, the silver demand supply imbalance is likely to escalate – probably in sudden surges and possibly in a much more violent way later this year. That brings us to the Definition Mov...
|
| Revolution in Egypt and Where to Be When Black Swans Appear Posted: 14 Feb 2011 05:11 AM PST Bill Bonner View the original article. February 14, 2011 10:03 AM Not much action in the stock market on Friday. Gold didn't do much either. The big news was that Hosni Mubarak called it quits. After supporting him for 3 decades, the US threw him under a tank. Almost everywhere except the Mubarak household, people rejoiced. We were surprised they had an opinion, one way or the other. We got emails from strangers telling us what a "hopeful" development this was…or how "free elections" might be coming next. Typical was the report in The Washington Post: "Mubarak became the second Arab leader in a month to succumb to his people's powerful thirst for freedom." "Thirst for freedom?" If Egyptians were thirsty for freedom they must be like camels. They only need a drink of it once every 30 years. Mubarak ruled for three decades. Egyptians went without quenching their "powerful thirst for freedom" through the '80s, the '90s and the '00s. Apparently, they only needed to bring t...
|
| Gold Meanders at 50% Retracement Posted: 14 Feb 2011 05:11 AM PST courtesy of DailyFX.com February 14, 2011 07:50 AM 240 Minute Bars Prepared by Jamie Saettele To review, “decline from 1425.40 is in 5 waves, indicating that the larger trend is most likely down. Price has reached the 50% retracement of the impulsive decline, with the 61.8% at 1380.82 serving as additional resistance if needed. Expectations are for the corrective advance to terminate.” More evidence is needed before we can proclaim that a secondary top is in place but this is a good place for a top to form. The clear substructure of the corrective advance also inspires confidence in the idea that this turn is the real deal....
|
| Posted: 14 Feb 2011 05:02 AM PST
|
| Exeter Exercises Option and to Acquires Caspiche Gold Copper Project Posted: 14 Feb 2011 05:00 AM PST Exeter Resource Corporation (AMEX:XRA, TSX:XRC, Frankfurt: EXB – "Exeter" or the "Company") is pleased to announce that it has exercised its option to acquire the mineral properties comprising the Caspiche gold-copper project in the Maricunga district, Chile from Anglo American ("Anglo"). Anglo will now transfer title to the mineral properties to Exeter and retain a 3% net smelter royalty on production from the project*. Exeter has made the first annual advance royalty payment of $250,000, payable for the next 10 years, or until commercial production, whichever is the sooner.
|


 In other words,
  As noted by
  This isn’t about GE, of course. When the sum total of all Corporate Taxes collected against $15Tn of goods and services sold in the US is just $200Bn – we should consider ourselves lucky that GE "only" took $1Bn from us. Just ask DIS, NWS or CBS ($13Bn in sales, $182M in taxes paid) and they will tell you (through the media they control) that, if anything, US tax policy is strangling their ability to prosper. It’s true! It must be, because I saw it on TV AND I read it in the Wall Street Journal!
  Now, before you start checking to see if you are accidentally reading the Daily Worker, let’s see what kind of investing thesis we can draw from all this. We were discussing the wisdom of playing long-term shorts on momentum stocks like PCLN, NFLX, OPEN and CMG in
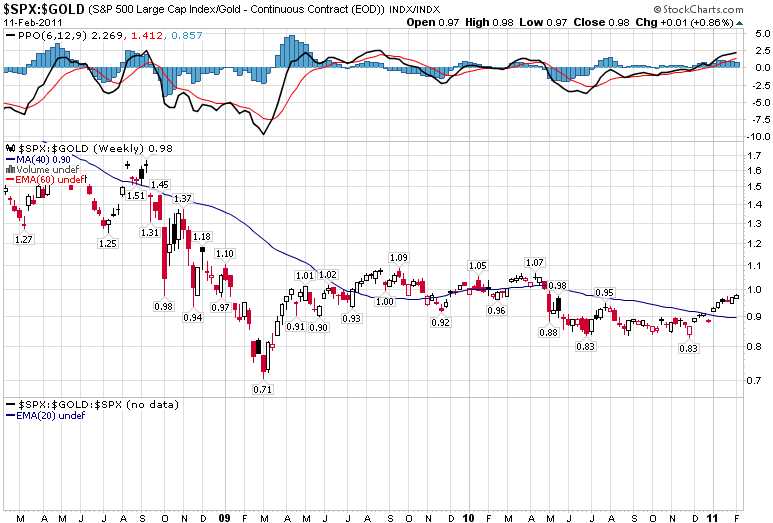


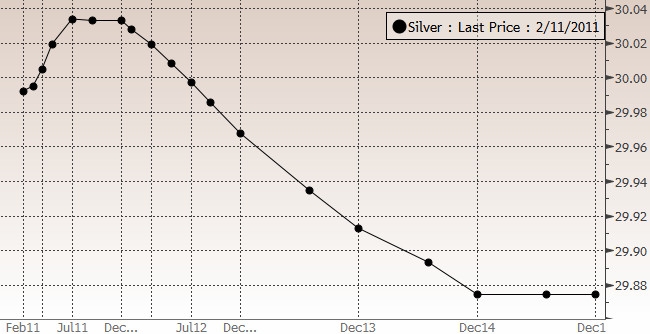
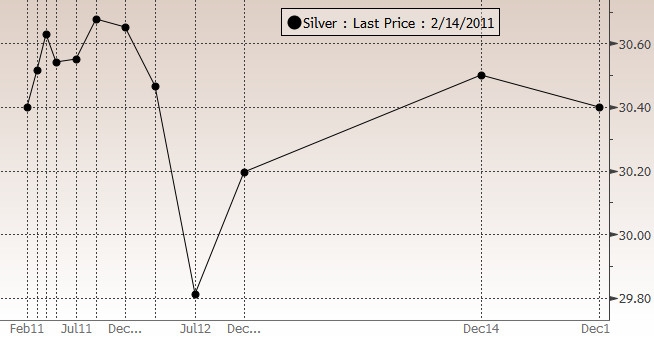
| You are subscribed to email updates from Save Your ASSets First To stop receiving these emails, you may unsubscribe now. | Email delivery powered by Google |
| Google Inc., 20 West Kinzie, Chicago IL USA 60610 | |
No comments:
Post a Comment