


saveyourassetsfirst3 |

- 2010-12-07 Morgan Stanley, Goldman Sachs, Societe Generale, BNP Paribas, Barclays, Bank of America - Merrill Lynch Gold Price Forecasts 2011, 2012
- Now???
- With RBA Unchanged and USD Weakening, Time to Short Australian Dollar / Euro
- Bad Day for Goldfinger, But Worse for Mr. Bond
- Market Stats
- Silvers 1980 Record Nominal High Targeted by Hedge Funds and Investors
- SLV 'Tonnes in the Trust' Back at Record High
- This country's problems could dwarf the euro crisis
- A must-read interview with resource legend Rick Rule
- SLV Record Metal Holdings
- The Confiscation Con
- December 7, 2010 -- A Day Which Will Live in Infamy
- The Road Ahead
- Gold, Defaults & A New Brady Bunch
- Silver Seven Stock Index and PM Funds Index
- New large-format 'America the Beautiful' silver coins in demand
- Euro collapse 'possible' amid deepening divisions over bail-out
- Global Macro Notes: Beware the Rip Currents
- From Bad To Worse: The Economy Today, And Tomorrow
- Gold Holds Near Fresh USD, Euro and GBP Records, “Silver Action Very Bullish”
- Gold’s New Reality $1424-1624
- These Charts Suggest Gold and Equities Going Higher into 2011
- YOU AIN’T SEEN NOTHING, YET: HUI About to Begin Its 3 OF III Momentum Run!
- The Key Relationship between US Real Rates and Gold Prices
- CA Fitz Report: Tax issues in moving or exchanging precious metals
- Gold Holds Near Fresh USD
- The US Federal Reserve: A Bank that Will Live in Infamy
- Raid on gold and silver/Bush tax cuts continue /unemployment benefits continue for another 13 months
- Silver's 1980 Record Nominal High Targeted
- The S&P 500 & Gold Are in Last Rally Stages
- Is Capitalism Dead?
- What Happens When Currencies Go Bust?
- Gold Breakout in Real Terms Means Good Times are Ahead for Gold Bulls
- Gold Seeker Closing Report: Gold and Silver End Slightly Lower After Hitting New Highs
- We Don’t Need No Education
- Why Democrats And Republicans Are Both Wrong About The Bush Tax Cuts
- What’s Next For Silver?
| Posted: 08 Dec 2010 11:01 AM PST Reuters has compiled recent gold price predictions by major banks. Gold forecasts for 2011 range from $1,315 (Morgan Stanley) to $1,575 (Goldman Sachs). | ||
| Posted: 08 Dec 2010 03:06 AM PST Just got a good-sized chunk of money that I plan on putting into silver. My treasure trove is already fairly hefty (it didn't have a bit of trouble sinking in that last boating accident), so I'm not concerned about protecting myself at any cost like the newbies should be. I am concerned about getting the biggest bang for my bucks, since this will be the last sizable purchase I'm ever able to make. Should I jump in there now, or do you guys see more down side to this correction? Thanks for your advice. | ||
| With RBA Unchanged and USD Weakening, Time to Short Australian Dollar / Euro Posted: 08 Dec 2010 02:43 AM PST World Market Pulse submits: The US Dollar has been generally weaker after a meeting of European finance ministers failed to produced any new measures to deal with the EU's deepening credit crisis. The long term USD outlook has also gotten weaker after the White House finalized a deal with Congressional Republicans to extend Bush-era tax cuts in return for the extension of unemployment benefits. In Asia meanwhile, the Reserve Bank of Australia (RBA), decided to maintain its key-lending rate unchanged at 4.75% as expected. Complete Story » | ||
| Bad Day for Goldfinger, But Worse for Mr. Bond Posted: 08 Dec 2010 02:16 AM PST Macro Man submits: Well, Team Macro Man was happy with yesterday's gold move, but they are sure they are not alone in cringing at the car crash that has occurred in the Treasury and FX markets overnight, as tens smashed through 3% and then proceeded to trade as low as 3.25% on the London open. Cue a barrage of excitable emails; Bloomberg messages and IBs from all corners of the market, intellectualizing about how the Treasury move shows that the market is now worried about the sustainability of the US debt load, or that equities can't rally with yields moving higher, or that QE2 has failed, or that mortgage convexity selling is about to send yields to 3.5% etc. etc... Usually, Team Macro Man's "signal" for when things have gotten a bit overdone is when emails on rather complex subjects start to come from single stock equity guys or the FX market... we'll merely refer you to our Armchair Generals piece. Complete Story » | ||
| Posted: 08 Dec 2010 01:44 AM PST Most recent week ended. Dow Jones Industrial Average: Closed at 11382.09 +19.68 after breaking out of a continuation triangle earlier this week. The objective in this new rally is 11,400 resistance with a 4-8 week potential breakthrough to 11,500-11,750. Momentum was falling on increasing volume in November. This fall was blocked and stopped using the media tools and futures manipulation as in the last hour of trading on this Friday. The price pop this week occurred in the last three trading days. Price was near 11,000 and jumped to nearly 11,400 to the close today. We think there has to be more selling this month to tidy-up the trading books in some funds. Most of that is nearly over, but we think some remains. There is a hard bear double top between 11,400 and 11,500 coming next week. We forecast this could cause some back-filling and pause followed by more buying to conclude a bonus driven Santa Clause rally. S&P 500 Index: Closed at 1224.71 +3.18 as this market advanced to post a bear double top at 1225.00. Volume was lower for the weekend. Falling momentum based and supported today. After a price breakout above all moving averages and a continuation triangle, we think there should be more buying from traders on Monday. Resistance is 1225 and support is 1220. We could rise slightly early next week and then move in a channel between 1220 and 1250 until the middle of December. After that, expect this market to take a run at breaking up and through 1250 toward 1300. S&P 100 Index: Closed at 548.82 +1.30 on normal volume as it heads toward another double top at 550-560. Price is above all moving averages and channel line supports, which is bullish. The last time this top was touched was in May of this year. Since this is the third major technical run at a 560 top this year, it should present very hard resistance. However, after the middle of this month, barring any serious political problems, we think a newer and higher price could be posted in January. Traders should be wary of a selling event next month near January 15th or 30th for this market and all of the broader stock markets. Nasdaq 100 Index: Closed at 2191.17 +5.87 as price approaches a new double top at 2200. Price is above all moving averages and channel lines. Volume was about 95% of normal on newly supported momentum. Price has a big gap between 2130-2150, which might be filled on a corrective pullback. Volumes have not been robust of late signaling waning interest in buying stocks until perhaps later in December. This does not mean a selling cycle yet but rather we could see another week of channeled choppy trading. We know the support and resistance points on this market as we watch it often as a leading market indicator. We forecast resistance at 2200 and again at 2250. Doubts are powerful as to whether the Nasdaq can break up and through 2250 before a January correction begins to take hold. 30-Year Treasury Bonds: Closed at 124.53 -0.31 as bonds continue sell-off in a bad global market. Price has now fallen through one major channel line and all moving averages. Momentum is already in the basement on the index at -1.00. There is not a lot of room to fall further but we say prices will do exactly that. Resistance is now the 200-day average at 125.15 above today's close. The next key support levels are 122.50 and 121.50. The line in the price sand signaling a stronger selling event is 120.00 and that is our lower price forecast for this month. Bill Gross at PIMCO, the giant bond trader called a sell on his own fund. And just today Paul Mcculley, another top executive at PIMCO announced retirement moving to a job in think tank. He has just quit active trading. This tells us exactly where bonds are going and confirms our longer view forecast. We say not only is the USA bond market in trouble but its spreading globally as whole nations go broke along with states, counties, and municipalities. Thank you, Mr. Bernanke for this massive credit destruction. Gold: Closed at 1414.60 +29.70 rising through a bear double top near 1407 headed for 1424-1448 next higher resistance. After the next top is found perhaps as early next week, we forecast gold will correct back to 1348. The market then should trade between 1348 to 1448 until (1) a major breakout occurs created by an unknown market event or, (2) the beginning a of a new rally in the first week of February. For now, gold is expanding with more buyers on fears of return of capital and primarily a dysfunctional bond market. As Europe continues toward a systemic breakdown, we say pressures will be to the buy side overall. Silver: Closed at 29.36 +0.84 on a breakout stronger and more powerful than gold's. Resistance is the technical 30.18 and support is 28.85. Momentum is peaking and turning sideways after a fine rally. Silver coin sales are setting new records and more traders are opting to take physical delivery. Our coin dealer reports heavy buying but has seven sources for the metals and says he can deliver. All of our spread trading positions for silver and gold in 2011 are nearing their goals. We are currently on the second cycle purchase of May, 2011 silver spreads, the first having achieved our goals and is closed with gains. Watch for silver to touch 30.18, stall and sell mildly on a normal correction. Our deepest correction for the first half of 2011 is $25.00. This market is doing so well we have to hurry and produce new technical work finding price points from 30.18 to 50.00 coming in 2011. Gold & Silver Index XAU: Closed at 225.27 +4.44 with momentum beginning to support and rise again after going flat for most of 60 days. On the down side, this chart is showing a new double top. With the vertical buying during the last four trading sessions price could (1) stop at 225.00 and mildly correct or, (2) regain some strength with other shares and breakout above 225 to something higher. Support is 221 and resistance is 225.00. The most important signal is the metal to shares ratio and so far it's showing straight up. U.S. Dollar Index: Closed at 79.17 -1.13 after topping out this week near 81.50 resistance. The price of 80.00 is the magnet number for many years for the dollar. While the price is on or near all three moving averages, we expect the dollar to cling to those numbers of 79.34-20-day, 79.10-50-day, and 80.49-200-day. Watch for the dollar to trade between 78.50 and 80.50 for most of this month. However, when the bonds continue to give bad news and sink toward 120.00 on the 30's, the dollar has less support and will mildly sell more. Crude Oil: Closed at 89.31 +1.30 as price has broken through, out and above a potential double top at 87.50. Momentum is up and price is above all moving averages. We think this rapid price pressure is not so much on supply fundamentals but on pure Bernanke induced inflation. Middle Eastern producers wanted 80 over 75. Next they'll be saying we want 85 to 90. Goldman reported a new higher oil forecast for 2011 at $110. Ours was $108. I think before next year we are going to have to do new and higher forecasts beyond even those numbers. CRB: Closed at 315.10 +4.00 with peaking momentum in November. However, momentum has based and is beginning another rally. Oil is half the CRB and the oil price is rising fast with most other commodities. We see a hard rally but suggest 320 is also shorter term resistance. That number is also a double top. If crude oil breaks through 92.50 and we think it does, the CRB should rise beyond 320. We expect this later in this month of December. Our CRB forecast for the year-end is 340 or better. -Traderrog        This posting includes an audio/video/photo media file: Download Now | ||
| Silvers 1980 Record Nominal High Targeted by Hedge Funds and Investors Posted: 08 Dec 2010 01:35 AM PST gold.ie | ||
| SLV 'Tonnes in the Trust' Back at Record High Posted: 08 Dec 2010 01:25 AM PST  Tim Iacono submits: Tim Iacono submits: The price of silver is recovering today after being whacked to the tune of almost $1.50 an ounce yesterday, however, you might want to check back in after another ten minutes or so as metals markets have become increasingly volatile, dollar or more moves up and down for the poor man’s gold now becoming a common occurrence. The iShares Silver Trust ETF (SLV) continues to add metal to its trust and trading volume continues to rise, 69 million shares exchanging hands yesterday. Complete Story » | ||
| This country's problems could dwarf the euro crisis Posted: 08 Dec 2010 12:11 AM PST By David Galland, Managing Director, The Casey Report: ... [E]ven though Japan has managed to stay off the radar of the mainstream financial media, the country's economy is in a real mess. And for the record, the U.S. is in no great shakes, either, not when you consider the neighborhood it's in, in the above chart. As we have discussed at length in The Casey Report, while the eurozone is back in the soup just now, Japan could very well be the next black swan to lay an egg on the global economy. Heretofore, Japan has been able to avoid the worst consequences of its many debts and obligations – but that may soon change. In addition to the exports referenced above, the country's high internal savings rates have provided crucial support for the Japanese government's energetic issuance of debt at low rates. But as you can see... Read full article... More on Japan: Top Chinese economist: U.S. is riskier than Japan The terrible lesson America should learn from Japan... but won't New Japanese Prime Minister warns country is at "risk of collapse" | ||
| A must-read interview with resource legend Rick Rule Posted: 08 Dec 2010 12:10 AM PST From an interview with The Gold Report: Jeff Howard (CEO, Global Resource Investments): Rick, let's start with the precious metals markets because it's been a glorious time the last three months or so, and it may be a good opportunity to get your thoughts on where we're going from here. So starting with gold, you know we've always joked over the years that when you start reading about gold in the Wall Street Journal or the Los Angeles Times and you start hearing about it on CNBC, that's a sign of a market top, and that's kind of what's happening right now. It's a popular topic out there. However, the actions of central banks and the growing distrust of paper currencies suggest that the strength in gold may continue for much longer than what we've seen in the past. So, what's your take on the future direction of gold prices? Rick Rule: Well, sadly... Read full article... More from Rick Rule: Rick Rule: Oil supply outlook "positively scary" Doug Casey and Rick Rule: How to invest for the End of America Rick Rule: Gold stock investors could make a fortune in the next 5 years | ||
| Posted: 07 Dec 2010 11:28 PM PST Precious metals seemed to have run out of steam in Tuesday trading. At least temporarily. Both gold and silver cut new highs in early trading only to get knocked back sharply during the New York session. Meanwhile, the largest silver exchange traded fund added quite a bit more new silver. Lots of different markets showed patterns traders call "outside reversals" or "exhaustion reversals" and other kinds of reversals, meaning simply that the issues traded to new highs then sold off and then traded to lower lows than the day before. Gold, silver, platinum, palladium, oil … pick one. They all turned on the proverbial dime. ... | ||
| Posted: 07 Dec 2010 10:08 PM PST The Confiscation Con * by Peter Schiff * December 03, 2010 If you've spent enough time in the gold community, you might be under the impression that the most imminent threat to the average American isn't terrorism or unemployment, but gold confiscation. Starting with the fact that FDR confiscated gold during the last Great Depression, and continuing to the quite accurate forecast that we are headed into an even Greater Depression, unscrupulous coin dealers have been pushing investors to buy expensive "numismatic" or "collectible" coins they claim would be protected from government seizure. The only problems are that the original motive for confiscation no longer applies and the "protection" offered by major coin dealers wouldn't actually help you keep your gold. THE TYRANT'S ORDER In 1933 President Roosevelt issued Executive Order 6102, prohibiting the private holding of gold and requiring U.S. citizens to turn over their gold bullion or face a $10,000 fine ($167,700 in today's dollars) or 10 years imprisonment. For private citizens, the order listed the following exemption: Gold coin and gold certificates in an amount not exceeding in the aggregate $100 (about 5 troy ounces at that time) belonging to any one person; and gold coins having a recognized special value to collectors of rare and unusual coins. Seizing on this "rare and unusual" language, many coin dealers try to convince unsuspecting customers that regular bullion coins are not safe, and that it is worthwhile to pay extra for "numismatic" or "collectible" coins that would be exempt from a Roosevelt-style confiscation. CALL THE MYTHBUSTERS The reality is that almost all coins sold as "numismatic" or "collectible" are really quite ordinary coins sold at high mark-ups to make these dealers extra profits. If we were in 1933, these coins would absolutely not fall under the definition of "rare and unusual." True numismatics are extremely rare or one-of-a-kind coins that collectors purchase for their historical and aesthetic qualities. These coins might retail for $100,000, while only containing $1,400 worth of gold. Most dealers charge a huge premium, so the coin may have to appreciate 30-50% before the buyer can even hope to make a profit. It is a speculative endeavor, and one that is likely to get even riskier as the U.S. descends further into economic depression. True numismatic coins, like pieces of high art, do well in good times, when people are getting richer and adding to their collections. In bad times, collectors are forced to sell because they need cash. With many collectors in the same boat, prices plunge. Even if the value of the gold in the coin rises, the gold content is only a small fraction of the coin's value. Since premiums are contracting, the value of the coin falls. So, if you are buying gold due to fear of an economic collapse, you should buy bullion, not numismatics. WHY WAS GOLD CONFISCATED? In 1933, when Roosevelt issued his infamous order, the United States was still on a gold standard, meaning every 20.67 paper dollars could have been "redeemed by the bearer on demand" for a troy ounce of gold. Since Roosevelt had many public works projects to finance and also may have wanted to quietly lower real wages to drive employment, he confiscated gold and then devalued the exchange rate to $35/oz (at this point, the only people who could "exchange" were foreign governments). Thus, Americans instantly saw a 40% drop in value for the dollars they held, and the government's profit was sequestered in something called the Exchange Stabilization Fund, which could be used by the President at whim without Congressional approval. Pretty nifty trick, huh? It's important to note that confiscation was necessary to Roosevelt's plan because we were under a gold standard. Gold at that time was widely held throughout the population. If Roosevelt had devalued the dollar without confiscation, then whatever savings Americans held in gold would have been immune from this hidden tax. Furthermore, many Americans likely would have redeemed whatever paper dollars they held in fear of another devaluation. This could have wrecked the dollar's viability as a currency. These rationales no longer apply. In the aftermath of Roosevelt and Nixon's dismantling of the gold standard, gold is no longer currency. Most Americans hold their savings in dollars and it is the only legal tender (which means it must be accepted in payment of all debts). Thus, President Obama and his buddy Bernanke don't need to confiscate gold to devalue the dollar and finance excessive spending. In fact, the Fed has more than doubled the monetary base since the financial crisis started. WHAT, ME WORRY? The only time to fear confiscation is when the federal government is in default and needs the gold in order to pay off its creditors. But if it comes to Washington simply stealing our assets at whim, then why would gold be the only target? At that point, real estate, stock and bond certificates, and vehicles would be much easier to seize. Gold has been prized throughout history for its high value-to-weight, making it easy to conceal and trade under tough political conditions. Consider: you could store enough gold to care for a small family for six months (approx. 9 ounces) on the inside of a belt buckle. Remember, if Washington chooses the confiscation route, we're talking about a situation of pure pandemonium. When governments begin abrogating property rights in that fashion, the entire market mechanism ceases to function. We saw this in the Great Depression as Hoover and then Roosevelt relentlessly attacked private property and contracts. If the situation really gets this bad, you aren't going to trust some government agent with the intelligence of your average TSA officer to judge whether your coins are "numismatic" enough to be exempt from confiscation. The best protection in this case would be to have your gold stored safely at home or offshore (not in a safety deposit box at a bank, where it is more likely to be seized). Even in the heat of Roosevelt's confiscation scheme, government troops did not break into people's homes. The singular (failed) prosecution under the order took place when a New York lawyer tried to withdraw 5,000 troy ounces from Chase Bank. Ironically, all the gold actually collected by the Treasury was willfully surrendered in a wave of misguided patriotism, while many "law-breakers" simply kept their gold—which is why some old coins escaped the Treasury's furnaces and are still around today. SHOP SMART The bottom line is that unscrupulous dealers use the threat of confiscation as a scare tactic to get you to buy gold coins at mark-ups well above the spot value of the metal they contain. While investors buy physical gold for many reasons—lack of counterparty risk, financial privacy, portability, etc. —it is principally a store of value, a way to protect your wealth from the relentless devaluation of fiat currencies. Your goal as a buyer is to get the most gold possible for your money, from a dealer you trust. The dealer should make the process transparent and easy to understand, and deliver a genuine product at the agreed-upon price. I don't recommend numismatic coins. To put it simply, I think they are a poor investment option. Peter Schiff is an investment advisor, financial commentator and author of Crash Proof and the recently released illustrated fable, How an Economy Grows and Why It Crashes. http://prudentbear.com/index.php/gue...w?art_id=10475 | ||
| December 7, 2010 -- A Day Which Will Live in Infamy Posted: 07 Dec 2010 08:46 PM PST SLV ETF adds 4.0 million ounces of silver. Who was the big silver seller in New York electronic trading yesterday afternoon? Nazi Propaganda Minister, Dr. Joseph Goebbels, speaks the truth... and WikiLeaks' Julian Assange would agree with him... and much more. ¤ Yesterday in Gold and SilverThe gold price didn't do much of anything during Far East trading on Tuesday... but, an hour after London opened, the gold price began to move higher... with the rally lasting until about 8:45 p.m. in New York when the selling began. A dollar rally began in earnest about fifteen minutes later at 9:00 a.m. Eastern time. It was, as they say, all down hill from there... with an extra shot coming to the downside in electronic trading well after Comex trading was done for the day. Gold closed above $1,400 spot... but just barely. From its high of the day [$1,432.50 spot]... to its low of $1,395.10 at 4:15 p.m. Eastern time... the gold price got clocked for $37.40.
But, the big hit was saved for silver... which, by now, should be no surprise to anyone. After doing nothing in Far East trading, silver began to rise steadily right from the London open at 8:00 a.m. GMT... hitting its high of the day [$30.73 spot] at the same second that gold did... about 8:45 a.m. in New York. By mid-lunchtime, silver was down a dollar... and then got absolutely slaughtered in electronic trading, about an hour after the Comex closed. The silver price dropped over a dollar in just over an hour... with its low of the day at $28.46 spot. During a seven and a half hour period, silver got taken down $2.27 cents!
Except for the take down the Friday afternoon after the U.S. Thanksgiving holiday, this had to be the most egregious example of silver price management I have ever seen... especially the dollar plus take down in electronic trading, where there was virtually no volume at all. Ted Butler is not entirely sure who the culprit was yesterday. He didn't get the impression that it was all the bullion banks doing. He suggested that it might be high frequency traders unwinding a position... as silver volume's have been enormous lately, with very few changes in open interest. As I mentioned in this column yesterday, silver was 'in play'. The other thing that Ted mentioned was the possibility that, with huge margin calls going out at the close of Comex trading, the price was taken down below Monday's opening price to prevent that from happening. But that doesn't explain who butchered the price between 3:20 p.m. and 4:20 p.m. yesterday afternoon. But, regardless of all of the above, what happened yesterday was, as Ted put it, the most rigged commodity in the world, being aided and abetted by the crooks at the CME. The exchange and the CFTC should be all over this type of blatantly illegal market activity... but, knowing them, they won't do a thing. And neither will your silver companies. The world's reserve currency fell about 40 basis points up until 8:45 a.m. Eastern time Tuesday morning. All of gold and silver's big gains of yesterday came between 3:00 a.m. and 8:45 a.m. Eastern time, as the dollar fell 18 basis points during that period. From that 8:45 a.m. time, the dollar began to work higher... and reached its absolute high at the close of electronic trading at 5:15 p.m. late Tuesday afternoon... up 77 basis points. During the New York trading session, both gold and silver had their big losses between 8:45 a.m. and 12:30 p.m. During that time, the dollar had risen less than 30 basis points. The big smack-down in both metals in electronic trading occurred in an 80 minutes period between 3:00 p.m. and 4:20 p.m. During that time period, the dollar fell 10 basis points. Was yesterday's dollar move in any way related in severity to the drop in price in both metals? Absolutely not. The only thing that is for sure, is that the precious metals sell off... and the dollar rally... began at the same instant... and there wasn't a damn thing in the real world of supply and demand to warrant the price action. It's amazing to watch JPMorgan et al [if it was all them] pull this stunt with all the lawsuits they have pending against them. We had an 80 point rally in the dollar on Monday and virtually nothing happened, so why would Tuesday's 77 point rally be any different? Well, maybe 'da boyz' were celebrating the 69th anniversary of Pearl Harbor at the expense of the precious metals.
The gold stocks headed for negative territory the moment that equity trading began at 9:30 a.m. And, in actual fact, the precious metal stocks were recovering quite nicely until the plug got pulled shortly before 3:00 p.m. Eastern time. The HUI, which was down 2.45%, finished on its absolute low of the day. But, all things considered, it could have been far worse. Of the 67 stocks I track, there were actually 6 of them in the green at the close of trading... and a couple of them were silver stocks!
Yesterday's CME Delivery Report showed that 68 gold and 22 silver contracts were posted for delivery on Thursday. The link to that action is here. Over at the GLD ETF yesterday, there was a tiny withdrawal of 9,763 ounces. However, it was an entirely different story over at the SLV ETF... where they reported receiving a staggering 4,007,652 troy ounces of silver. Ted says that despite yesterday's crucifixion, the SLV ETF is still owed a lot of silver. The U.S. Mint had no sales report. It was a busy day over at the Comex-approved depositories on Monday. At the end of the day, they reported a net withdrawal of 340,877 ounces of silver. There was activity in all four warehouses... and the report is worth looking through. The link is here.
¤ Critical ReadsSubscribeEuro collapse 'possible' amid deepening divisions over bail-outI don't have many stories for you today which, after yesterday's deluge, is just fine by me. My first two stories are ones that I stole from yesterday's King Report. The first is from The Telegraph... and was posted in the late evening on Monday. The headline reads "Euro collapse 'possible' amid deepening divisions over bail-out". 'It is feasible that the euro will not survive the current sovereign debt crisis sweeping Europe, one of the Treasury's leading independent forecasters has said.' This is, of course, no surprise at all. The link to the story is here.  Britain is Freezing to DeathThe second story that I filched from the King Report is this story on global warming... and how its affecting Britain this winter. Middle class families are among millions of Britons who cannot afford to heat their homes this winter, as elderly ride on buses all day to stay in the warm. After a week of snow and freezing temperatures, a shocking picture has emerged of the bleak months ahead for 5.5 million households that are now classified as "in fuel poverty". The headline reads "Britain is Freezing to Death"... and the link is here. The video and the pictures are worth the trip.  WikiLeaks, 1941Just as I was editing this column, I received an interesting piece from reader G.G. It was rather serendipitous for this article to show up on this day, considering that I had already selected the title for my column this morning. Since it's not precious metals related, I'll slide it in here. It's a posting over at chroniclesmagazine.org... and is written by Dr. Srdja Trifkovic. The headline reads "WikiLeaks, 1941". I'm intimately familiar with everything in this story, as I've read Robert Sinnett's classic novel Day of Deceit: The Truth About FDR and Pearl Harbor a couple of times. The link to the essay is here... and I consider it a must read.  Silver Seven Stock Index and PM Funds IndexBefore posting my small handful of precious metals-related stories... here are a couple of 'feel good' graphs that Nick Laird from sharelynx.com slid into my inbox late last night. His comment, that accompanied both graphs, read as follows... "Here's the Silver 7 & PM Funds Index - you can't even notice yesterday's hit." Here's the "Silver Seven Stock Index" graph...
Here's the "PM Funds Index" graph...
 Tax issues in moving or exchanging precious metalsToday's first story is a GATA release that's headlined "Tax issues in moving or exchanging precious metals". I'm sure that this essay only applies to American citizens... and I suggest that if you have any questions in this area, that you consult your accountant. Chris Powell provides the preamble... and the link is here.  New large-format 'America the Beautiful' silver coins in demandHere's another GATA release of a story out of yesterday's edition of The Wall Street Journal. The headline reads "New large-format 'America the Beautiful' silver coins in demand". These are 5-ounce rounds that has taken the U.S. Mint ages to produce. I'm not surprised at the interest... and I would guess just by looking at the mintage numbers, that getting your hands on one of these will be a pricey proposition... if you can even find one. The story is well worth the read... and the link is here.  Gold, Defaults & A New Brady BunchBen Davies, CEO of Hinde Capital, has posted a rather longish blog over at King World News that's headlined "Gold, Defaults & A New Brady Bunch". Ben compares the European central bankers to parachutists who "zone out" and forget to pull their ripcords. But, as the euro falters amid overwhelming debts, Davies writes -- Europe still has available to it a unifying currency -- the old one, gold. The link is here.  The Road AheadMy last offering of the day is an essay that silver analyst Ted Butler wrote years ago... and it's just as relevant now as it was back then. It's dated July 5, 2006... so we're talking four and a half years. As important as Ted's commentary is... the letters written by Carl Loeb to the SE | ||
| Posted: 07 Dec 2010 08:46 PM PST Link: Image:  My last offering of the day is an essay that silver analyst Ted Butler wrote years ago... and it's just as relevant now as it was back then. It's dated July 5, 2006... so we're talking four and a half years. As important as Ted's commentary is... the letters written by Carl Loeb to the SEC, CFTC, and the House Committee on Financial Services, that are imbedded in this essay... are equally as important. The essay is headlined "The Road Ahead"... | ||
| Gold, Defaults & A New Brady Bunch Posted: 07 Dec 2010 08:46 PM PST Image:  Ben Davies, CEO of Hinde Capital, has posted a rather longish blog over at King World News that's headlined "Gold, Defaults & A New Brady Bunch". Ben compares the European central bankers to parachutists who "zone out" and forget to pull their ripcords. But, as the euro falters amid overwhelming debts, Davies writes -- Europe still has available to it a unifying currency -- the old one, gold. The link is here. | ||
| Silver Seven Stock Index and PM Funds Index Posted: 07 Dec 2010 08:46 PM PST Image:  Before posting my small handful of precious metals-related stories... here are a couple of 'feel good' graphs that Nick Laird from sharelynx.com slid into my inbox late last night. His comment, that accompanied both graphs, read as follows... "Here's the Silver 7 & PM Funds Index - you can't even notice yesterday's hit." Here's the "Silver Seven Stock Index" graph...
| ||
| New large-format 'America the Beautiful' silver coins in demand Posted: 07 Dec 2010 08:46 PM PST Image:  Here's another GATA release of a story out of yesterday's edition of The Wall Street Journal. The headline reads "New large-format 'America the Beautiful' silver coins in demand". These are 5-ounce rounds that has taken the U.S. Mint ages to produce. I'm not surprised at the interest... and I would guess just by looking at the mintage numbers, that getting your hands on one of these will be a pricey proposition... if you can even find one. The story is well worth the read... | ||
| Euro collapse 'possible' amid deepening divisions over bail-out Posted: 07 Dec 2010 08:46 PM PST Image:  I don't have many stories for you today which, after yesterday's deluge, is just fine by me. | ||
| Global Macro Notes: Beware the Rip Currents Posted: 07 Dec 2010 08:16 PM PST
In an ocean or large lake, a rip current is "a strong channel of water flowing seaward from near the shore." In markets, a rip current could be classified as a submerged theme or trend the market is ignoring, that yet could suddenly and violently return to the fore. Just as ocean rip currents can drown careless or inexperienced swimmers, so too can market rip currents drown careless or inexperienced investors. At moment the "rip current" potential for this market is very, very high, due to all the developing themes the market has chosen to (temporarily) dismiss out of hand:
We maintain that 2010 markets have been excellent for traders, but hazardous to those without fluid timing and a strong handle on risk control. As Jon Kabat-Zinn observes, "You can't stop the waves, but you can learn how to surf"…
We'll dive in with a look at the S&P. What you see above is an S&P weekly chart, inlaid with a one day 5 minute chart. Given the positive developments of recent weeks, the bulls have largely assumed they are home free, with growing expectations of a rally that extends well into 2011. This remains a dangerous assumption. On Tuesday (December 7th), U.S. equities roared at the open on news of an Obama-GOP tax cut deal. But after sending the S&P to fresh 2 year highs, the rally fizzled (as you can see from the 5 minute chart). Major new highs and lows, especially in conjunction with support or resistance on the weekly charts, have a good track record as potential inflection points. To be turned back here would be an ominous sign. The bulls need to clear this hurdle, and they need to do it soon. If the S&P can pick itself up and grind higher in short order, then perhaps all will be well. But if not, the threat of a weekly double top still looms, underscored by the implied failure of bulls to carry through on excellent news (the likelihood of tax extensions). On the strategic side of things, it is further interesting to note the growing divide between President Obama and his political power base. Many Democrats were infuriated by Obama's willingness to "sell out" to Republicans, particularly on estate tax details, and are whispering of revolt. More rip current potential there, especially if priced-in tax cut expectations are suddenly reversed. Winston Churchill: "There is no worse mistake in public leadership than to hold out false hopes soon to be swept away."
Another reason for Tuesday's disconcerting equity fade — the horror show in bonds. U.S. treasuries plummeted on renewed concerns over government debt levels. 10-year yields rose the most in 18 months, and long bonds were similarly crushed. Between tax cuts and open-ended hints at more QE, bonds are in a terrible position. And of course, as treasuries fall interest rates rise, putting further pressure on the anemic-at-best recovery. We were short USTs prior to Tuesday's meltdown, having made the call last week.
Another notable aspect of Tuesday's action was the big reversal in precious metal miners. After pushing $30 an ounce, silver futures saw a blood-red turnaround on the day, and PM names followed suit. In the Mercenary portfolios, we were fortunate to have booked half profits on two of our open gold and silver positions (GDXJ and SSRI as shown) on Monday and Tuesday. The timing was most fortuitous, though not explicitly planned to catch the top. It is standard practice for us to take half profits at pre-established volatility targets. This half profit target (HPT) practice has many benefits: It helps smooth the equity curve via more routine profit distribution, frees up incremental capital for new positions, and creates a psychological cushion for our second half long-term trend positions. The GDXJ pyramid point was mentioned in the public post stream. All trades are documented by third-party executing broker and also in the Live Feed archives.
We remain long the $USD (via UUP) from significantly lower levels and short China (via FXI) from significantly higher levels. The $USD and China trades are a powerful illustration of half profit target (HPT) logic at work. Had we not taken partial profits on these positions, it would have been psychologically much harder to endure the volatility of recent weeks (and the risk of giving profits back). Now the $USD and China are both setting up for fresh pyramid opportunities. (To pyramid is simply to add to an existing position, sometimes in size.) The $USD chart is not registering a traditionally bullish pattern, but one must consider what is happening in Europe. In a nutshell, it is slowly dawning on investors that Europe has no way out of its current mess other than mass-monetization of EU periphery debt. Germany may talk of walking away, but that isn't a truly palatable option for multiple reasons. Nor is a single-country periphery default, as if one goes down the others follow like dominos. Default and departure options blocked, that leaves monetization — a path that lets the euro survive as a currency, but only at the cost of violent devaluation. EUO, the ultra-short Euro ETF, is another potential way to play this trade (for those not inclined to futures or forex). And as for China, we have already made that case — nothing has really changed there, other than Mr. Market temporarily focusing more on "Bernanke" than "Beijing." (Perhaps the first official rate hike will change that?) Keep an eye on China, the $USD, precious metals and the S&P. And by all means, don't be complacent about risk — not now, especially not now. If markets roll over, the bears could strike fast and hard (and we will be among their number). JS  | ||
| From Bad To Worse: The Economy Today, And Tomorrow Posted: 07 Dec 2010 05:51 PM PST Quote: By Giordano Bruno Neithercorp Press – 12/07/2010 At first, we were told the American economy was a freight train; invincible. After the derivatives and mortgage crisis began in 2007-2008, we were told the problem was a mere blip in our financial timeline; nothing to be concerned about. In 2009, we were told that the recession was over, and that "green shoots" were on the way. Later, they said we were "turning the corner", whatever that means. In 2010, we were told it was time to get used to the "new normal", which of course has yet to be clearly defined. Now, at the cusp of 2011, the year which many establishment economists originally claimed would bring a bright new era in U.S. employment and finance, it has become clear to much of the public that we are being deliberately herded with empty words and false promises towards a very dangerous and uncertain future. We have discovered that there is no "new normal". The word "normal" denotes a certain consistency, a set of rules to the system which are generally understood, yet we have seen nothing consistent except the continued downward freefall of our fiscal infrastructure and the end of anything remotely resembling stability. I feel quite a bit of empathy and maybe even a little remorse for those who blindly believed the mainstream nonsense of the past few years. I can't imagine being so lost and so utterly disappointed on such a regular basis. The only good to come out of this dashing of false hopes is that it has caused many to begin questioning what the hell is really happening. Why have things only become worse? What about all the government legislation and stimulus? When is it finally going to produce the effects that were once guaranteed? In fact, what are the benefits of ANY action the government or the private Federal Reserve has taken so far?...(Read on at the source...great article.) Source: http://neithercorp.us/npress/?p=960 | ||
| Gold Holds Near Fresh USD, Euro and GBP Records, “Silver Action Very Bullish” Posted: 07 Dec 2010 04:31 PM PST
| ||
| Posted: 07 Dec 2010 04:14 PM PST Dec 7, 2010
Special Offer For Website Readers: Send me an Email to freereports4@gracelandupdates.com and I'll rush you my free "Three For Me!" report! The 3 silver companies in the SIL-nyse that could quadruple on the gold move to 1624! I'll include coverage of the SIL itself as well! Thanks! Thank-you Graceland Updates 4am-7am Email: Stewart Thomson / 1276 Lakeview Drive / Oakville, Ontario L6H 2M8 Canada Risks, Disclaimers, Legal
| ||
| These Charts Suggest Gold and Equities Going Higher into 2011 Posted: 07 Dec 2010 04:10 PM PST
By: Nu Yu, Ph.D. with Lorimer Wilson
Gold: Forming A Long-Term Bump-and-Run Pattern 1. A lead-in phase in which a lead-in trend line connecting the lows has a slope angle of about 30 degrees. Prices move in an orderly manner and the range of price oscillation defines the lead-in height between the lead-in trend line and the warning line which is parallel to the lead-in trend line. 2. A bump phase where, after prices cross above the warning line, excessive speculation kicks in and the bump phase starts with fast rising prices following a sharp trend line slope with 45 degrees or more until prices reach a bump height with at least twice the lead-in height. Once the second parallel line gets crossed over, it serves as a sell line. Gold currently is in the bump phase, and its uptrend may continue as long as prices stay above the $1350 sell line. 3. A run phase in which prices break below the sell line often causing a bearish reversal to happen. Overall Stock Market: Sideways Pattern About to Move Higher? Based on the forecast of the LWX indicator, the market could enter a neutral time-window that could last weeks until higher market volatility is released. However, if the Wilshire 5000 index breaks through the resistance at the upper boundary of the horizontal channel, the market could become very bullish with the reason that will be explained in the next section below. S&P 500 Index: Continuing Bullish Pattern – to 1440 (and 13245 for the Dow)? Chinese Stock Market Pattern: Testing 17-Week Moving Average on Way to 4200? Which Developing Chart Pattern Do You Intend to Take Advantage Of?
| ||
| YOU AIN’T SEEN NOTHING, YET: HUI About to Begin Its 3 OF III Momentum Run! Posted: 07 Dec 2010 04:06 PM PST YOU AIN'T SEEN NOTHING, YET: HUI About to Begin Its 3 OF III Momentum Run! By: Goldrunner www.FinancialArticleSummariesToday.com We appear to be at the 3rd wave juncture where the large cap producer gold and silver stocks and intermediate precious metals producer/developer stocks tend to start to move much better - and where the smaller explorer class starts to kick up its heels. Let me show you what I mean with a few charts that will give you a clear visual of why "you ain't seen nothing, yet" when it come to the future performance of the stocks (and warrants) of gold and silver mining and royalty companies.
| ||
| The Key Relationship between US Real Rates and Gold Prices Posted: 07 Dec 2010 04:04 PM PST Gold investors tend to focus overwhelmingly on the relationship between the US dollar and gold, citing that a lower dollar leads to higher gold prices in US dollars. Whilst this may be generally true, there is another relationship that does not get as much attention as we believe it deserves, and that is the relationship gold has with US real interest rates. For the first few years of this gold bull market, it was sufficient simply to acknowledge the USD down, therefore gold up dynamic, but now things have changed. Over the past couple of years gold has rallied when the greenback has been making gains, as well as when it was weakening, therefore investors must now take note of the inverse relationship between US real interest rates and gold, which has been observed consistently over the last couple of years. The basic fundamentals behind this inverse relationship are that when US monetary policy is looser, real rates fall and therefore investors buy gold for a number of reasons. Firstly, lower real rates could imply higher inflationary expectations in the future therefore gold is bought as a hedge against this possible inflation. Secondly, lower real returns in Treasuries drives investors into risk assets in search of a higher return. This also sends gold higher but it also sends most commodities, risk currencies and equities higher too. Thirdly, lower real returns on Treasuries reduce demand of US dollars, causing the dollar to fall and therefore the gold price to rise in US dollars. Finally, looser monetary policy implies that the economic situation is not as rosy as many would like to believe, so if the Federal Reserve acts by loosening monetary policy and driving down real interest rates then that send a message that the economy is in a bad place therefore investors buy gold as a safe haven asset. There are probably many more reasons for this relationship, but we have just tried to cover the main ones.
Whilst this inverse relationship is not perfect, it does have a distinct theoretical advantage over simply watching the USD versus gold relationship as sometimes both US dollars and gold can be in demand as safe haven assets. For example if there were to be a crisis, such as the recent sovereign debt issues in Europe, money would flow into gold in search of a safe haven, but also into dollars to escape the European issues. Investors would sell European bonds driving their yields higher, and buy US bonds driving their yields lower. Gold would be rising and the US dollar would be rising, negating their usually negative correlation. However US rates would be falling as investors bought treasuries as a safe haven and therefore the inverse relationship between gold and US treasury rates would hold firm.
The theoretical aspects of this may all be well and good, but what really matters to investors and traders such as ourselves is how these theories can be applied in the real world, and how effective they are in producing profitable signals to trade from. So here is a practical example of how we applied and profited from this relationship in the real world. In late August 2010 we noticed that US real rates were falling far more rapidly that gold prices were rising. We also held the view that the Federal Reserve was going to embark on another round of quantitative easing within the next three months, therefore we did not see US real rates rising, given that the Federal Reserve would likely begin buying bonds heavily. From this we inferred that gold prices we set to stage a major rally to a new all time high, so signalled to our subscribers to buy a great deal of out of the money GLD call options to benefit from this rise (more details can be viewed in our full trading records, which is published on our website). We banked profits in percentage terms, ten times higher that the gains made by gold or the HUI gold mining index during that period, and when the market began to price in QE2 and US real rates fell further we bought again and enjoyed a similar return. We are now of the opinion that US real interest rates are still too low in relation to the current gold price and therefore see the gold price going still higher to $1500. Of course this works both ways, so if US real rates begin rising there would likely be a serious correction in gold. We are monitoring this situation closely and adjusting our position (and that recommended to our subscribers) accordingly, but the main purpose of this article is to draw investor's attention to this relationship and suggest that it form a pillar of your fundamental analysis with respect to gold. This is not to say other relationships such as the USD and gold are not to be noted, they should be, but in conjunction with US real rates. By pulling all these relationships together one can get a better picture of where the yellow metal is headed and when it is going to move, which ultimately leads to more profitable trading. As mentioned before, we are of the opinion that gold prices are heading to $1500, so if you would like to take full advantage of this then please visit our website www.skoptionstrading.com to sign up to SK OptionTrader, our premium options trading service that costs just $99. We have closed 55 trades with 53 winners, and an average gain of 45% per trade including the two losing trades. Our model portfolio has an annualised return on investment of 84.35% without reinvestment of profits. The charts in this article are plotted with the gold price in US dollars on the left axis and inverted US real interest rates on the right axis to show the negative relationship between the two. The US real rates data is taken from the US Treasury Real Yield Curve and are commonly referred to as "Real Constant Maturity Treasury" rates, or R-CMTs. Real yields on Treasury Inflation Protected Securities (TIPS) at "constant maturity" are interpolated by the U.S. Treasury from Treasury's daily real yield curve. These real market yields are calculated from composites of secondary market quotations obtained by the Federal Reserve Bank of New York. The real yield values are read from the real yield curve at fixed maturities, currently 5, 7, 10, 20, and 30 years. This method provides a real yield for a 10 year maturity, for example, even if no outstanding security has exactly 10 years remaining to maturity. Gold data is taken from the London Bullion Market Association. Source: The Key Relationship between US Real Rates and Gold Prices
| ||
| CA Fitz Report: Tax issues in moving or exchanging precious metals Posted: 07 Dec 2010 02:17 PM PST Tax issues in moving or exchanging precious metals 16-page report (free of course) Thank you Catherine! http://solari.com/articles/Tax_Issue...etals_Holdings | ||
| Posted: 07 Dec 2010 12:45 PM PST The price of gold held near last night's new record highs in US Dollars, Euros and British Pounds in London on Tuesday morning, recording an AM Gold Fix at $1426 per ounce as world stock markets gained more than 1.5%. Crude oil broke above $90 per barrel for the first time in over two years, and wheat prices hit a 4-month high. China's three largest gold mining stocks, Zijin, Zhongjin and Shandong, all rose more than 5%. "Gold doesn't provide diversification for an investment portfolio like it once did," reckons Citigroup chief US equity strategist Tobias Levkovich, quoted by the Wall Street Journal online, "because it rises and falls with other riskier investments." "We would reckon goldwill continue to be well-supported and lifted by worries about the Eurozone debt crisis as well as by furthertalk of QE2," counters a note from Swiss refiner MKS's trading and finance division. "As a matter of fact, we would expect these two elements to out rule year-end profit taking for the time being. Interest in the safe-haven appeal of the metal seems to be quite strong." Rumors of an imminent Chinese interest-rate rise were outweighed today in the gold market, says one global metals dealer, by the Reserve Bank of Australia leaving its target rate unchanged. Shanghai Securities News today reported that Chinese bank lending in Nov. reached the equivalent of $90 billion, already taking loan growth for 2010 above the government's full-year target. With savings-deposit rates now more than 2% below the rate of consumer-price inflation, China has fast become the world's No.2 source of physical gold demand. "I don't think China should increase interest rates on a continuous basis," says government-backed market economist Chen Kexin, because "such a move will definitely attract hot money inflows. For domestic inflation, it would be adding fuel to the fire" as banks collected more cash looking for a return from lending out. Asian trade overnight saw gold futures, silver and the other precious metals contracts "on offer" via the electronic Globex platform, says a Hong Kong dealer, but the overnight highs "were saved by a surging Euro." "Price action off mid-Nov.'s low [at] $1330 is impulsive in nature," says bullion market-maker Scotia Mocatta in its latest technical analysis, and so "the risk remains for a move higher in gold toward $1500." Silver price action "is very bullish." "Silver may well [rise further] because the trend is your friend right now," Tim Gardiner, head of precious metals worldwide at TD Securities, tells the Montreal Gazette. "[But] when I look at it fundamentally, you've got to shake your head a little bit. Are we really in that much of a mess that it should be over $30?" Monday saw the US Mint delay the launch of its 5-ounce silver bullion coin series, America the Beautiful, blaming high prices and public anticipation of higher prices in the resale market. "Due to the limited availability of the 2010 American the Beautiful silver bullion Coin coins, public anticipation has been extremely strong," the US Mint said in a memo sent to silver and gold coin dealers, quoted by CoinNews.net. "The Mint has received numerous calls and inquiries from the public regarding being charged for these coins. As a result, we are delaying the launch of this program." Meantime in Europe overnight, 16 ministers from the Eurozone member states adjourned their meeting to resolve the ongoing debt crisis without "any new decision to announce" according to Eurogroup chairman Jean-Claude Juncker. Due for presentation today, Ireland's new austerity budget – essential for the €85 billion aid package offered by other EU states and the International Monetary Fund – was expected to cut tax credits by 10%, social welfare payments by 5% and public-sector pensions by 5% amongst other measures. The gold price in Euros briefly dipped 1% this morning from last night's new record high above €34,475 per kilo. Government borrowing costs rose across the 16-nation currency zone today, as German Bun prices fell, nudging the benchmark 10-year yield up to 2.91%. US Treasury yields also rose as fixed-income investment prices slipped, nudging the 10-year yield back above 3.00%, a level last seen in July. Adrian Ash | ||
| The US Federal Reserve: A Bank that Will Live in Infamy Posted: 07 Dec 2010 12:44 PM PST "A day that will live in infamy..." - Franklin D. Roosevelt The Dow ended down 19 points yesterday. Gold up $9. Thanks to the socialist Senator from Vermont, Bernie Sanders, we get to see what the Fed is up to. He insisted on learning where the Fed's bailout money was going. Turns out, not only did billions go to European banks...billions more went to firms in the US that pretended they needed no help. Goldman Sachs, for example. Goldman went to the Fed 212 times between March 2008 and March 2009, according to Fed documents. It collected nearly $600 billion. Morgan Stanley. GE. Citigroup. They were all in on it. The Fed put out $3.3 trillion worth of credit, buying up speculators' bad bets. Not surprisingly, the price of the bad credits rose. So that now the Fed can say it hasn't lost a penny. Ha. Ha. What a sense of humor! Let's imagine that instead of banking and speculating...Goldman was a cabbage grower. And let's say Goldman overdid it. It planted far too much cabbage. The price dropped...and Goldman was on the verge of bankruptcy. So, in comes the Fed...and buys cabbage by the boatload. And what do you know? The price of cabbage goes up. So, the Fed then looks in its warehouse and it finds it owns tons of cabbage. It multiplies the price of cabbage by what it has in inventory. Wow! It hasn't lost a penny! (For more on the magic of modern central banking...see below...) The feds are supposed to pursue corrupt operators. But now the feds are at the center of the racket. Talk about infamy? Now, it's right here at home... How does the racket work? It's very simple. The Fed hands out money to its powerful cronies. Remember, the Fed is a private bank. It serves what is supposedly a public purpose. But it is neither owned nor controlled by the government. Instead, it's part of the banking industry. Its official role is to give the US a trustworthy currency...and (more recently) to promote full employment. You can see how well it fulfilled the fist part of its mission. Consumer prices are up about 33 times since the Fed was formed in 1913. Or, to look at it another way, a $20 gold piece from pre-Fed days - a one-ounce US gold coin - is now worth about $1,450. How's that for a stable currency? As to employment... Before 1913, unemployment was virtually unheard of. Why? There was a free market in labor. If you need to work, you took whatever work you could get at the then-prevailing wage. End of the story. There were no subsidies for people who were unemployed. No minimum wages. No safety nets. It was just supply and demand. When demand for labor increased, so did wages. When it decreased, wages went down. Except for brief periods of adjustment, there was no unemployment. And now? Well, you know the facts as well as we do. The Fed's real mission now is to make sure the banks stay in business and make a profit. This it does in the simplest way - by transferring money to the banks. How does it get the money? It just prints it up. Who pays the bill? Eventually, taxpayers and citizens...when this new money reduces the value of their old money. Neat huh? Who complains? Who has a cause of action? Who even realizes what is going on? The European Central Bank is duplicating this trick in the other part of the Old World. It is buying up the debt of Ireland and Greece. And what ho! The more you buy...the more the price goes up. Pretty soon, the ECB - with hundreds of billions of this paper in its vault - will be able to announce that it too has made money! But there's a strange smell coming from the central bank vaults. Maybe that cabbage isn't so good after all. And more thoughts... It says here in the Financial Review that Australia is boosting its exports of ore to China. It will export more than one billion tons per year. Wait a minute. At that rate there soon won't be anything left Down Under.... Elsewhere, the Financial Review's man on the scene in Manhattan tells us that "Jobs data spoils recovery hopes." "A painful reality check," he calls it. *** Melbourne is an agreeable place. We see it from the dining room...out across the river... There are polished steel and glass skyscrapers...gracious old buildings...tramways...and there is the Melbourne aquarium...a modernist white building with sails as an architectural motif. People come and go on their bicycles. And on the river, rowers add a Cambridge-like touch of civilized athleticism. It is nothing like Beijing or Mumbai. There is no hustle. No bustle. No noise to speak of. You can practically hear the rowers' oars as they break water on the Yarra River. Each person has plenty of space. You could drop a Congressman from a helicopter and not hit a single voter. It seems like a nice place to live...agreeable...calm...but prosperous. Melbourne's prosperity probably comes largely from selling off bits of Australia - by the pound - to China. When prices for metals are high, Australia rides hide. When they suddenly turn down, so do the faces of Australia's investors and businessmen. At present, prices for steel and other metals are high. So Melbourne is a happy place. Smart people save their money in the fat years, knowing that lean years cannot be far off. Currently, Australians are saving about 10% of disposable income. That's two to three times more than Americans. *** Colleague Justice Litle sent us this explanation of the modern, enlightened way to manage an economy:
Regards, Bill Bonner. | ||
| Raid on gold and silver/Bush tax cuts continue /unemployment benefits continue for another 13 months Posted: 07 Dec 2010 10:14 AM PST | ||
| Silver's 1980 Record Nominal High Targeted Posted: 07 Dec 2010 10:00 AM PST Gold and silver prices reached new record highs of $1,430.95/oz and 30 year highs of $30.68/oz respectively yesterday. It is important to remember that these are nominal highs of more than 30 years ago. | ||
| The S&P 500 & Gold Are in Last Rally Stages Posted: 07 Dec 2010 10:00 AM PST Gold completed its fourth wave corrective pattern at $1,331 per ounce recently and should continue its upward trajectory to about $1,480-$1,525 before a good sized correction. | ||
| Posted: 07 Dec 2010 10:00 AM PST Is there a recovery? Do you feel it, dear reader? Deep down in 'dem bones? We don't. We've explained the reasons why in dozens of articles: The fiat meltdown of 2008 was a meltdown of MONEY caused by the Internet's ability to expose the truth of a fraudulent central banking controlled monetary system and the power elite who benefit from the process of wealth redistribution. It was not caused by "faulty" economies specifically. It is the system itself that collapsed and at the base of it all is | ||
| What Happens When Currencies Go Bust? Posted: 07 Dec 2010 09:00 AM PST I was telling the doctor that I distinctly heard a popping sound inside my head when I saw that the foul Federal Reserve had created, last week alone, another $24.2 billion in Fed Credit, which was instantly turned into money when the Fed bought $24.2 billion of US government securities, and all in One Freaking Week (OFW)! It made a kind of "sizzling" sound. Furthermore, a tortured howl of outrage boils up inside me (which tastes surprisingly like stale beer and pepperoni pizza) at the Sheer Inflationary Horror (SIH) of this creation of $24.2 billion in new money in One Freaking Week (OFW)!! The doctor dismissed my complaint, but billed me anyway, although you can obviously see the seriousness of it by the use of two exclamation points, and by the use of another one at the end of this sentence used to explain the significance of the prior exclamation points! It's self-proving! Proving! Perhaps you are saying to yourself, "This seems to be important, as indicated by the sudden plethora of exclamation points, but for reasons which are not clear. Why am I wasting my time with this Stupid Mogambo Crap (SMC) anyway?" If you are, indeed, asking yourself such a question, then lean forward and look deep, deep, deep into my bloodshot-yet-limpid blue eyes to see my Utter, Utter, Utter Sincerity (UUUS) when I tell you that "When the supply of money goes up, prices soon go up." And since prices going up is just another way of saying that a currency is doomed, a reader, Chet, wrote to Casey Research and said, "I fear that the dollar is doomed as are other fiat currencies, and time is getting short. So the question that came to mind is, what happens if one is invested in metal stocks or any vehicle that is denominated in a fiat currency, and that currency goes bust, blotto?" As a guy who has been both bust and blotto many, many times, often at the same time, I deem myself somewhat of an expert on the topics, and so, without waiting for either David or Terry to give their response, I jumped up and replied, "What happens is that the price of everything adjusts according to supply and demand, just like everything else in the whole freaking world always does all the time, you moron!" Chet apparently did not like my unsolicited response, and continued as if I had not just explained it, "What value does that investment retain? Does it become a total loss? Redefined into the currency of the locality that operations are in? Converted into some other New World Order monetary unit, SDR's or nationalization of any regional assets by the locals? Is this impossible to plan for?" Growing more frustrated by the minute, again I interrupt and politely say, "What in the hell is wrong with you, ya dimwit? The price, in the local currency, of everything will adjust. If bread is $2 a loaf, gasoline is $3 a gallon and gold is at $1,400 an ounce, will you better off if bread is $40 a loaf, gasoline is $60 a gallon and your gold is selling at $28,000 an ounce, assuming that prices adjust perfectly in proportion to the loss of buying power of the dollar due to over-issuance?" Suddenly, I realized that the reason that Chet was ignoring me was that I was reading it on the computer, and people are looking at me while I am yelling at my computer screen, "Chet, you're an idiot! The answer is no; thanks to gold, your financial situation will be exactly the same in terms of loaves of bread and gallons of gasoline!" Embarrassed, I sat back down and pretended nothing happened, so that after a few minutes, everyone went back to work. I pretended to go back to work, too, but secretly I was thinking to myself, "While he will be unchanged, those who do not own gold, silver and oil will be worse off, even if temporarily offset by still having $1,400 in cash instead of an ounce of gold, and who will, in turn, be better off than the vast, overwhelming majority of the population who will be the worst off, as they do not have gold, nor silver, nor oil, and this is to say nothing of them not having $1,400 in cash!" Unfortunately, these poor people still have to somehow pay $40 for a loaf of bread and $60 for a gallon of gasoline. Welcome to the wonderful world of inflation! Hahaha! And the reason that you should be buying gold, silver and oil against the onslaught of the Federal Reserve and the federal government against the value of the dollar will become very clear, very soon. In the meantime, rest your pretty head, my darling Junior Mogambo Ranger (JMR), as all you need to do is buy gold, silver and oil at your leisure, which is so easy that you, too, will happily exclaim, "Whee! This investing stuff is easy!" The Mogambo Guru What Happens When Currencies Go Bust? originally appeared in the Daily Reckoning. The Daily Reckoning, offers a uniquely refreshing, perspective on the global economy, investing, gold, stocks and today's markets. Its been called "the most entertaining read of the day." | ||
| Gold Breakout in Real Terms Means Good Times are Ahead for Gold Bulls Posted: 07 Dec 2010 07:35 AM PST In past commentaries, I've written about my favorite form of technical analysis. That is intermarket analysis. Intermarket analysis takes traditional technical analysis much further. Normally, we'd look at a market by itself. We'd look at its price action, potential patterns and its momentum. Intermarket analysis takes this a step further by comparing the market at hand to various other markets. It gives us an idea of what is really going on and where market leadership is. In regards to Gold, intermarket analysis is even more important. Gold is the type of market or asset that thrives when other asset classes are not performing well. Rarely does Gold perform well if there is persistent strength in another asset class such as Stocks or Bonds. We are in a Gold bull market, so Gold will outperform other asset classes over time. However, it is an important exercise in trying to gauge the near-term outlook for the yellow metal. Below we graph Gold against the various asset classes: Commodities, Bonds and Stocks. We also graph Gold against currencies, as it is the currency of last resort. We can see that Gold has already broken out against both Corporate and Treasury Bonds. The breakout against Corporates is very significant as it comes after a 2-year base. Meanwhile, Gold has just broken out against Currencies (ex- US Dollar) and a breakout against Stocks appears imminent. Commodities are the only group holding up against Gold.
The conclusion, in the near future money will move out of Treasuries, Corporates, Currencies and Stocks and go into Gold and likely Commodities. The last time Gold looked this strong in relative terms was in Q3 2009 when Gold began a move to $1220/oz. With this type of relative strength, it is very likely that Gold makes another big move into 2011. This is just a tiny sample of what we offer our premium subscribers. In our service we seek to help traders and investors manage their risk while achieving triple digit gains in the best Gold and Silver juniors. We invite you to try a free 14-day trial to our service. Good Luck! Jordan Roy-Byrne, CMT
| ||
| Gold Seeker Closing Report: Gold and Silver End Slightly Lower After Hitting New Highs Posted: 07 Dec 2010 07:19 AM PST Gold climbed throughout most of trade in Asia and London and rose to a new record intraday high of $1430.90 by a little before 9AM EST, but it then fell back off for most of trade in New York and ended near its noontime low of $1402.44 with a loss of 0.49%. Silver climbed to a new 30-year high of $30.688 before it fell to as low as $29.55 in early afternoon trade, but it ended with a loss of just 0.2%. | ||
| Posted: 07 Dec 2010 07:13 AM PST
Mercenary Links Roundup for Tuesday, Dec 7th (below the jump).
12-07 Tuesday
| ||
| Why Democrats And Republicans Are Both Wrong About The Bush Tax Cuts Posted: 07 Dec 2010 06:09 AM PST 
Not that I personally do not like tax cuts. I would like my own personal income taxes to be cut down to zero percent please. I will take as many tax cuts as I can personally get. And it is absolutely undeniable that the federal government is already handed way, way, way more money than it ever should need. Starving the federal monster of cash is a good thing. We need a much, much, much smaller federal government. But the odds of us ever returning to the kind of limited central government envisioned by our Founding Fathers is somewhere between slim and none and slim just left the building. So aren't less taxes always good? Well, not necessarily. You see, the federal government is planning to spend much more money in the years ahead. When you combine significant tax cuts with huge increases in spending you get lots more debt. Extending the Bush tax cuts (and throwing in a few extra ones) will help the U.S. economy in the short-term, but without accompanying brutal spending cuts it will make our long-term debt problems even worse. But most of our politicians don't think about the long-term. Most of them just want the economy to turn around in the short-term so that they can get re-elected. For example, Barack Obama is not completely stupid. He realizes that these tax cuts are probably his best shot at a short-term economic boost. If the economy starts to get back to "normal", it may be just enough to get him another term in office. And self-preservation is what most U.S. politicians are most interested in. Meanwhile, we are heading for a national debt nightmare that threatens to destroy our financial system and plunge us into national bankruptcy. But if our politicians did attempt to make the brutal spending cuts that would be necessary to balance the budget, most Americans would start screaming bloody murder. The truth is that the American people have become dependent on the government and they like getting their checks, their handouts and their government contracts. Okay, so what will this deal that Obama has made with the Republicans actually do? Well, it will extend most of the Bush tax cuts for two years (right up through the 2012 presidential election). The following are some of the details.... *All income levels will continue to be taxed at the lower rates instituted by the original Bush tax cuts. That means that the highest rate will remain at 35 percent. *Barack Obama claims that extending these tax cuts will save the average American family approximately $3,000 next year. *The 15 percent rate on capital gains and dividends will be continued. *As part of the package, Republicans have agreed to a 13 month extension of long-term unemployment benefits. *One new tax cut included in the deal is a reduction of the Social Security payroll tax by two percentage points for one year. So for a year U.S. workers will be paying just 4.2 percent instead of 6.2 percent. Barack Obama believes that Americans will save $120 billion next year from this tax cut alone. For the average American family, it will mean that they will have approximately an extra $1000 in their wallets. *The existing $1,000 child tax credit will be extended for the next two years. *Another tax cut that is new would allow U.S. businesses to immediately expense all business investments in 2011. The Obama administration is claiming that this tax cut would be the biggest "temporary investment incentive" in American history. *A compromise was reached on the estate tax. There will be an estate tax exemption of 5 million dollars per person and the maximum rate will be 35 percent. So how much will all of this cost? Well, all over the Internet the Democrats and the Republicans are arguing over figures. One figure that is being thrown around quite a bit is $900 billion over two years. But what is another $900 billion when we are already caught in a death spiral of government debt? The IMF was already projecting that federal government debt was going to exceed 100 percent of GDP by 2015. So how soon will we get there now? Today, our national debt is more than 13 times larger than it was just 30 years ago....
So can't we just "grow" our way out of this debt? Not a chance. Reducing taxes and increasing government spending will both stimulate the economy in the short-term, but both of them will always cause government debt to go up. The sad truth, as I have written about previously, is that it is now mathematically impossible to pay off the U.S. government debt. If you took every dollar out of every single wallet, out of every single mattress and out of every single U.S. bank and sent it to the government you wouldn't even make that big of a dent in the national debt. So can't the U.S. government just go out and create more money and solve the problem? No. You see, under our system the creation of more money is also the creation of more debt. As long as the Federal Reserve system exists, the U.S. federal government will be trapped inside a perpetual debt machine. The best we can hope for is to slow the expansion of government debt down to a reasonable level. But as I explained in a previous article, it is extremely unlikely that the U.S. government will ever have a balanced budget ever again. The U.S. government currently has to borrow approximately 41 cents of every dollar that it spends. The spending cuts that would be required to slash that much out of the federal budget would be beyond draconian. Sadly, the truth is that even the really bad official budget deficit figures severely understate the extent of the crisis that we are facing. If the U.S. government was forced to use GAAP accounting principles (like all publicly-traded corporations must), the annual U.S. government budget deficit would be somewhere in the neighborhood of $4 trillion to $5 trillion. So anyone who thinks that we are just a "tweak" or two from fixing U.S. government finances is living in a world of delusion. Unfortunately, the years ahead look downright apocalyptic. After analyzing Congressional Budget Office data, Boston University economics professor Laurence J. Kotlikoff concluded that the U.S. government is facing a "fiscal gap" of $202 trillion dollars. But the American people don't want to hear this. The American people don't want to hear that there are serious consequences for running up the biggest debt in the history of the world. The American people just want to be told that there are smart people working on the problem and that they are on the verge of "fixing" it. But it is all a lie. We can keep trying to "kick the can down the road" for a while longer, but eventually a day of reckoning is going to come and it is going to be painful beyond imagination. Somehow we have the arrogance to believe that our children and our grandchildren should pay back all of the debt that we have accumulated. What we have done to future generations is beyond criminal. America has enjoyed the greatest party in the history of the world, but eventually it is going to be time to turn out the lights. For now, however, the Republicans and the Democrats are busy trying to figure out ways that they can keep the party going for a little while longer. Perhaps they can just slash taxes all the way to zero and the federal government can just borrow all of the money that it needs. At least that way we wouldn't be endlessly pouring our own money into the financial black hole called the U.S. government. | ||
| Posted: 07 Dec 2010 01:04 AM PST Back in September (with silver at $21/oz) I wrote a piece titled "Does Silver's Smooth Ride Lead Past $30?" My answer to that question at the time was "yes", with a prediction that silver would make a short-term "top" somewhere between $30 - $35/oz. Thanks to a rude interruption when the banker-cabal launched one of their trademark ambushes of the silver market, that "smooth ride" was somewhat abbreviated early in November. Under different circumstances, I might wonder whether that man-made pause in the market was enough of a consolidation to prepare silver for yet another leg higher. Given current circumstances, however, there appears to be no doubts about silver's current status. As I observed in that earlier commentary, this recent spike by silver duplicates a chart-pattern which had already had two previous cycles. After both of those sharp spikes, silver suffered wicked sell-offs, thus those following that previous analysis may now be worried that history is about to repeat. There are two very good reasons why silver bulls should have no fears of the previous pattern continuing to play-out. To begin with, the last crash in silver – which began at the end of the summer of 2008 – was by no means a "natural" reaction of the market to the spike in the price of silver. Rather, as I have written often before, the "Crash of '08" was a Wall Street/U.S. government "joint effort". Wall Street was desperate to hide the fact that it, and it alone was "going down" with the crash in the U.S. housing sector, and overall economy. Meanwhile, the U.S. government had its own motive for engineering a commodities crash: postponing hyperinflation. Had that massive manipulation/intervention not taken place, there would have been no "crash" in the price of silver – despite the sharp run-up. How can I be certain of this? This brings me to my second reason for believing there will be no crash in silver following this spike: there isn't anymore silver. No, I'm not claiming that the entire crust of the Earth has been scraped clean of silver. It's the "above ground" silver (i.e. global stockpiles) which has been exhausted. There hasn't been this little available silver in the world for thousands of years. In that respect, it is irrelevant whether silver had just advanced by 10% or 1000%. If we are "out of silver", the price is going much, much higher. Silver investors should not necessarily expect the same "smooth ride" we saw when silver rocketed from $20 to $30/oz (the first time). That part of the previous chart-pattern has been completed. In fact, no one can say with certainty how silver will behave in the near future – with the exception of concluding that the price will not make any significant move lower. Indeed, we see signs of inventory "stress" all over – aggravated by the endless inventory-fraud perpetuated by those reporting this data. Not only are bullion-dealers having difficulties keeping any stock available for buyers, but even the U.S. government itself is desperately looking for ways to weasel-out of making silver available for its own citizens. First there was the announcement by the Obama regime (and reported by GATA) that it was seeking to repeal the law which requires the U.S. mint to produce enough minted coins to "meet demand". With the general public in North America just beginning to catch-on to the value and scarcity of silver, demand can only go higher, and government mints around the world have struggled to keep pace with demand even prior to this latest spike in interest. Thus, the U.S. government just made a second announcement today: it is delaying the release of a brand-new series of commemorative silver coins dubbed the "America the Beautiful" series. |


 On U.S. beaches, rip currents (also known as rip tides) are responsible for 80% of lifeguard rescues. They are hard to spot (especially if you aren't looking) and potentially fatal.


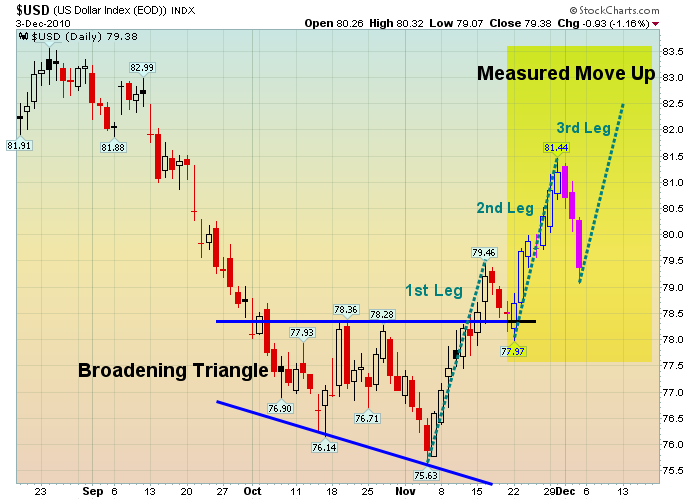


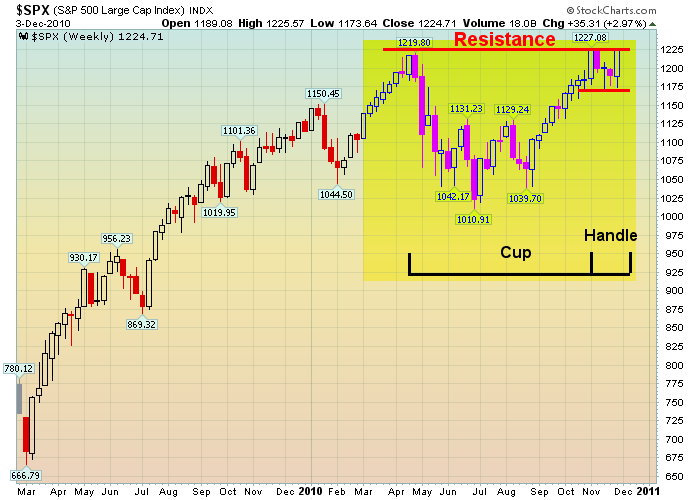
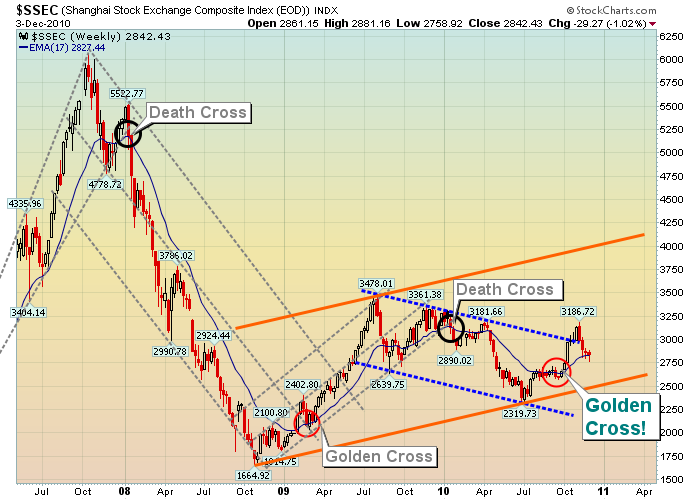


| You are subscribed to email updates from Gold World News Flash 2 To stop receiving these emails, you may unsubscribe now. | Email delivery powered by Google |
| Google Inc., 20 West Kinzie, Chicago IL USA 60610 | |
No comments:
Post a Comment