


Gold World News Flash |

- The December 16, 2010 edition of Casey's Daily Dispatch, now available
- An hour with Jim Rickards and the once and future money
- US Public Debt Set To Pass US Annual GDP.
- The First Stage of Inflation Has Already Hit, Next Up Is the Currency Collapse
- Gold Seeker Closing Report: Gold and Silver Fall Over 1% More
- Gold and Silver Firm Ahead of EU Summit on Debt Crisis
- RICHARD RUSSELL WISDOM
- Laughing at Fiscal Absurdity
- Currency Wars and China
- If Today Marked the Bottom of the Gold Price Decline, Then Tomorrow it Ought Not Drop Through $1,365
- Gold: Currency Wars and China
- The Unwavering and Inimitable Ron Paul
- CFTC Open Meeting On Speculative Position Limits is Today
- In Abu Dhabi, Christmas comes decked with gold
- Gold 411 - December 16, 2010
- THURSDAY Market Excerpts
- Hourly Action In Gold From Trader Dan
- The Dollar Threads a Needle
- Guest Post: Rebalancing Act For Your Portfolio
- “The Fed Will End Itself Before I'm Able To”
- How $90 Oil Affects the Global Economy
- How/Why I'm putting all my cash into gold
- Jim Willie: “Silver is breaking out in all majors currencies.”
- Schmidt's Gold Thoughts
- Gold Daily and Silver Weekly Charts - Gold With 50 Day Moving Average
- Simon Black's Advice To Young People: Grab Your Ankles
- How to Give the Gift of Gold
- False Choice: Yield vs. Safety
- The Rise, Fall, and Rise Again of Privateers
- Richard Koo's Latest: "Europe And US Have Learned Nothing From Japan's Lessons And Will Repeat Its Mistakes"
- Jim?s Mailbox
- Should Hank Paulson Be In Jail?
- Some Irish seen turning to gold, shunning banks
- Tolerating Deception for the Sake of Economic Growth
- Cameron says, ‘UK shouldn't have to pay'
- Jim's Mailbox
- On The Importance of Trade and New Economic Growth
- Money & Markets Charts ~ 12.16.10
- How America Became a Communist Nation
- Top Tick Bernanke: How The Chairman Lost $46 On The Fed's Holdings Since The Launch Of QE2
- Modern Monetary Theory , or How the US Monetary System Really Works
- ECB strengthens balance sheet as risks rise
- Gary North: Ron Paul's potential questions for Ben Bernanke
- Gary North: Ron Paul's potential questions for Ben Bernanke
- Buried Deep Within The Files That The Federal Reserve Released On Thier MBS Purchase Program, We Found TARP 2.0!!! More Taxpayer Money To The Banks!
- The Morning Gold Report
- Fake-Out Thursday – Oil Scam Continues Unabated
- Gold declines to two-week low on investor sales after 26% rally in 2010
- Bullish Indicators Not Bullish Enough to Indicate Recovery
- Gold Breaks Short Term Support Line
| The December 16, 2010 edition of Casey's Daily Dispatch, now available Posted: 16 Dec 2010 06:30 PM PST Gold 411
| ||||||||||||||||||||||||||||||||||||
| An hour with Jim Rickards and the once and future money Posted: 16 Dec 2010 04:55 PM PST 1a ET Friday, December 17, 2010 Dear Friend of GATA and Gold: Market intelligence analyst James G. Rickards of research firm Omnis Inc. made a long presentation to the "Rethinking the Future International Security Environment" conference held Dec. 7 in Washington by the Applied Physics Laboratory of Johns Hopkins University. The second half of Rickards' presentation elaborated on his recent incisive observations about gold, as expressed at King World News and elsewhere. Rickards told the Johns Hopkins conference that he considers gold to be the secret economic weapon of the U.S. government, and he noted that devaluing currencies against gold in times of economic distress has been done frequently throughout history. He said he expects the United States to avert the dollar's collapse by returning it to a gold standard or even to avert the collapse of currencies worldwide by sponsoring a new gold-backed international currency, with gold revalued to perhaps $4,000 per ounce under either scenario. During the question period at the end of his presentation Rickards asserted that the paper gold markets in New York and London have sold claims to far more gold than the sellers possess or likely can obtain and that those markets will crash and resort to cash settlement if enough buyers ever try to take delivery. Of course that has been one of GATA's main arguments lately. In regard to devaluation against gold, it may be time again to note the study published in 2006 by the British economist Peter Millar, "The Relevance and Importance of Gold in the World Monetary System." Millar argued as Rickards does while predicting gold's revaluation at a somewhat higher price. Millar's study can be found at GATA's Internet site here: Rickards is a scholar and lawyer and described himself to the Johns Hopkins conference as a refugee from the bond market who converted to gold when he perceived how haywire things were going in the world financial system. (He got an especially close look as counsel to Long-Term Capital Management when it collapsed in 1998.) While his presentation is nearly two hours long, after the aggravatingly short segments given to him on business television it is a delight to have a chance to hear him lecture a bit. His reflections on gold begin at about 62 minutes into the video of his presentation, which is posted at the Internet site of the Applied Physics Laboratory of Johns Hopkins University here: http://outerdnn.outer.jhuapl.edu/rethinking/VideoArchives/MrJamesGRickar... Or try this abbreviated link: CHRIS POWELL, Secretary/Treasurer ADVERTISEMENT Opportunity in the gold coin market Swiss America Trading Corp. alerts GATA supporters to an opportunistic area of the gold coin market. While the gold bullion market has been quite volatile lately and as of November 29 gold has risen only $7 per ounce over the last month, the MS64 $20 gold St. Gaudens coin has risen about 10 percent in the same time. The ratio between the price of these coins and the price of gold is rising. If you'd like to learn more about the ratio and $20 gold coins, Swiss America can e-mail you a three-year study of it as well as other information. Swiss America also can provide a limited number of free copies of "Crashing the Dollar," a book written by Swiss America's president, Craig Smith. For information about the ratio between the $20 gold pieces and the gold price and for a free copy of "Crashing The Dollar," please call Swiss America's Tim Murphy at 1-800-289-2646 X1041 or Fred Goldstein at X1033. Or e-mail them at trmurphy@swissamerica.com and figoldstein@swissamerica.com. Join GATA here: Yukon Mining Investment e-Conference http://theyukonroom.com/yukon-eblast-static.html Vancouver Resource Investment Conference http://cambridgehouse3.com/conference-details/vancouver-resource-investment-conference-2011/15 Cheviot Asset Management Sound Money Conference Phoenix Investment Conference and Silver Summit Or a colorful poster of GATA's full-page ad in The Wall Street Journal on January 31, 2009: http://gata.org/node/wallstreetjournal Or a video disc of GATA's 2005 Gold Rush 21 conference in the Yukon: Help keep GATA going GATA is a civil rights and educational organization based in the United States and tax-exempt under the U.S. Internal Revenue Code. Its e-mail dispatches are free, and you can subscribe at: To contribute to GATA, please visit: ADVERTISEMENT Prophecy Drills 71.17 Metres of 0.52 percent NiEq Prophecy Resource Corp. (TSX-V: PCY) reports that it has received additional assays results from its 100-percent-owned Wellgreen PGM Ni-Cu property in the Yukon, Canada. Diamond drill holes WS10-179 to WS10-182 were drilled during the summer of 2010 by Northern Platinum (which merged with Prophecy on September 23, 2010). WS10-183 was drilled by Prophecy in October 2010. Highlights from the newly received assays include 71.17 metres from surface of 0.52 percent NiEq (0.310 percent nickel, 0.466 g/t PGMs + Au, and 0.233 percent copper) and ended in mineralization. For more drill highlights, please visit: http://prophecyresource.com/news_2010_nov29.php
| ||||||||||||||||||||||||||||||||||||
| US Public Debt Set To Pass US Annual GDP. Posted: 16 Dec 2010 04:37 PM PST People may not even realize that during the Great Depression, US Federal debt as a percent of GDP did not even reach 40 percent. Part of this was because the size of government was much smaller in military, public services, and entitlements. The only time in history that the US as a whole spent more than it produced was during World War II. That is the only time but we are now quickly approaching the 100 percent range of federal debt to GDP as a percentage. The US Treasury and Federal Reserve are aiming to pull the economy out of the Great Recession by going into further debt. Think about this for a few minutes. What led the US into a major financial crisis were banks allowing people to go into too much debt buying homes, cars, and other things they clearly were not able to afford. While the banks were bailed out courtesy of taxpayers, the central banks are aiming to go deeper into debt just to create additional bubbles. Bankers are loving this and their profits reflect this change. Yet as many chastise economies around the world for going too deep into debt it is likely we will hit the 100 percent threshold next year. Take a look at the amount of debt relative to our nation's production:  Does the above even look healthy to you? Starting in the 1970s the US government thought it would be smart to simply "deficit spend" and put all expenses on the US credit card. So for a few decades this worked but now what? If debt was the solution to everything then why not give every American an open ended credit card with $1 million dollars pre-loaded? It would be simple given most Americans already have a credit card. Yet wealth is reflected by what can actually be produced and the Federal Reserve simply printing money dilutes the currency of the US. Common sense would tell you this.
| ||||||||||||||||||||||||||||||||||||
| The First Stage of Inflation Has Already Hit, Next Up Is the Currency Collapse Posted: 16 Dec 2010 04:11 PM PST The First Stage of Inflation Has Already Hit, Next Up Is the Currency Collapse One of the biggest misconceptions about inflation is that the US Dollar needs to collapse in order for inflation to occur. While a currency collapse often accompanies periods of heightened inflation, this is not necessarily true. Case in point, the US Dollar actually rallied this year despite commodity prices exploding higher:
* per metric ton ** cents per pound As you can see, we've had an inflationary spike in commodity prices in 2010 despite the US Dollar rallying 2% during that time. Indeed, the inflation the US is experiencing today is rather unusual as it has been accompanied by deflation at the same time. As I write this, the US is experiencing deflation in housing prices and incomes combined with inflation in the cost of living (energy, food, commodity prices). Thus, we see deflation and inflation occurring simultaneously. It's not surprising as the Fed's primary moves since the Financial Crisis hit are: 1) Buying debt 2) Pumping money into the banks The first move was designed to attempt to stop debt deflation. As I've noted in other articles, the Fed is failing miserably at this (bonds are tanking). The purpose of the Fed's secondary move was to shore up the banks' balance sheets (with hundreds of trillions in derivative exposure and off-balance sheet toxic debt, most US banks are insolvent). Indeed, the monetary base has more the doubled since the Financial Crisis began.
What you're looking at is the Fed producing $1.2 trillion of money out of thin air. The reason we haven't yet seen inflation in the form of a US Dollar collapse is because: 1) Europe is imploding pushing the US Dollar up 2) Banks are sitting on this money (not lending) so it's not getting into the economy Regarding #2, the below chart explains everything:
The above chart depicts the amount of money US banks are sitting on in excess of what the Fed requires them to hold (all banks must hold a certain amount of cash in reserves). As you can see, up until early 2010, US commercial banks were sitting on nearly $1.2 trillion in excess reserves. So in plain terms, the Fed's money pumping (at least the money we know of) has simply been sitting on banks' balance sheets. In other words, banks aren't lending it out, so it's not getting into the economy (yet). This is why the US Dollar has yet to truly collapse: the Fed's money pumps have yet to get into the economy. Instead, the banks are just sitting on them. However, this doesn't account for the Fed money pumps that are non-public. It's no secret that the Fed has been pumping hundreds of billions of Dollars to financial firms without the public's consent. According to the Neil Barofsky, Special Inspector General of the TARP program, the Wall Street bailout could end up costing the US up to $23 trillion before it's over. Obviously a heck of a lot of money has been flowing into Wall Street that we don't know about. And Wall Street has done what it does best, pour this money into the financial markets… which has driven stocks, commodities, and risk assets in general THROUGH the roof. This is also why stocks and commodities have displayed such an unusually high correlation since the Fed started its QE 1 program in March 2009: it's all about Wall Street putting some of the Fed's money pumps into the markets. Thus today in the US we have debt and housing deflation… combined with cost of living and asset price inflation. However, I want to stress that the inflation we are seeing today is just a taste of what's to come in the next year. Indeed, our current inflation is all about loose money flowing into commodities, pushing up the cost of living. This is the financial speculation form of inflation and is just a precursor to the next, FAR MORE serious stage of inflation: the currency collapse. On that note, I'm currently preparing subscribers for the coming Inflationary Storm in the US, not with ordinary inflation hedges (though we're currently up 23% and 66% on our first two inflation trades, respectively) but with three incredible inflation trades that 99.9% of the investment world and fund managers don't know about. All three of these investments currently trade at HUGE discounts to their underlying assets. In fact, they're so cheap that all of them are prime take-over targets REGARDLESS of when inflation erupts in the US. Indeed, I fully expect all three of these investments to be up in the triple digits within six months. And I just revealed all three of them, including their names, symbols, and how to go about investing in them in a special report called The Inflationary Storm to subscribers of Private Wealth Advisory on Wednesday. Already two of them are up. One by as much as 6%... in less than 48 hours. To find out what these investments are, you can pick up a copy of The Inflationary Storm now by taking out a "trial" subscription to Private Wealth Advisory. To do so…
An annual subscription to Private Wealth Advisory costs just $180. However, I realize my analysis and investment style are not for everyone.
| ||||||||||||||||||||||||||||||||||||
| Gold Seeker Closing Report: Gold and Silver Fall Over 1% More Posted: 16 Dec 2010 04:00 PM PST Gold remained near unchanged in Asia and London before it fell almost 2% in early New York trade to as low as $1361.07 by about 10AM EST, but it then rallied back higher in the last few hours of trade and ended with a loss of just 1.08%. Silver fell to as low as $28.322 before it also rallied back higher, but it still ended with a loss of 1.47%.
| ||||||||||||||||||||||||||||||||||||
| Gold and Silver Firm Ahead of EU Summit on Debt Crisis Posted: 16 Dec 2010 03:40 PM PST Mark O'Byrne submits: Gold Gold and silver were higher this morning ahead of a crucial EU summit on the deepening eurozone debt crisis today. The euro firmed slightly in overnight trade but has since given up those gains and is trading at USD 1.322, and €1,047/oz. Given that the crisis shows no signs of abating any time soon, with concerns shifting from Ireland and Greece to Belgium, Portugal and Spain, gold will likely continue to receive safe haven demand for the foreseeable future. Complete Story »
| ||||||||||||||||||||||||||||||||||||
| Posted: 16 Dec 2010 01:11 PM PST I started subscribing to Russell's Dow Theory newsletter back in 2004. He convinced me to invest in gold. He has been right since 1999. He is still right. The most spectacular gains for gold lie ahead. http://www.321gold.com/editorials/russell/russell121610.html
| ||||||||||||||||||||||||||||||||||||
| Posted: 16 Dec 2010 12:11 PM PST I was cowering inside the Mogambo Bunker Of Fear (MBOF) in preparation for the release of the news from the Federal Reserve about how much credit those treacherous bastards created last week, expecting it to be a Big Whopping Bunch (BWB) since they have already announced that they were going to create an astounding $600 billion in the next six months as part of their shameful new Quantitative Easing 2 crap, which comes to $100 billion per month as part of their shameful Quantitative Easing 2 crap, which comes to $25 billion per week as part of their shameful Quantitative Easing 2 crap. This $25 billion a week is, again, $100 billion per month, which is, again, $600 billion in six months, which is a huge $1.2 trillion per year, which is a massive $6 trillion in only 5 years, all in an economy with a GDP measuring a measly $14 trillion! I cleverly extrapolate all of this not to show off my skills with mathematics, which are impressive only in the way I misunderstand and misuse them to ...
| ||||||||||||||||||||||||||||||||||||
| Posted: 16 Dec 2010 12:00 PM PST Once again gold has made fresh highs as the Fed prepares its second or is it the third round of quantitative easing (a.k.a. money printing) which involves buying assets (a.k.a debt) to drive down yields and hopefully stimulate more borrowing and...
| ||||||||||||||||||||||||||||||||||||
| If Today Marked the Bottom of the Gold Price Decline, Then Tomorrow it Ought Not Drop Through $1,365 Posted: 16 Dec 2010 11:31 AM PST Gold Price Close Today : 1370.40
| ||||||||||||||||||||||||||||||||||||
| Posted: 16 Dec 2010 11:04 AM PST Once again gold has made fresh highs as the Fed prepares its second or is it the third round of quantitative easing (a.k.a. money printing) which involves buying assets (a.k.a debt) to drive down yields and hopefully stimulate more ... Read More...
| ||||||||||||||||||||||||||||||||||||
| The Unwavering and Inimitable Ron Paul Posted: 16 Dec 2010 11:00 AM PST Hey, our old friend Ron Paul is in the news. The New York Times carried an article about him. Astonishingly, it wasn't negative. Yes, it mentioned that Ron was regarded as a "crank." But in context, that didn't seem so bad. "I was with Ron just last week," said colleague Addison Wiggin. "He was just coming up for the chairmanship of the House subcommittee that oversees the Fed. He said he thought he had a 'snowball's chance in Hell' of getting the post. "The last time he was in line for it, the Republican hierarchy blocked him. But that was then. This is now." A few years ago, everyone hated Ron. The left hated him because he wanted to withdraw funding for its pet projects. The right hated him because he wanted to rein in the US military. Now, things have turned around. The left likes Ron because he wants to bring the troops home from Iraq and Afghanistan. The right likes Ron because he is a consistent opponent of deficit spending. The young are fascinated by him. What sort of Congressman votes no on his colleagues' boondoggles? What sort of conservative opposes the Pentagon and calls for an audit of the Fed? What sort of politician sticks to his principles, even when they are out of favor? Most recently, the right-wingers have been howling for Julian Assange's blood. They say he's a "traitor" – despite the fact that as an Australian, he has no loyalty to the US. Sarah Palin says he should be pursued like an Al Qaeda operative (though he has committed no crime, as far as we know). Rep. Peter King asked the Attorney General to name WikiLeaks as a terrorist organization. But good ol' Ron keeps his head and his cool. He praises Assange for revealing the "delusional" nature of US foreign policy. And poor Julian. Half the world wants to see him hang. And for what? He published some documents that US and foreign governments would rather keep secret. It may be a crime; politicians can make anything a crime. But since when was that a sin? Even as to the crime, we have our doubts. If publishing is a crime, your editor is in trouble. If publishing "sensitive" documents that make US officials look like fools is a crime, we're all in trouble. Regards, Bill Bonner The Unwavering and Inimitable Ron Paul originally appeared in the Daily Reckoning. The Daily Reckoning, offers a uniquely refreshing, perspective on the global economy, investing, gold, stocks and today's markets. Its been called "the most entertaining read of the day."
| ||||||||||||||||||||||||||||||||||||
| CFTC Open Meeting On Speculative Position Limits is Today Posted: 16 Dec 2010 10:44 AM PST "CFTC now admits it will miss the deadline on position limits. 32 consecutive weeks of outflows from mutual funds. Massive selling of U.S. currency lies ahead. Swiss banks are resisting metal deliveries. A must read GATA release... and much more. " Yesterday in Gold and Silver The gold price was pretty steady in Wednesday trading in the Far East... but starting at 1:00 p.m. Hong Kong time, gold got sold off about ten bucks going into the morning gold fix in London around 10:30 a.m.GMT...5:30 a.m. in New York. Gold then rose back to almost unchanged by 8:00 a.m. in New York, before rolling over and heading lower for the rest of the Wednesday trading day. The gold price closed virtually on its low of the day... which was $1,377.80 spot] Silver's price path was very similar to gold's on Wednesday... except far more volatile price wise... with the highs and lows pretty much corresponding with what happened to the gold price. Silver's low price tick of the d...
| ||||||||||||||||||||||||||||||||||||
| In Abu Dhabi, Christmas comes decked with gold Posted: 16 Dec 2010 10:44 AM PST Dec. 16, 2010 (The Associated Press) ABU DHABI, United Arab Emirates – The $11 million symbol of the season has become the latest extravagance at the Emirates Palace hotel, which boasts its own marina, heliport and a vending machine that pops out small gold bars. The hotel's general manager, Hans Olbertz, was quoted in local newspapers Thursday as saying the 43-foot (13-meter) faux fir has 131 ornaments that include gold and precious stones such as diamonds and sapphires. Olbertz told Dubai's Gulf News that he worked with one of the jewelers in the hotel to create a "unique tree and experience for our guests this year." … Christmas spirit is not rare in the United Arab Emirates, which is officially Muslim but hosts a huge foreign population. [source] RS View: Whereas our dominant Christmas colors seem to be typified by red and green (in homage to debt and dollars, surely), I've got to say, in my eyes, this tree of sparkles and gold strikes a more satisfyingly firm and resplendent chord. [Too bad the slideshow accompanying the article doesn't include a "night" shot to show off the lights and sparkles to better effect. But with a pricetag at $11M, I can understand why the hotel would be keen to keep a watchful eye and the house lights on!]
| ||||||||||||||||||||||||||||||||||||
| Posted: 16 Dec 2010 10:13 AM PST Gold 411 - Casey's Daily Dispatch [LIST] [*]Sign Up Now! [*]| [*]RSS Feed [*]| [*]Print this [*]| [*]Visit the Archives [*]| [*]Email to a Friend [*]| [*]Back to All Publications [/LIST] December 16, 2010 | [url]www.CaseyResearch.com[/url] Dear Reader, Driving back from dropping the kids off at school this morning, I tuned into the radio news and found myself irritated by almost every story. Granted, I may be more crotchety than usual just now, due to the typical holiday stress compounded by an injured Achilles tendon that has been giving me problems on and off for months - and is now "on."...
| ||||||||||||||||||||||||||||||||||||
| Posted: 16 Dec 2010 10:06 AM PST Gold futures step lower as year-end approaches The COMEX February gold futures contract closed down $15.20 Thursday at $1371.00, trading between $1361.60 and $1387.30 December 16, p.m. excerpts: see full news, 24-hr newswire…
| ||||||||||||||||||||||||||||||||||||
| Hourly Action In Gold From Trader Dan Posted: 16 Dec 2010 09:16 AM PST Dear CIGAs, Click chart to enlarge today's hourly action in Gold in PDF format with commentary from Trader Dan Norcini
| ||||||||||||||||||||||||||||||||||||
| Posted: 16 Dec 2010 09:15 AM PST Pre-holiday cheer is certainly evident in the financial markets. The overwhelming consensus is that the Congressional agreement to not raise taxes while extending hundreds of billions in new stimulus will finally allow the recovery to take hold ... Read More...
| ||||||||||||||||||||||||||||||||||||
| Guest Post: Rebalancing Act For Your Portfolio Posted: 16 Dec 2010 09:09 AM PST
Submitted by David Galland of Casey Research Rebalancing Act for Your Portfolio Has the latest pullback in precious metals and related stocks given you a sickening feeling in the pit of your stomach?
The importance of this information is two-fold:
| ||||||||||||||||||||||||||||||||||||
| “The Fed Will End Itself Before I'm Able To” Posted: 16 Dec 2010 09:00 AM PST Representative Ron Paul (R-TX) talked to Maria Bartiromo the other day about the central bank, the value of gold, and his upcoming chairmanship of the Monetary Policy subcommittee of the House Financial Services Committee in which he's hoping to host a debate between Paul Krugman and an Austrian economist. Favorite line: "I'm always fascinated that the Treasury is in charge of the strong dollar policy and, yet, it's the Fed that creates the money. The Fed determines the value of the dollar. If you print a lot of dollars, the value of the dollar has to go down."
| ||||||||||||||||||||||||||||||||||||
| How $90 Oil Affects the Global Economy Posted: 16 Dec 2010 09:00 AM PST With 10 shopping days before Christmas, it's looking more and more likely: The holiday-season price of gasoline will top $3 a gallon for the first time. According to AAA, the national average today for regular unleaded is $2.984 – up nearly a dime over the last month. The price of crude oil is up $7 a barrel over the same period. "Of course," you might say, "it's the weaker dollar. No surprise there." Except the dollar actually strengthened a bit over the last month. And over the last three months, it's gone basically nowhere, while crude has jumped over 12%.
And that's West Texas Intermediate crude, the light sweet stuff that's (relatively) easy to pull out of the ground. Brent crude – the benchmark for much of the rest of the world – is already above $90 a barrel. $90 oil is "a mild threat to the global economy," says The Financial Times. Could it be even worse for Americans? It's been said that every $1 added to the price of a barrel of oil is $100 billion subtracted from GDP. Even in a $14 trillion economy, that adds up. Case in point: FedEx just announced its profits fell 18% in the third quarter. Its fuel costs were 26% higher than Q3 2009. No doubt that's one reason you'll be paying 3.9% more to ship something via FedEx starting next month. (No luck switching to UPS; it's jacking up rates 4.9%.) So why are oil prices outpacing the dollar? As is often the case these days, we look to China for an answer. "Last summer," says Byron King, editor of Outstanding Investments, "the Chinese government announced that it wants domestic industries to become more efficient in their use of electricity (most of which comes from polluting coal-fired plants in China). The Chinese government enforced this edict by – literally – pulling the switches on the power grid and blacking out entire factory complexes and industrial areas. Nothing subtle about it, eh? "So what did the Chinese factory owners do? They threw other switches and fired up their backdoor diesel generators. The result? There was an instant, sustained surge in demand for diesel fuel across China. Indeed, starting in August, oil imports surged into China, as did imports of refined diesel fuel. "This action helped strengthen oil and refined product prices all fall across the world. Add into this the generally inflationary conduct of US monetary policy. And add on a generally declining US oil inventory as refiners crank out heating oil in anticipation of the cold winter. There's your $90 oil." Dave Gonigam How $90 Oil Affects the Global Economy originally appeared in the Daily Reckoning. The Daily Reckoning, offers a uniquely refreshing, perspective on the global economy, investing, gold, stocks and today's markets. Its been called "the most entertaining read of the day."
| ||||||||||||||||||||||||||||||||||||
| How/Why I'm putting all my cash into gold Posted: 16 Dec 2010 08:59 AM PST By Andrew Sullivan, CFA There are many ways to get exposure to gold, including buying physical metal itself in bullion form, mining shares, mutual funds, and exchange-traded funds (ETFs). The safest option is physical gold because there is no mining or counterparty risk (where the gold is stored), but it can be inconvenient to buy and store. … even at nominal highs, there is still a very attractive risk/reward ratio on offer with gold and how the real risk is holding cash. Therefore I'm choosing gold over paper while I wait for excellent investing opportunities. And I'm doing it today…
[source] Excerpts from the aforementioned article: (December 15, 2010) — Commercials advertise "Cash for Gold," but as I see it, the far smarter move is "Gold for Cash." Cash loses purchasing power dramatically over time, and with a global currency war and sovereign debt crisis just beginning, this threat is heightened. There aren't many liquid money alternatives except gold, and because gold is still very attractive in relation to cash, I think buying gold is the right thing to do. … Today, you've got two choices for money: currencies issued by central banks, or hard assets like gold. Remember that in a debt crisis, debtholders worry about getting their money back. Well, it's a similar situation in a sovereign debt crisis, except that governments that borrow in their own currencies can always pay debtholders back by creating more of it, diluting the existing currency's value. Therefore, by holding cash, you expose yourself to the very real risk of losing significant purchasing power as a sovereign debt crisis unfolds. … Given current dynamics, I consider a $5,000 price very likely in the future, so let's look at our upside and downside potential in the next few years. At $5,000, we have $3,600 of upside from the current $1,400 price. My estimate of downside is $1,100, just above where India bought gold from the IMF last year, meaning we're risking $300 ($1,400 minus $1,100). This means we have $3,600 of upside and $300 of downside, a 12:1 ratio. In other words, our initial capital of $1,400 could increase 260% or decrease 20% in nominal terms. But because our only other choice for money is paper currency, if we don't buy gold, we are risking $3,600 in purchasing power for a potential $300 gain, a 1:12 ratio. This is why your real risk isn't in buying gold, it's in staying in cash, which has an excellent chance of decreasing in relation to gold. The standard argument against gold is that because it doesn't produce income, it can't be valued. I disagree with this statement because valuation at its heart is about predicting the future. For stocks and bonds, this means estimating future cash flows. But if an asset does not have cash flows, you need to fall back to economic fundamentals and predict both supply and demand for that asset in the future. Consider artwork. Art dealers know how many paintings exist by a particular artist, so supply is easy. They also know how deep demand is — whether it's a new artist with possibly flaky support or an established name with many buyers who will enter the market should prices fall. This, and a wealth of information gathered in the business, allow them to determine whether a painting is good value or not. Similarly, with gold, the supply side is easy to determine: it increases by roughly 1% to 2% per year. The tricky part is gauging future demand and how it will change. But it's really not that hard-demand is off the charts. India and China and other emerging powers know they don't have enough gold relative to their reserves and the size of their economies, and they're desperate to diversify away from dollars. The same goes for investors and ordinary folk worried about the ongoing destruction of the dollar. So instead of income flows, valuation centers on an analysis of supply and demand. … Just like an art dealer can value a piece of art because she is intimately familiar with the supply and demand dynamics that drive prices, you can do the same with gold. If that's too daunting, here's an easy alternative: listen to the professionals, the gold and silver analysts that have followed metals for years. I do. Not for positive reinforcement, but because they spend all day studying and thinking about precious metals, and consequently understand the dynamics multiple times better than those who haven't done any research. And right now, most of the people who know the most about the sector are overwhelmingly bullish, while many with bearish sentiment know relatively little about gold. There is the risk that tunnel vision can creep into some analyses, but the difference in knowledge and time spent on the subject is in many cases 1,000 to 1, so as I see it, it's a no-brainer to whom you should listen. [source] RS View: Precisely!
| ||||||||||||||||||||||||||||||||||||
| Jim Willie: “Silver is breaking out in all majors currencies.” Posted: 16 Dec 2010 08:58 AM PST Chinese Take-Out Of The U.S. Economy, Debt Crisis Triggering Reserves Conversion into Gold and Silver Share this:
| ||||||||||||||||||||||||||||||||||||
| Posted: 16 Dec 2010 08:45 AM PST While this is not the last thought we will have this year, it is the last thoughts on Gold we will send to you in 2010. With a new year in about to about two weeks, perhaps it is time to clear our heads. We will soon be given a fresh ... Read More...
| ||||||||||||||||||||||||||||||||||||
| Gold Daily and Silver Weekly Charts - Gold With 50 Day Moving Average Posted: 16 Dec 2010 08:23 AM PST | ||||||||||||||||||||||||||||||||||||
| Simon Black's Advice To Young People: Grab Your Ankles Posted: 16 Dec 2010 08:07 AM PST
To all who watched the recent student demonstrations in London (in which members of the royal family ended up being victims of righteous mob anger), and mused that things like this can never happen in the US, Simon "Sovereign Man" Black has some words of caution: prepare to grab your ankles. His advice is what some may consider borderline anarchistic: "Stop playing by everyone else’s rules. Refuse to be enslaved by the idea that it’s your civic and moral responsibility to pay off the debts of your government’s failures. Cast off the yoke of their control… and summon the courage to live a life by your own design." Yet judging by recent violent events in ever more European countries, who have decided on precisely this outcome, is this such a far fetched perspective of what reality may soon become? From the Sovereign Man: Young people: get ready to grab your ankles If you’re reading this and under 30, let me be absolutely clear about one indubitable point: your government is going to sacrifice your future in order to pay for its own mistakes from the past.
| ||||||||||||||||||||||||||||||||||||
| Posted: 16 Dec 2010 08:05 AM PST Hard Assets Investor submits: By Brad Zigler Now’s the time when we scurry about, looking for those perfect holiday gifts for friends and family -- provided, of course, that we still have the wherewithal to buy presents after being in the market for 11 1/2 months. Complete Story »
| ||||||||||||||||||||||||||||||||||||
| False Choice: Yield vs. Safety Posted: 16 Dec 2010 08:01 AM PST The 5 min. Forecast December 16, 2010 12:04 PM by Addison Wiggin - December 16, 2010 [LIST] [*] Oil persists near $90 a barrel… Why it’s more than just a “falling dollar” story [*] Bernanke Backfire reaches new heights… triggering a sell signal for bonds [*] Playing catch-up: Dept. of Energy issues a warning readers of The 5 have heard since early 2008 [*] New rosy numbers for the housing market… The 5 checks the footnotes for the real story [*] More trouble for commercial real estate: Cube rats given less space to fill out their TPS reports [/LIST] With 10 shopping days before Christmas, it’s looking more and more likely: The holiday-season price of gasoline will top $3 a gallon for the first time. According to AAA, the national average today for regular unleaded is $2.984 -- up nearly a dime over the last month. The price of crude oil is up $7 a barrel over the same period. “O...
| ||||||||||||||||||||||||||||||||||||
| The Rise, Fall, and Rise Again of Privateers Posted: 16 Dec 2010 08:00 AM PST In August 1812, the Hopewell, a 346-ton ship laden with sugar, molasses, cotton, coffee, and cocoa, set sail from the Dutch colony of Surinam. Her captain was pleased because he reckoned that in London the cargo would sell for £40,000 – the equivalent of at least several million dollars in today's economy. The Hopewell carried fourteen guns and a crew of twenty-five, and for protection she sailed in a squadron of five other vessels. It was difficult, however, to keep a squadron together in the vast expanse of the Atlantic Ocean, and on August 13 the Hopewell became separated from her sisters. Two days later her crew spotted another ship, armed and approaching rapidly. At three hundred yards, the approaching schooner fired a round off the Hopewell's bow and called for her to present her papers and prepare to be boarded, but the captain was not about to give up his cargo so easily, and he opened fire. A hail of musket and cannon balls tore into the Hopewell in return. Broadside after broadside was exchanged as the more nimble adversary bore down repeatedly. At last, the Hopewell could fight no longer, and her captain ordered the flag to be struck. The attacker, an American schooner out of Baltimore, was neither a pirate ship nor a ship of the US Navy, then next to nonexistent. In fact, it is best to think of the Comet not as a ship at all, but as a business enterprise. The Comet's owners and its crew, from Captain Thomas Boyle down to the lowliest cabin boy, were hunting the Atlantic for prizes: British commercial ships to be captured, condemned, and sold for profit. Piracy? Not at all. The Comet was a privateer, a ship licensed by the United States, then at war with Great Britain, to harass British vessels and confiscate their cargoes. The privateer's license was no mere formality. Without the license and a legal proceeding, the privateer could not sell its prizes legally. More important, courts throughout the world recognized a privateer's license as valid. Pirates, in contrast, were barbarians and operated outside the rule of law; if caught, they would be hanged. Even the British, then the enemy, recognized that a privateer acted within the law of nations, and its captain and crew, if captured, would be accorded the same rights as captured officers and crew of the US Navy… Thus, private means were used to wage public wars. Public navies were expensive, especially because they had to be maintained in peacetime as well as in wartime, and, until the late nineteenth century, tax systems tended to be ineffectual and inefficient. Governments, therefore, sometimes relied heavily on private initiative and enterprise to fight their wars. With a few extra cannon and men, a merchant vessel could be converted into a commissioned vessel capable of capturing small prizes should any cross its trading route. The more adventurous might build ships solely for the purpose of capturing prizes. The merchant vessels went on "voyages"; the commissioned vessels "cruised" and became known as privateers. The great era of Elizabethan exploration and expansion, for example, was financed and run by privateers. Sir Francis Drake, Sir Martin Frobisher, and Sir Walter Raleigh all operated as privateers with the Crown as partner. Privateering played a critical role in the American Revolution, with approximately seven hundred commissioned ships, compared to approximately one hundred ships in the US Navy. Thomas Paine owned stock in privateers, as did General George Washington. Benjamin Franklin did not own such stock, but he went to great lengths to commission privateers in France. He wanted to secure the release of American soldiers held in British prisons, but because the American military captured few prisoners, he had little with which to barter. Privateers provided a ready supply of prisoners for exchange. The apogee of the privateering system undoubtedly occurred during the War of 1812… The Comet, for example, was owned by a group of wealthy Baltimore investors who had anticipated the war. Commissioned on June 29, just eleven days after the declaration of war, this ship cleared Baltimore's harbor along with several other privateers on July 12, and it captured its first prize on July 26. Thus, in less than thirty days a fleet of cruisers was launched from the US coast ready to harass and imperil the British commercial fleet throughout the Western world. The privateers' entrepreneurial foresight stands in sharp contrast to that of the US Navy. As the war began, the navy had just eight seaworthy ships… [I]ncentives were the key to the privateering system. Most obvious, privateers chased down and captured enemy merchant ships to lay claim to the vessel and its cargo. In pursuit of this final objective, however, incentives were used throughout the privateering system. A privateering firm earned revenues from ransoms and the sale of prizes. The captain and crew were paid almost entirely in shares in the firm. The owners typically kept half the shares, and the captain and crew the other half (with some shares allocated to the vessel's repairs and maintenance and some reserved for the captain to reward especially meritorious conduct). The Comet's articles of agreement were typical. When the Comet captured the Hopewell, Captain Boyle and his crew owned 256.75 shares in total (plus 13.25 shares at the captain's disposal for rewards). Boyle himself owned 16 shares, the first lieutenant 9, the captain of marines 6, each able-bodied seaman 2, and so forth down to the greenhands, who owned 1 share each. Taxes, duties, and payments to auctioneers ate up about half of the value of a typical prize, but the crew of a privateer lucky enough to bring in prizes would still profit handsomely. The Hopewell's capture paid an able-bodied crewman $210.78, or about seven month's worth of salary in alternative employment, and Captain Boyle's 16 shares were worth $1,686.24, or at least $90,000 today. Of course, not all voyages were successful. Privateering was a high-risk, high-reward profession. Sophisticated markets allowed crewmen to sell some of their shares forward. A crewman who wanted funds right away, for example, could sell his shares to speculators… Naturally, the owners were well aware that a crewman who sold too many shares would no longer have an incentive to work as hard once onboard the ship, so contracts usually limited forward sales to roughly half a crewman's total. A crewman who wanted to sell shares also had to obtain the services of a surety, a bonding agent, who would promise to make good on the shares should the crewman abscond entirely. Shipbuilders commonly were paid partially in shares, thus improving their incentives for high-quality workmanship. In addition, the captain used the shares he held in reserve as bonuses; the first sailor to spot a prize and the first to board a fighting prize, for example, received bonus shares. Injured crewmen also received insurance payments, and in the event of a crewman's death his shares were bequeathed to his heirs. Assaults on any male prisoner of rudeness to a female prisoner resulted in fines. Thus, incentives ranging from wage contracts to performance bonds were used throughout the privateering system. Although the War of 1812 is not much remembered today, it was the war that confirmed America's independence. In this second war of independence, the privateers were the first to launch. They swept out from America's coasts, capturing and sinking as many as 2,500 British ships and doing approximately $40 million worth of damage to the British economy (approximately $525 million in today's dollars). Despite some early successes, such as the defeat of the Guerrière by the Constitution, the US Navy was for the most part captured or bottled up in port by 1813. Only the privateers continued to venture out. Jerome R. Garitee, author of The Republic's Private Navy: The American Privateering Business as Practiced by Baltimore During the War of 1812, sums up the situation well: "Private armed vessels were the only successful American offensive weapon after 1813 [that were still] engaged in the War of 1812. According to a Baltimore editor, they 'sustained the honor of the country' almost single-handedly. In doing so, they were one important factor encouraging Britain to terminate the war. British shipowners, colonial merchants, and insurance companies suffered heavy losses, and British vessels paid high insurance rates just to cross the Irish Channel after American privateers began operating in larger numbers in British waters." Aside from the direct military gains, the privateers brought revenue and goods into the country. Amazingly, the privateers had to pay import duties on their prize goods! To understand why privateering ended, it is important to understand that it was always a government program…[Privateering] never accomplished exactly what the government wanted, but when governments could not easily raise the funds to maintain large navies and when monitoring of the navies was difficult, privateering was a good option. Navies, however, gave governments greater flexibility: governments could order navy personnel to do what they wanted them to do without having to change piece rates on the fly. So when navies became more economic and easier to monitor, privateering became relatively less useful… Government's growing power made the end of privateering inevitable. The rise and decline of an organizational form, in and of itself, has no great significance, but privateering's decline signaled an important change in Americans' understanding of their country. The Founders feared and despised standing armies as a threat to liberty. For them, the country's defense was best left to citizens who would take up arms in times of national peril, form militias, overcome the peril, and then return to their normal lives. The Second Amendment protects and reflects this understanding, and privateering fit neatly within this line of thinking. Explaining why the United States would not sign the Treaty of Paris, Secretary of State William Marcy said: "The United States consider powerful navies and large standing armies as permanent establishments to be detrimental to national prosperity and dangerous to civil liberty. The expense of keeping them up is burdensome to the people; they are in some degree a menace to peace among nations. A large force ever ready to be devoted to the purposes of war is a temptation to rush into it. The policy of the United States has ever been, and never more than now, adverse to such establishments, and they can never be brought to acquiesce in any change in International Law which may render it necessary for them to maintain a powerful navy or large standing army in time of peace." Regards, By Alexander Tabarrok The Rise, Fall, and Rise Again of Privateers originally appeared in the Daily Reckoning. The Daily Reckoning, offers a uniquely refreshing, perspective on the global economy, investing, gold, stocks and today's markets. Its been called "the most entertaining read of the day."
| ||||||||||||||||||||||||||||||||||||
| Posted: 16 Dec 2010 07:45 AM PST
Nomura's chief macroeconomist, Richard Koo, whose views we have often repeated on Zero Hedge, is out with his latest prediction which unfortunately has nothing good to say about the future of the US: "We have shown—using the example of the ¥2,000trn in output that was saved in Japan and the fact that the fiscal stimulus provided by World War II quickly pulled the world’s economies out of depression—that fiscal stimulus can be a potent tool during a balance sheet recession. Unfortunately, participants in the US fiscal debate remain oblivious to this point and continue to discuss the pros and cons of fiscal policy using fiscal elasticities measured when the economy was not in a balance sheet recession. This implies that economists are heavily underestimating the elasticity of fiscal stimulus during such recessions—just as their counterparts in Japan did a decade ago—making policymakers reluctant to implement further stimulus. This reluctance leads to further economic weakness. The situation in Europe is no different from that in the US. I therefore have to conclude that the western nations have learned nothing from Japan’s lessons and are likely to repeat its mistakes." To be sure, Koo is more in the Krugman camp when it comes to rescuing a fallen Keynesian regime, and believes that stimulus at any cost is the only resolution. That said, the US now exists in a universe in which all the incremental debt issuance is being monetized directly by the Fed: an event is unparalleled in the history of the country. As such we fail to see how one can extrapolate arguments from even a bearish case that may be applicable to the current global state of affairs, which courtesy of Reinhart and Rogoff, we know is at or beyond a tipping point in terms of sovereign leverage. That said, the full note is a must read: Roller coaster ride for bond market participants The world’s bond markets have been on a two-week roller coaster ride. The week before last, the US jobs report appeared to show clear signs that any recovery in the labor market would be delayed. But that was followed last week by the announcement of an agreement between President Obama and the Republican Party that was seen as having positive implications for the economy. The November payrolls report, released on Friday, 3 December, came in below market expectations. However, some attributed the weak results to excessively strong October data, and the general view seemed to be that the results for October and November should be viewed together. Surprise agreement between President Obama and Republican Party The suddenly announced agreement between President Obama and the Republicans came as a surprise to many. The president secretly negotiated this deal with key Republican officials without consulting senior officials in his own party. News of the agreement initially sparked a heavy sell-off in the bond market. The resulting rise in yields was large enough to suggest that the downtrend in interest rates was finally over. The sell-off also led to higher mortgage rates. The agreement contains broad-ranging economic stimulus in the form of a two-year extension of the Bush tax cuts for all taxpayers, including high earners, full expensing of investments, an extension of unemployment insurance, and a reduction in payroll taxes. I do not think the extension of Bush tax cuts themselves will spark an economic recovery—after all, those tax cuts were unable to prevent the current recession. Most of the increase in unemployment insurance benefits will probably be earmarked for consumption, but it is difficult to tell how much the payroll tax cuts will boost spending. With the US household sector still deleveraging, I project that most of the tax cuts for that sector will either be saved or used to pay down debt. On the other hand, full expensing and other provisions may help. The IMF estimates the plan would lift US GDP by about 1%. Altogether, the package can be expected to provide a certain amount of support for the economy (compared with a situation in which nothing was done), although it remains to be seen whether the Democrats will approve all of the measures. Use of credit cards in US drops precipitously Thanksgiving Day, the third Thursday in November, marks the start of the Christmas shopping season. This year saw the lowest use of credit cards in the 27-year history of the survey. Only 17% of US consumers used credit cards during this period, down nearly half from the corresponding ratio for 2009. On a quarterly basis, credit card use in Q3 was off a full 11% from the same quarter a year ago. This is especially noteworthy given that the economy was already extremely weak in 2009 Q3. Part of the reduced activity, of course, is attributable to stricter card issuance standards adopted since the financial crisis, which are said to have caused 15 million Americans to lose their credit cards. More recently, however, credit card companies’ attitude towards lending has undergone a change. With profits depending on people using credit cards, issuers are now engaged in a fierce competition and have unveiled a variety of incentives to encourage consumers to make greater use of their cards. However, there has been little response from consumers, reflecting the continued efforts of US households to minimize debt. Collapse of housing myth and rising US household savings Last week I was talking with someone I met at a certain store in New York who insisted he would never use that store’s credit card again. I asked why, because I happen to carry the same card and have been very happy with it. He answered that he had spent too much with the card and now regretted it terribly. Many US consumers now find themselves in similar circumstances, and that is reflected in the credit card usage data noted above. I attribute this change in sentiment to concerns driven by the high unemployment rate coupled with the fact that US housing prices, after going 70 years without ever dropping, have declined substantially, leaving many people owing more than their homes are worth. This marks a 180° turnaround from the world in which steadily rising home prices represented a form of savings. Now, instead of increasing, these “savings” are in many cases shrinking. Japan’s real estate myth began with the end of World War II and lasted 45 years, and its collapse had a major impact on consumers’ behavior. The US housing myth was alive for a full seven decades. Accordingly, we should not underestimate the psychological shock resulting from its collapse. US tax deductions for various types of interest continued from Great Depression to 1970s Some market participants believe that with the US household savings rate as high as it is, savings are more likely to decrease than increase going forward, and that a reduced savings rate would quickly spark a recovery in the US economy. But if the current increase in US household savings is driven by the collapse of a 70-year housing myth, I think US consumers’ propensity to save may well remain at elevated levels. Americans who lived through the Great Depression, which began with the stock market crash of 1929, experienced a long-term trauma that left many of them insisting they would never again borrow money. This aversion to debt caused the after-effects of the balance sheet recession to linger on for decades because businesses and households were not borrowing and spending private savings even after their balance sheets were repaired. The US government responded by creating a variety of tax deductions for interest in an attempt to make it easier for people to borrow money. Until the 1970s virtually all types of interest—ranging from interest on credit card loans to interest on automobile loans—were deductible in the US. Upward pressure on savings rate will take time to correct Starting in the 1970s, however, US households’ savings behavior began to move in the opposite direction, leading eventually to excessive borrowing and insufficient savings. The government responded by gradually phasing out most deductions for interest, home mortgages being the key exception. But it took more than 40 years since the Great Depression to reach that point. That Japanese businesses and households remain averse to debt even today, some 20 years after the real estate bubble collapsed, also suggests that this type of trauma takes a great deal of time to get over. I think it can be argued that the US will require less time to recover. The US bubble was relatively mild in comparison with that of Japan, where 20 years ago it was said that the land underneath the Imperial Palace was worth as much as the entire state of California. However, I see a real possibility that the collapse of the 70-year housing myth and the consequent increase in the savings rate will continue until housing prices start to rise again. After all, the movement of US housing prices (but not commercial real estate) is surprisingly similar to that of Japanese prices 15 years ago in terms of the percentage increase, the duration of the increase, the percentage decline, and the duration of the decline. Re-examining US deleveraging process Last week the Fed released flow-of-funds data for 2009 Q3. The numbers indicated that the private sector deleveraging process continues, although the pace of increase in savings has moderated somewhat. As I noted in the 13 July 2010 edition of this report, the flow-of-funds data for the US for the past two years have some serious problems and cannot be taken at face value. The data divide the economy into five sectors—households, nonfinancial businesses, financial institutions, government, and the rest of the world—such that the financial surpluses or deficits for all five sectors sum to zero. The data are used to determine which sectors in the nation’s economy are saving (= financial surplus) and which are borrowing and investing (= financial deficit). For the last two years the sum of these five figures has been nowhere near zero, as Exhibit 1 shows (note that, in Exhibit 1, nonfinancial corporates and financial institutions are grouped together as the “corporate sector”).
The fact that these five figures do not sum to zero is an indication that some or all of the figures are not accurate. But without these data it is impossible to determine the scale of the deleveraging process currently underway in the US private sector. That is why I presented two measures of the “private sector” in the 13 July report: one defined as households plus the corporate sector, and the other defined as zero minus the sum of government and the rest of the world, drawing on the property that the financial surpluses and deficits of the five sectors must sum to zero (Exhibit 2). The first measure is shown in the graph as a narrow line; the latter, as a thicker line. In theory these two lines should trace exactly the same paths. Historically there has always been some divergence between the two, but recently the disparity has grown much larger. A look at the gap between the two measures for the past few years shows that if the narrow line is correct, private sector deleveraging represents at most about 8.28% of GDP. But if the thicker line is accurate, the private sector deleveraging process could amount to as much as 13.29% of GDP, which is far greater than the 8.5% (of GDP) increase in the government’s fiscal deficit during this period. That would suggest that there are still substantial deflationary gaps in the US economy.
Statistics prevent accurate measure of deleveraging On my recent visit to Washington, I was able to speak with some of the people responsible for compiling this data series. I took the opportunity to ask them about the causes of these problems with the flow-of-funds data over the past two years. They replied that the financial crisis had thrown their estimates completely off course and that they themselves were not sure what to do about it. I was even told that it would be another two years before more accurate data were available. Over the next two years, they said, new data will be used to enhance the precision of figures that can currently only be estimated. Pessimistic estimates may be closer to reality But for the policymakers and market participants who must evaluate the economy now, two years is far too long a time. When I asked the economists which of the two lines illustrating private savings behavior was closer to the reality, they said the thicker line was probably a better approximation of actual economic conditions. Their reasoning was that the thicker line can be estimated using just two types of primary data: the trade balance and fiscal balance. The estimation process is therefore far simpler than that required for the thinner line. That would imply that, as the flow-of-funds data are corrected going forward, it is far more likely that the thinner line will move closer to the thicker line than the other way around. That, in turn, suggests that the increase in savings and minimization of debt in the US private sector will continue. US private savings increased by 13.29% of GDP between 2006, when savings hit bottom, and the present. That is not far from the corresponding figures for Ireland (21.93%) and Spain (18.30%), which also have fallen into balance sheet recessions as their housing bubbles collapsed. It is also worth noting that, at 8.67% of GDP, US private savings are large enough in absolute terms to finance most of the nation’s fiscal deficit, which recent estimates put at 9.91% of GDP (Exhibit 1). Americans no longer averse to saving With US borrowings from the rest of the world having dropped from a peak of 6.03% of GDP in 2006 to just 1.24% today, the US can no longer be characterized as having an extremely low savings rate. We tend to automatically assume that the US does not save enough because that was the case for many decades. However, the data cited above demonstrate that current conditions in the US are very different from those that obtained in the past. The US now has a massive surplus of private savings—money that is saved but not borrowed and spent by the private sector—and that has triggered a balance sheet recession. On a brighter note, the existence of this surplus means the US private sector is now capable of financing the bulk of that country’s fiscal deficits. That, in a word, is why US long-term interest rates have fallen as much as they have in spite of the government’s large fiscal deficits. Agreement reached by President Obama and Republicans a step in the right direction In that sense, I think President Obama’s agreement with the opposition Republican Party to carry out further economic stimulus is a step in the right direction. It would have been even better if the package had centered on government spending instead of tax cuts, which are unlikely to provide a significant boost to the economy. In Washington, the general explanation for the focus on tax cuts was that all 60 of the new members of Congress who were elected in November are proponents of small government and would therefore be amenable to tax cuts but not increased government spending. But tax cuts provide little stimulus when the private sector is deleveraging because they do not necessarily lead to new spending. They do, however, produce a definite increase in the fiscal deficit. Tax cuts therefore increase the national debt while having relatively little impact on the economy and can further increase the size of government as a percentage of GDP. Mistaken view that fiscal stimulus is inefficient alive and well in US At a conference I participated in during my recent trip overseas, there was a debate over the multiplier effect of fiscal stimulus in the US. I was rather surprised to find that US financial specialists are repeating the mistakes of their counterparts in Japan a decade ago. Specifically, they continue to use the past results of quantitative models to estimate the multiplier effect of fiscal stimulus. As such models generally indicate the elasticity is no higher than 1.3, they argue that the economic expansion resulting from fiscal stimulus will be unable to offset the corresponding increase in the fiscal deficit. I would argue that this number is useless today because it was measured before the US fell into a balance sheet recession. The figure depends on the quantitative models’ key assumption that the US economy would limp along at zero growth even without any fiscal stimulus. These models do not assume today’s balance sheet recession world in which, absent fiscal stimulus, each surplus dollar saved by the private sector reduces final demand by the same amount, triggering a downward spiral in GDP. It was only because the government borrowed some 8% of GDP every year that Japan’s GDP stabilized at 0% growth during that nation’s balance sheet recession. Had the government stood by and done nothing, Japan’s economy would have shrunk by 8% a year. In other words, these quantitative models and the elasticities derived from them can be useful when the economy is at or near equilibrium, but are utterly useless when the economy is so far from equilibrium that the government must run fiscal deficits worth 8% of GDP just to keep output from contracting. Fiscal elasticity far higher during balance sheet recessions When Japan’s bubble collapsed, for example, national wealth worth three years of GDP was swept away in the world’s worst-ever financial tsunami. With households and businesses facing heavy balance sheet damage, excess private savings amounted to some 8% of GDP. Had nothing been done, Japan’s GDP would have contracted by about 8% a year. At the very least, output would have fallen back to the pre-bubble level of 1985. The cumulative gap between 1985 GDP and actual GDP from 1990 until businesses finished paying down debt in 2005 amounts to some ¥2,000trn. As Japan’s national debt increased by ¥460trn during this period, that means the government succeeded in supporting ¥2,000trn of economic activity with ¥460trn in additional debt. In other words, fiscal stimulus had an elasticity of four or five. Although this number is much larger than 1.1 or 1.2 figure typically mentioned for Japan’s fiscal stimulus, it is not hard to understand why. The economic impact of the government stepping in to borrow and spend money that would ordinarily be borrowed and spent by the private sector is reduced by the amount the private sector would have borrowed and spent. But during a balance sheet recession, the private sector is not borrowing and spending—in fact, it is paying down debt. Consequently, any money borrowed and spent by the government is fully reflected in higher final demand. It is therefore only natural that the elasticity of fiscal stimulus would be dramatically larger during such a recession. When properly measured, the elasticity of fiscal stimulus during such periods is very high—several times the estimates arrived at using data from ordinary periods. If balance sheet recessions were a frequent occurrence, it would be possible to derive reasonably accurate estimates of fiscal elasticities for such periods. But there was not a single occurrence between the Great Depression of the 1930s and Japan’s experience in the 1990s. Accordingly, we simply do not have the data needed to accurately measure elasticities during such periods. Europe and US may repeat Japan’s mistakes We have shown—using the example of the ¥2,000trn in output that was saved in Japan and the fact that the fiscal stimulus provided by World War II quickly pulled the world’s economies out of depression—that fiscal stimulus can be a potent tool during a balance sheet recession. Unfortunately, participants in the US fiscal debate remain oblivious to this point and continue to discuss the pros and cons of fiscal policy using fiscal elasticities measured when the economy was not in a balance sheet recession. This implies that economists are heavily underestimating the elasticity of fiscal stimulus during such recessions—just as their counterparts in Japan did a decade ago—making policymakers reluctant to implement further stimulus. This reluctance leads to further economic weakness. The situation in Europe is no different from that in the US. I therefore have to conclude that the western nations have learned nothing from Japan’s lessons and are likely to repeat its mistakes. Fiscal positions of European nations grow increasingly precarious It would appear that Germany and the IMF have finally realized the severity of the fiscal problems facing countries like Ireland and Spain and are beginning to work in earnest on aid packages for these countries. When I visited the IMF on my recent trip to Washington, it was clear that the Fund viewed assistance for Ireland as being critical. Officials I spoke with were driven by a sense of urgency, knowing that if the IMF and the EU were unable to stop the crisis from spreading, problems could propagate from Portugal to Spain, with devastating consequences. The IMF knows it needs to take a stand in Ireland. The Fund’s strategy is to buy time by providing assistance, during which time the problem countries are to engage in fiscal consolidation to the extent that it is truly necessary. Here, “truly necessary” means that without IMF aid, Ireland would have to cut fiscal expenditures starti
| ||||||||||||||||||||||||||||||||||||
| Posted: 16 Dec 2010 07:30 AM PST View the original post at jsmineset.com... December 16, 2010 11:07 AM Dear Jim, Here is another classic cartoon telling it like it is. CIGA Doug Jim, Support point 1 has failed; previous support point 1 has now become resistance. With the current level of the USDX, resistance is now $1383. Support point 2 is $1356. CIGA Stefaan More… Act Like a Jack Ass and You’ll Always Get Treated Like One CIGA Eric Three taps and out on the gold stocks has created a significant breakout in the gold stocks. Rather than galvanizing investors resolve to hold their positions, it’s obvious that weak hands can still be easily spooked out of their positions by ‘timely’ garbage analysis and news flow. Over the years the markets have taught me this personal message, "Act like a jack ass and you’ll always get treated like one." The stock operators, fully aware of the technical significance and potential of three taps and out, con...
| ||||||||||||||||||||||||||||||||||||
| Should Hank Paulson Be In Jail? Posted: 16 Dec 2010 07:27 AM PST
Leading bank analyst (and Zero Hedge columnist) Chris Whalen has raised the question of whether criminal charges should be brought against former Treasury Secretary Hank Paulson. Any discussion of whether Paulson committed unlawful actions as Treasury Secretary needs to start with Tarp. As the New York Times wrote last year:
Indeed, Congressmen Brad Sherman and Paul Kanjorski and Senator James Inhofe all say that the government warned of martial law if Tarp wasn't passed:
Bait And Switch The Tarp Inspector General has said that Paulson misrepresented the big banks' health in the run-up to passage of TARP. This is no small matter, as the American public would have not been very excited about giving money to insolvent institutions. And Paulson himself has said:
So Paulson knew "by the time the bill was signed" that it wouldn't be used for its advertised purpose - disposing of toxic assets - and would instead be used to give money directly to the big banks? Senator McCain also says that Paulson pulled a bait-and-switch:
Even the New York Times called Paulson a liar in 2008:
What tax breaks is the Times talking about? The article explains:
Tarp is just one of Paulson's shenanigans as Treasury Secretary. And Paulson's acts as head of Goldman Sachs are beyond the scope of this essay.
| ||||||||||||||||||||||||||||||||||||
| Some Irish seen turning to gold, shunning banks Posted: 16 Dec 2010 07:24 AM PST By Yara Bayoumy Ireland's government has guaranteed deposits but anxiety about what the future holds, particularly after Dublin was forced to seek a bailout from the EU and the IMF last month, has some savers seeking alternatives to the banks. "There has been an increase in demand, sustained over a period of months. There's been a slight increase in the last month. We get that every single day. From mom and pop investors to high net worth individuals," Mark O'Byrne, executive director of bullion dealer GoldCore, told Reuters. O'Byrne said the firm always advised its customers not to turn their savings exclusively into gold. "Gold is a classic hedge against the rest of your portfolio and you should put 5-10 percent," he said, adding that more companies were diversifying their cash holdings into gold than before. "We had a few (corporate deposits) per year before, now we have a few per week," he said. … Tom Crowley, a 46-year-old accountant, said he decided a few months ago to invest in gold. With banks reliant on state support, construction firms going bust and the euro under pressure over the debt crisis, gold was a "very attractive option". He now has about five percent of his portfolio in gold, "but it's something that I'm building up," he told Reuters. "I see it as a hedge and safe haven from turbulent markets. The currency risk … and what will happen with the euro prompted me to look at gold." … Ireland's banks have suffered large outflows of deposits, largely among corporate customers, since the middle of the year due to uncertainty over a growing financial crisis with its roots in years of reckless lending. … Neil Donnelly, CEO of AllSafes.ie, told Reuters the sale of home safes had increased by 80 percent in the three months to the end of November compared to a year ago. "We've seen a steady increase (in sales) since January, a larger increase in the last four, five months or so," he said. [source] RS View: Also notable is that Donnelly of AllSafes was further quoted, "More people are storing cash at home than before. A handful of customers … have said 'I don't trust the banks. I want to keep my cash at home'." Once a person has reached the point where she feels that keeping cash in a safe at home serves her needs for financial peace of mind, she will soon find her thoughts remain troubled. Ignoring the simple fact that cash can physically burn away in a hot fire (choose a fireproof safe!), she will realize that, even if its physical safety is assured, it can nonetheless "burn away" through devaluation via inflation and exchange rate movements due to ongoing fiscal laxness and poor management by her country's politicians and monetary officials. A transition from cash to gold looms large as the next logical step toward ultimate peace of mind. Once again we are reminded of Jonathan Spall's timely refrain: "All it needs are a few percentage points of allocation from portfolios to gold for the impact to be profound."
| ||||||||||||||||||||||||||||||||||||
| Tolerating Deception for the Sake of Economic Growth Posted: 16 Dec 2010 07:00 AM PST During the height of the credit crisis of 2008-9, the Federal Reserve and Treasury launched so many different lending programs and bailout facilities that it was hard to keep track of them all. Each program or facility used a distinct acronym to represent its particular portion of Bernanke's Bailout Buffet. Thus, for example, the Commercial Paper Funding Facility became simply the "CPFF." But the Fed also served up bailout facilities known as the TARP, TOP, TAF, TSLF, TALF, PDCF, AMBSPP, etc. At the end of the day, this "alphabet soup" of lending programs contained distinctions without a difference. On the receiving side of every acronym you would find a Wall Street banker with a hat in his hand. For ease of accounting, the Fed could have simply merged all the programs together into one giant WSBBF (Wall Street Banker Bailout Facility). But politics prevented that option. So instead, the Fed created lots of different programs and facilities with essentially identical mandates. And if you're curious about the volume of lending they conducted, or about any other component of the Fed's balance sheet, you can find the information right here…or at least most of the information. A friend of The Daily Reckoning recently discovered a curious error on the Federal Reserve's own Web site. By way of background, our anonymous source is neither a professional economist nor a professional investor. In fact, he's not even an amateur economist or investor. He's just a guy with an eye for detail.
One month ago, our source noticed an apparent error on the website of the Cleveland Fed. Specifically, he observed that the "Detailed View" of the Fed's balance sheet did not match the "Summary View."
So he emailed a responsible party at the Fed to gain clarification and/or elucidation. The email stream proceeded as follows [the names have been removed to protect both the innocent and the guilty]: Dear "Fed Employee," I hope you can spare a moment to answer a question. As you probably know, this web page has gotten quite a bit of attention: http://www.clevelandfed.org/research/data/credit_easing/index.cfm But it seems to me that the Summary View and the Details View don't match up. Specifically, I think the Details View omits Long Term Treasury Purchases. Once those are added in, the Details View exactly matches the Summary View. Am I right? And if so, is the discrepancy inadvertent, or is there a reason for it? Just trying to understand the context of the recently-announced QE2! Thanks in advance for any light you can shed. Sincerely, "Mr. Curious" The Fed employee promptly replied: Dear "Mr. Curious," You are correct that the Detailed View does omit Long-Term Treasury Purchases. The discrepancy is inadvertent. If you follow the link to the article in the Detailed and the Summary View, you'll see that we had initially posted these charts in between the announcement of the Agency Debt and Agency MBS purchases and the announcement of the Treasury purchases. It seems as if we just forgot to add those new purchases into the Detailed View. Thank you for pointing out our omission, and we'll work on getting that fixed. I'd also like to note that we are currently in the process of reorganizing the web page. Hopefully we'll have the new page up by the end of November, and that should clear some issues up with recent announcements on reinvestment strategy, QE2 and the AIG exit plan. Sincerely, Fed Employee After receiving this response, our anonymous source observed matter-of-factly, "So the situation [on the Fed's balance sheet] is actually a little worse than [the Detailed View] graph suggested. Without the long-term Treasurys, the balance sheet appears to have peaked in Dec 08 and since then to have wound down significantly. With the long-term Treasurys – not so much." Today, more than a month after this exchange between our source and the Fed employee, the identical error remains on the Cleveland Fed's website – a situation that seems all the more remarkable in light of the fact that the missing component of the Fed's "Detailed View" is the exact component that is expanding so conspicuously under Bernanke's QE2 campaign. If this little oversight causes a bit of consternation, get over it. "Oversights," half-truths and story-telling have become as integral to the modern American economy as railroads and assembly lines were to the American economy of the mid-20th century. In fact, half-truths and story-telling are the staples of our "confidence-based" economy. If Americans are confident, they spend, according to the prevailing economic theory of our day. And if Americans spend, the economy grows. Therefore, any statement or activity that inspires confidence is constructive for economic growth…even if the statements be false and the activities be covert and preferential. Maybe this characterization of modern American capitalism is cynical. But we beg to differ. We think it is cynical to tolerate deception – especially institutionalized deception – purely for the sake of a short-term economic objective. We think it is destructive to look the other way while the Fed and the Treasury escort a few handpicked corporations past the red velvet ropes of capitalistic competition. What has now emerged in America is a perverse form of privateering. Under the 18th and 19th century versions of privateering, governments would license private firms to plunder enemy ships for profit – profits that the privateers and the governments would share. Today, the privateering continues. But the process has been turned on its ear. Now it is we, the taxpayers, who are plundered by the government – the spoils of which it lavishes upon a select group of privileged corporations. If the "new privateers" fail, the government (i.e. taxpayers) absorbs the loss. But if the privateers succeed, they split the booty with no one but themselves. "This is called private profits and socialized risk," observed hedge fund manager, David Einhorn, during a presentation to the Grant's Investment Conference in April, 2008. "Heads, I win. Tails, you lose. It is a reverse-Robin Hood system." But the new privateering does not only rely on socialized risks, it also relies on socialized ignorance. Two weeks ago, a provision in the new Dodd-Frank financial reform law dragged some of the Fed's dirty little secrets out into the light of full public disclosure. Thanks to these new revelations, the Fed finally disclosed what many of us had already suspected – that a lot of America's biggest financial firms repaid small sums of fully disclosed federal assistance during 2009, while simultaneously accessing very large sums of undisclosed federal assistance. These "secret bailouts" did not merely socialize risks in order to confer rewards to a few; they also socialized ignorance in order to confer valuable inside information to a few. These two processes operated hand-in-hand throughout the crisis. The insider-cognoscenti made billions while the rest of us patsies wrote the checks. Without mass ignorance, government agencies have a tough time doing "what's best for us." In other words, plundering an informed populace is much more difficult than plundering an uninformed one. Eric Fry Tolerating Deception for the Sake of Economic Growth originally appeared in the Daily Reckoning. The Daily Reckoning, offers a uniquely refreshing, perspective on the global economy, investing, gold, stocks and today's markets. Its been called "the most entertaining read of the day."
| ||||||||||||||||||||||||||||||||||||
| Cameron says, ‘UK shouldn't have to pay' Posted: 16 Dec 2010 06:30 AM PST by Hazel Baker David Cameron was speaking ahead of a two-day meeting of European leaders who are gathering to discuss the eurozone economy for the seventh time this year. Top of the agenda is the creation of a permanent system to handle the sovereign debt crisis. Called the European Stability Mechanism, it would mean bondholders would share in the pain of a default. [source] RS View: The global market in bonds is huge. As bondholders absorb the message that bond investments DO entail risk, it is reasonable to expect a conservative portion of the capital currently allocated to bond holdings will be prudently transitioned over to physical gold holdings. This brings us back to what Jonathan Spall wrote in an article featured earlier today: "All it needs are a few percentage points of allocation from portfolios to gold for the impact to be profound."
| ||||||||||||||||||||||||||||||||||||
| Posted: 16 Dec 2010 06:07 AM PST Dear Jim, Here is another classic cartoon telling it like it is. CIGA Doug
Jim, Support point 1 has failed; previous support point 1 has now become resistance. With the current level of the USDX, resistance is now $1383. Support point 2 is $1356.
Act Like a Jack Ass and You'll Always Get Treated Like One Three taps and out on the gold stocks has created a significant breakout in the gold stocks. Rather than galvanizing investors resolve to hold their positions, it's obvious that weak hands can still be easily spooked out of their positions by 'timely' garbage analysis and news flow. Over the years the markets have taught me this personal message,
"Act like a jack ass and you'll always get treated like one." The stock operators, fully aware of the technical significance and potential of three taps and out, continue to relieve the weak hands of the positions. They are laughing all the way to the bank in the process. Amex Gold Bugs Index 'HEUY' (HUI):
Jerry Brown: California Budget Is "Much Worse Than I Thought — We've Been Living In Fantasy Land" Europe has exclusive rights to 'living in a fantasy land' economics according the unrelenting news flow – apparently not. And, so goes the selective amnesia of the headline feed. I'm sure this news will find adequate coverage in California's cooking sections of the printed media. California's troubles represent yet another reason why the "Formulas" are beginning to roll over and Fed initiated QE2. Please review The Timing of QE Was No Accident for further discussion on this topic. "The Formula" US Fiscal Balance vs US Dollar: Federal Government Budget As A % of GDP, 12 Month Moving Average: You know it's a bad sign when the outgoing California governor announces a fiscal emergency and everyone ignores him. Now incoming governor Jerry Brown has realized how screwed the state is and he's announcing his own budget emergency, according to the LAT. He said last night: "I'm going to try to get the budget agreements done within about 60 days. I don't think we have a lot of time to waste… It will be a very tough budget, but it will be transparent… We've been living in fantasy land. It is much worse than I thought. I'm shocked." Source: businessinsider.com
| ||||||||||||||||||||||||||||||||||||
| On The Importance of Trade and New Economic Growth Posted: 16 Dec 2010 06:00 AM PST We're sorry we've been tardy on posting another installment of the Daily Reckoning Video Series — but we think this latest addition will make up for it. In this exclusive video, Alex Tabarrok, Professor of Economics at George Mason University and research director for the Independent Institute, talks about how the story of economic growth is rapidly changing. For the first time ever, he asserts, the global economy is firing on all four cylinders – and this opens the door for new ideas, innovations and discoveries.
I'm Alex Tabarrok. I'm a professor of economics at George Mason University, and Director of Research for The Independent Institute. I'm the editor of a book called, Entrepreneurial Economics: Bright Ideas from the Dismal Science. It's a bunch of clever ideas for using incentives, for using economics to improve the world, to reduce the shortage of human organs, to improve the patent system, to do a whole variety of clever improvements. The story of economic growth has changed. But when you say innovation, you also mean change, and that has two sides. Sometimes people are afraid of the change. So during the Great Depression, in that crisis, there was definitely world retrenchment in trade. We had those things like the Smoot Holly Tariff, and trade just declined all over the world. Fortunately, in this last recession, we have not seen that to anywhere near the same extent. So that is an optimistic point. That is a good point. That is something that we have done right. We have not seen a lot of trade wars. It's something we need to be concerned about because, yes, any time other people start to get rich, people begin to wonder about their own position in the world. They begin to fear. But so far, I think we've been – I think we have learned actually some lessons from the past, and we have not cut down on trade as much as we have done in the past. Trade is absolutely critical. Think about it this way. The reason trade is important is because it makes markets much larger, and that increases the incentive to do research and development. So I like to say, you know, if China and India were as rich as the United States is today, then the market for cancer drugs would be five or six times larger than it is now, and that means five or six times the purchasing power, the incentive to do research and develop new drugs. So part of what we have to understand is that when other countries get rich, that is a benefit to us. That is not a cost. When other countries get rich, they start to contribute to the incentive to do research and development – to research and develop new drugs, new computers, new software, all kind of ideas. And this makes us rich as well. Think about the world economy as a massive parallel computer. Well, for most of the last century, most of those processes were offline. We had more than a billion people in China and India not contributing. A processor being offline. Today those processes are coming back online and are finally contributing to the world economy. Well, I'm really very optimistic about the future. And, really, for the very first time, in at least a 1000 years, the world economy is really operating almost on all four cylinders. Think about it this way. For well over a 100 years, most of the world economy has been driven by the United States, Britain, Japan, a few other countries. Today, we have China and India coming online. So what I mean by this is that we have billions of people in these countries who have been cut off from the world economy, whether through communism or whether through abject poverty, they have basically been, simply, producing enough agriculture to feed themselves, sometimes not even that, and that's it. They haven't been part of the world economy. Today that's changing. Today, for the first time, we have billions of people in China and India who are beginning to contribute ideas, innovations, new discoveries, who are beginning to contribute to the world economy. On The Importance of Trade and New Economic Growth originally appeared in the Daily Reckoning. The Daily Reckoning, offers a uniquely refreshing, perspective on the global economy, investing, gold, stocks and today's markets. Its been called "the most entertaining read of the day."
| ||||||||||||||||||||||||||||||||||||
| Money & Markets Charts ~ 12.16.10 Posted: 16 Dec 2010 05:55 AM PST View this week's chart comparisons of gold against fiat currencies, oil and the Dow. Stay tuned for our next Money & Markets segment of The Solari Report tonight, Thursday, December 16, 2010. Click here to view all charts as a pdf file. See previous Money & Markets Charts blog posts here. Currency charts are from StockCharts.com. Gold vs Oil Gold [...]
| ||||||||||||||||||||||||||||||||||||
| How America Became a Communist Nation Posted: 16 Dec 2010 05:43 AM PST Steve's note: My friend Porter Stansberry is one of the smartest guys I know. And right now, his ideas are generating huge interest – and a lot of controversy – all over the country. So I invited him to explain his ideas to DailyWealth readers in a special series this week. Read on for the latest installment… By Porter Stansberry with Braden Copeland Thursday, December 16, 2010 As I showed you yesterday, the Greeks may be the most notorious of the world's profligate nations… but they are not the real problem. The real problem is much larger and more complex. The root of the problem the world is facing right now isn't really governments… or banks. The real problem is simply a very bad idea – the idea that the State ought to sit in the center of society. Let me explain… The last 100 years (since 1914) saw not only the end of the classic gold standard, but also the fantastic ascendancy of the nation-state. These two t...
| ||||||||||||||||||||||||||||||||||||
| Top Tick Bernanke: How The Chairman Lost $46 On The Fed's Holdings Since The Launch Of QE2 Posted: 16 Dec 2010 05:28 AM PST
We have long pleaded that with a DV01 of almost $1 billion, all of it unhedged, the Federal Reserve is massively exposed to portfolio losses (courtesy of the Fed's recent transformation into the world's largest hedge fund) should interest rates commence rising. Well, sure enough after a well over 1% rise in rates in the past few months, and specifically since the advent of QE2, once the market started calling the Fed's bluff for further monetary easing, the losses incurred by the Fed are sufficiently large to where people should start asking questions. John Lohman quantifies just how substantial the unrealized portfolio damage to the taxpayer balance sheet has become since Ben Bernanke top ticked rates almost to the dot with his launch of QE2. If, in the spirit of antimatter, Jack Schwager were to compile a book entitled “Market Anti-Wizards”, chapter one would surely feature none other than The Bernank. How else to describe Uncle Ben’s trading prowess as evidenced in the chart below. Since that fateful November 3rd announcement that quantitative easing would be expanded, the Federal Reserve has lost roughly $46 billion in Treasury and Agency paper (note that this does not include the Fed’s MBS holdings, which have likely suffered similar losses). Indeed, QE2 may go down as one of the greatest top-ticks in trading history.
The American public can rest assured that Chip Kenyon, Tom Baldwin, and Hardy Brumfield are on the other side of their tax dollar trade.
| ||||||||||||||||||||||||||||||||||||
| Modern Monetary Theory , or How the US Monetary System Really Works Posted: 16 Dec 2010 05:26 AM PST This will be a series of posts that will be dedicated to Modern Monetary Theory (MMT). I want to make one thing clear - although MMT is viewed as a theory, it is really a description of how the US monetary system actually works. I am going to be posting essays on MMT piecemeal - baby steps, if you will. There's a reason for that. Intellectually, it is not a difficult theory to comprehend. the problem with understanding MMT is that we have all been lied to, or misinformed our entire lives as to how the monetary system works. There are great misconceptions and these misconceptions have been reinforced by the media, by politicians, and by analysts. I shouldn't be too hard on them, because honestly, most believe in what they say. Some foundational knowledge that should help us get through this includes definitions of common concepts: Free-floating currency: A currency is free floating when it is openly traded and is not backed by anything or pegged to any other currency. The US Dollar is free floating, which means that it is not pegged to the value of any other currency, and it is not backed by gold or any other commodity. Thus, the US Dollar has no limitations on its creation. It is therefore, free of any constraints to creation. It is not tied to a certain weight of gold, nor is it tied to another currency. The Chinese Yuan, on the other hand, is pegged to the US Dollar. So the People's Bank of China needs to "manipulate" the Yuan so it retains a consistent value against the US Dollar. Redeemable or Convertible Currency: A currency that is redeemable or convertible is one that can be exchanged for a commodity, like gold. Under a true gold standard, paper money was officially backed by gold or silver, and could be exchanged at the bank for those metals. What was the effect of this? People that lost faith in the currency could redeem it at a set price. And government was constrained by this - it could never "print" at will for fear of a gold run - meaning, the government would run out of gold. Here's what a redeemable currency looks like:  See where it says "In Gold Coin"? That means you can exchange this dollar for gold. Actually, it was also called a gold certificate because of its redeemability. Today, we have this:  It is not a certificate, but a note. See the top phrase: "Federal Reserve Note"? A Note is a promise to pay. It is debt backed money, which is money created between the Federal Reserve and the US Treasury. Thus, today's US Dollar is also described as an irredeemable or nonconvertible currency. It is what it is, and since you have to pay the US Government in US Dollars, you don't have much choice, right? But more on that later... Operationally Constrained: You will hear this phrase when we discuss the US Government's ability to create money. What this means is that the US Government does not need to raise debt or collect taxes to spend money. It is not "operationally constrained." It can spend money at will, and if it has a deficit, it creates new money, regardless of "budgetary constraints." Money Creation I want to mention that for my EU readers, this will seem extremely strange. The EU has a different system because it does not have a Central Treasury. Although the ECB can create money from nothing, it is more constrained by EU member politics, and the budgetary constraints set by the Maastricht Treaty. But for the US, money is created between the Federal Reserve, and the US Treasury. Edward Harrison of Credit Writedowns wrote on this last August: So how does it work for government? Well, the Wikipedia entry for the Federal Reserve has a pretty good summary of how the Fed operates as the government's bank: In its role as the central bank of the United States, the Fed serves as a banker's bank and as thegovernment's bank. As the banker's bank, it helps to assure the safety and efficiency of the payments system. As the government's bank, or fiscal agent, the Fed processes a variety of financial transactions involving trillions of dollars. Just as an individual might keep an account at a bank, the U.S. Treasury keeps a checking account with the Federal Reserve, through which incoming federal tax deposits and outgoinggovernment payments are handled. As part of this service relationship, the Fed sells and redeems U.S.government securities such as savings bonds and Treasury bills, notes and bonds. It also issues the nation's coin and paper currency. The U.S. Treasury, through its Bureau of the Mint and Bureau of Engraving and Printing, actually produces the nation's cash supply and, in effect, sells the paper currency to the Federal Reserve Banks at manufacturing cost, and the coins at face value. The Federal Reserve Banks then distribute it to other financial institutions in various ways. During the Fiscal Year 2008, the Bureau of Engraving and Printing delivered 7.7 billion notes at an average cost of 6.4 cents per note.The banking relationship piece is pretty much the same as it is for me and you. The government has a bank through which it pays for stuff. But that bank also acts like the government's investment bank too, offering bond deals of government debt as an investment bank does for corporate debt. So far, so good. Here's the thing though: The Fed also is there on the money creation side, as the Wikipedia quote attests. The government creates currency. It literally makes the money we use. That is an important difference between government and us. Moreover, that money is not tied to any physical commodity like gold. That's why you will often hear MMT'ers quip that sovereign debt or taxes don't fund the government's spending in a fiat currency system. What they are saying is that the government creates currency – and, therefore, as it's creator they can buy stuff with money they create without funding it first. Taxes give the fiat currency value by forcing people to use that specific currency in order to discharge their tax obligation. From an accounting perspective, they merely expunge a liability on the government's balance sheet ledger. They don't fund spending per se. There is a vestigial tie to taxes as a 'funding' source in that the U.S. government is required to issue debt in the form of Treasury bonds, bills or notes to cover deficits But this is a relic of the gold standard mandated by Congress which has not prevented the government from deficit spending. Legal tender laws make the currency widely distributed and entrench it as the money of choice within an economy. In a fiat currency system, sovereign government debt doesn't serve an important currency function like funding deficits. As I wrote last year: From the government's perspective, there is no functional difference between any of its obligations like bank notes, electronic credits, or treasury bills and bonds. As the Ten pound note says, "I promise to pay the bearer on demand the sum of [fill in the blank sum][fill in the blank fiat currency]." So, the U.S. government could legitimately stop issuing bonds altogether if it wanted to. When people complain about the admittedly enormous government debt, they don't think of the mechanics of the issue. As I see it, in a fiat money environment, the first function of the Treasury bonds is to serve as a vehicle to add or subtract reserves in the system to help the Federal Reserve hit a target Fed Funds rate. The second is to give holders of government obligations a return on their investment. After all, bank notes or bank reserves don't pay much if anything.-If the U.S. stopped issuing treasuries, would it go broke? I hope that makes it clear how few constraints there really are on government as compared to you or me. I like to think of it this way. Imagine I am the creator of currency in our country, let's call the currency "The Harrison," paper notes with little pictures of Benjamin and William Henry Harrison on them that I print up in my basement print shop. Now Harrisons have no intrinsic value. They are valuable only insofar as they are widely circulated in exchange for goods and services. And they retain that value only insofar as their supply remains limited. If I reel off a bunch of Benjamins to buy Treasury bonds, it will not necessarily erode the value of the Harrison if those Benjamins sit in bank vaults without being lent out. Imagine one day I decide to buy a few tanks for a military expedition abroad. I go to my basement and reel off a gazillion Harrisons equal in value to the tanks.* I then march down the street to the Government Bank and deposit the money in my account. Then I march down to the tank dealer and give him a check written on my Government Bank account of equivalent value to the Harrisons and the tanks. He gives me the tanks. I didn't earn the money I used through collecting taxes, now did I? Technically, I didn't actually have to issue any debt to do this. Nothing was 'funding' my purchase except the money I just created. All of this is a bit scary. I think fiat money is dangerous because the temptation to just print money is always there – and there are few constraints to this. I imagine that if people realized that governments have this much control and so few constraints, they would be worried. But that is the essence of how our fiat monetary system works. Misthos here. So what I wanted to accomplish with this post was to objectively describe the mechanics of the US monetary system. I will be writing on the policy implications and my opinions as to how this system will ultimately unravel in future posts. Included in these posts will be the creation of the Federal Reserve and the Federal Income Tax, how such a system interacts with trading partners that have a different system and buy our "debt", and the consequences of that and how the private banking system, particularly the largest banks, have hijacked the US Government. I also want to point out, as I have mentioned in other posts, that the US does not rely on China or any other country to fund itself. Nonetheless, politicians and many analysts frequently cite this when they speak of the national debt. But I want to end this post with a quote and an interview, that to me, sums up the US monetary system and also shows just how misunderstood our monetary system is. Warren Mosler, a well known MMT'er, was a candidate for US Senate, and back in June, he was interviewed on Fox Business. In that interview he said something that threw everyone off guard. The interviewer, honestly, or intentionally, seemed confused. Personally, I don't think he was confused. Here is what Warren Mosler said: "For the US Government, government spending is not operationally constrained by revenues and therefore taxes function to regulate aggregate demand and not to collect revenue per se."
| ||||||||||||||||||||||||||||||||||||
| ECB strengthens balance sheet as risks rise Posted: 16 Dec 2010 05:18 AM PST by Nina Koeppen & Geoffrey Smith "The capital increase was deemed appropriate in view of increased volatility in foreign-exchange rates, interest rates and gold prices as well as credit risk," the ECB said in a statement. The capital hike had been expected but comes amid growing concern that the ECB is taking on more and more risk on its balance sheet, notably through increased lending to banks as a result of the crisis and through its government-bond-buying program. … The Eurosystem's first balance sheet, published in January 1999, had only €685 billion in assets and liabilities. In addition, successive downgrades of the debt of euro-zone governments and banks have meant that more of the ECB's loans are secured against collateral that looks riskier with every month that passes. "The main reason for the ECB's decision is that the bank wants to send a clear signal to politicians that the bank's bond purchases are not without risk, that is, the bank is likely to keep them as limited as possible," Commerzbank analyst Michael Schubert said in a research note. [source] [related ECB Press Release]
| ||||||||||||||||||||||||||||||||||||
| Gary North: Ron Paul's potential questions for Ben Bernanke Posted: 16 Dec 2010 05:16 AM PST 1:15p ET Thursday, December 16, 2010 Dear Friend of GATA and Gold: U.S. Rep. Ron Paul's former research assistant, the economist Gary North, this week joined most of the rest of the civilized world in delighting that Paul soon may be in charge of the questions put to Federal Reserve Chairman Ben Bernanke by the House Monetary Policy Subcommittee. In an essay posted at Lew Rockwell's Internet site, North offers a few potential questions while acknowledging that there will be many more good ones aimed at exploding the secrecy of the least accountable and most totalitarian agency of the the U.S. government. North's essay is headlined "Ron Paul's Questions for Ben Bernanke" and you can find it here: http://www.lewrockwell.com/north/north920.html CHRIS POWELL, Secretary/Treasurer ADVERTISEMENT Sona Drills 85.4g Gold/Ton Over 4 Metres at Elizabeth Gold Deposit, Extending the Mineralization of the Southwest Vein on the Property Company Press Release, October 27, 2010 VANCOUVER, British Columbia -- Sona Resources Corp. reports on five drillling holes in the third round of assay results from the recently completed drill program at its 100 percent-owned Elizabeth Gold Deposit Property in the Lillooet Mining District of southern British Columbia. Highlights from the diamond drilling include: -- Hole E10-66 intersected 17.4g gold/ton over 1.54 metres. -- Hole E10-67 intersected 96.4g gold/ton over 2.5 metres, including one assay interval of 383g of gold/ton over 0.5 metres. -- Hole E10-69 intersected 85.4g gold/ton over 4.03 metres, including one assay interval of 230g gold/ton over 1 metre. Four drill holes, E10-66 to E10-69, targeted the southwestern end of the Southwest Vein, and three of the holes have expanded the mineralized zone in that direction. The Southwest Vein gold mineralization has now been intersected over a strike length of 325 metres, with the deepest hole drilled less than 200 metres from surface. "The assay results from the Southwest Zone quartz vein continue to be extremely positive," says John P. Thompson, Sona's president and CEO. "We are expanding the Southwest Vein, and this high-grade gold mineralization remains wide open down dip and along strike to the southwest." For the company's full press release, please visit: http://sonaresources.com/_resources/news/SONA_NR19_2010.pdf Join GATA here: Yukon Mining Investment e-Conference http://theyukonroom.com/yukon-eblast-static.html Vancouver Resource Investment Conference http://cambridgehouse3.com/conference-details/vancouver-resource-investment-conference-2011/15 Cheviot Asset Management Sound Money Conference Phoenix Investment Conference and Silver Summit Or a colorful poster of GATA's full-page ad in The Wall Street Journal on January 31, 2009: http://gata.org/node/wallstreetjournal Or a video disc of GATA's 2005 Gold Rush 21 conference in the Yukon: Help keep GATA going GATA is a civil rights and educational organization based in the United States and tax-exempt under the U.S. Internal Revenue Code. Its e-mail dispatches are free, and you can subscribe at: To contribute to GATA, please visit: http://www.gata.org/node/16 ADVERTISEMENT Prophecy Drills 71.17 Metres of 0.52% NiEq Prophecy Resource Corp. (TSX-V: PCY) reports that it has received additional assays results from its 100-percent-owned Wellgreen PGM Ni-Cu property in the Yukon, Canada. Diamond drill holes WS10-179 to WS10-182 were drilled during the summer of 2010 by Northern Platinum (which merged with Prophecy on September 23, 2010). WS10-183 was drilled by Prophecy in October 2010. Highlights from the newly received assays include 71.17 metres from surface of 0.52 percent NiEq (0.310 percent nickel, 0.466 g/t PGMs + Au, and 0.233 percent copper) and ended in mineralization. For more drill highlights, please visit: http://prophecyresource.com/news_2010_nov29.php
| ||||||||||||||||||||||||||||||||||||
| Posted: 16 Dec 2010 05:15 AM PST
About a year ago, after hearing so many pie-in-the-sky perma-bullish pundits and bankers say how banks paid every cent of TARP and government assistance back, I went on the following rant – 10 Ways to say No, the Banks Have Not Paid Back Their Bailout from the Taxpayer! Monday, January 18th, 2010: Yes, some of the banks repaid TARP, with interest and warrants. Okay. The investment big banks (that were still in existence) were offered expedited financial holding company (bank) charters. That is why they didn’t fail, at least in part. So, running down the list, the banks paid back TARP. That’s a +, but….
Well, all rants aside, if you bothered to go through the mass dump of data that the Fed produced as a result of the Bloomberg FOIL suit, you will find that not only did the banks not pay back the massive amount of assistance that was given to them, they were actually granted more in the form of MOPTARP (MBS Overpayment Troubled Asset Repayment Program), and yes, I did make that up. How much more? Well, potentially more than the original TARP bailout! I’m getting ahead of myself though, so let’s backtrack. As we all know, we had a credit and real estate bubble that first lifted then toppled nearly all of the major US banks. Apparently, none of the gurus on the Street saw this coming (the very same gurus who now say we are in recovery and the worst is behind us), save a tiny coterie of truth seekers (Did Reggie Middleton, a Blogger at BoomBustBlog, Best Wall Streets Best of the Best?). The downfall of the banks was basically binging on inflated, junk assets using excessive leverage at the top of a big bubble. The government used the alphabet soup of programs to bailout the banks, but the mainstream media focused primarily on TARP of about $750 billion, which kept everybody’s focus off of the real money that ran well into the tens of trillions (listed in the 3rd paragraph above). The government then agreed to buy many of the aforementioned junk assets off of the banks using programs that I warned were truly suspect. Now that we have caught up to recent history, let’s move on… These mortgage and real estate related assets are of very little value to anyone outside of vultures and speculators looking to purchase them at a deep discount, despite the fact that the government has overpaid for them continuously with taxpayer monies. Bank of America is trying to sell $1 billion of toxic mortgage assets, and these assets have already been written off, which goes to show you have bad they want to get rid of them vs trying to work them out to achieve maximum recovery. Maybe the bank has come to the same realization that I have been espousing for years, that there is little to no effective economic recovery to be had. About a month ago I explained that “The Robo-Signing Mess Is Just the Tip of the Iceberg, Mortgage Putbacks Will Be the Harbinger of the Collapse of Big Banks that Will Dwarf 2008!” and literally days later Bank of America was hit with a massive $47 billion put back request from investors. The CEO vowed to fight the requests, but now seems amenable to settle. What do you think all of the other investors will do if or when this bank (or other banks) cave without a fight? Now we have Bank of America negotiating with PIMCO over $47 billion of put backs: Bank of America Corp., after vowing to fight requests that it repurchase certain loans, has begun potential settlement discussions with some of its largest mortgage investors, according to people familiar with the situation. The group discussing a possible settlement with the nation’s largest bank as measured by assets includes the Federal Reserve Bank of New York, government-owned mortgage company Freddie Mac, BlackRock Inc. and Allianz SE’s Pacific Investment Management Co., or Pimco, a unit of Allianz SE. The approach appears to be a major shift in strategy for Chief Executive Officer Brian Moynihan, who in November pledged to engage in “day-to-day, hand-to-hand combat” on investor requests to repurchase flawed mortgages made before the U.S. housing collapse. Now, what is really the value of these securities and assets that Moynihan is trying to dump so aggressively? Let’s look at the Fed’s recent disclosures to find out. The asset buying binge that we are focusing on today was aided by the Public/Private Investment Program (PPIP, see Reggie Middleton’s Overview of the Public-Private Investment Program). The “stated goal” of the Public-Private Investment Program is “to strengthen capital base of financial institutions and enhance their ability to lend, ensure efficient price discovery of legacy assets by involving private players and minimizing the risk to taxpayers while providing opportunity to private players to earn sufficient returns.” I have raised concerns that this program is actually a backdoor bailout and would enable sole sourcing in lieu of open market, competitive bids. Thanks to Bloomberg’s FOIL suit against the Federal Reserve, we can now see how correct I have been in my warnings and proclamations regarding funny business in the MBS markets. Let’s take a look see. The Government’s MBS Purchase Program As we highlighted in Reggie Middleton’s Overview of the Public-Private Investment Program, price discovery has to occur at a natural level for a sustainable bull market which was not a prominent feature of the PPIP. In “Reggie Middleton on PPIP, part 2” Thursday, March 26th, 2009 I gave explicit examples of how collusion and price manipulation could take place in the absence of true price discovery. Fast forward to today, and we find that the Fed’s newly minted MBS sales disclosure page states that “Outright [MBS] purchases were conducted via competitive bidding to ensure that trades were executed at market rates.” However, according to a paper (h/t EB from ZH) entitled “Large-Scale Asset Purchases by the Federal Reserve / Did They Work?“, written in part by NY Fed SOMA Manager, Brian Sack states that “Because the MBS purchases were arranged with primary dealer counterparties directly, there was no auction mechanism to provide a measure of market supply. Instead, the pace of purchases of each class of MBS was adjusted in response to measures of whether that class appeared relatively cheap or expensive. To avoid buying at excessively high prices and to support market functioning, purchases were increased when market liquidity was good and were reduced when liquidity was poor.” Sounds like somebody’s stretching the truth a little, doesn’t it? Well, I dug a little farther to see just who that somebody may have been. The truth swept behind the 340,000 data item spreadsheet, buried beneath over 70,000 transactions and over 10,000 MBS-only transactions reveals….We have conducted analysis on all MBS sale and purchase transactions conducted by the Fed whose data was recently released. Of the total 10,058 MBS transactions, 72% were done at a yield of less than 5% (5% below yield of 4.0%, 32% between 4.0%-4.5%, 35% between 4.5-5.0%) with an average yield of 4.75% on all MBS transaction. The table below presents the number of transactions under their respective yield category.
We have also analyzed the yield on MBS purchased and MBS sold, looking for price discrepancies between MBS purchased and MBS sold. The data points out that the average yield on MBS purchased was 4.71%, 29bps lower than average yield for MBS sold, thus implying MBS purchased were at a higher price than MBS sold. You know that old government adage, buy high and sell low! Yield on sale: 5.00% Assuming a 4.0% implied yield on all securities, 95% of the MBS securities were purchased at a premium to market value while assuming 5.0% implied yield 28% of securities would have been purchased at a premium to market value. Of course, the question remains… Why pay a premium to market value at all (with even .01% of total purchases) in a distressed and downtrending market with highly questionable collateral? Had the government/Central Bank followed the prudent man rule and paid a slightly higher yield (avg yield of 5.0% instead of 4.75% – basically a discount for the assets as is called of in distressed buying), it would have saved $62bn of tax payers’ money on MBS transaction while a 6.0% and 8.0% yield would have saved $391bn and $869bn of tax payers’ money, respectively. Please keep in mind that Ex-secretary Paulson’s initial TARP request was for a mere $750 billion. One could be rest assured that the private sector using its own money at full recourse will be looking for steep discounts, unfortunately our fair government was all too generous. Other observationsDeutsche Bank with $411bn of trade volume, had the highest MBS transaction value followed by Credit Suisse at $383bn and Morgan Stanley at $280bn while Canto (4.55%), UBS (4.60%), Nomura (4.61%) had more favorable yields compared with other banks (average yield for transaction was 4.75%) The table below presents information on MBS transactions and yield for each participating financial institution.
All paying subscribers should feel free to download the scrubbed and analyzed data for all banks, primary dealers and investment managers here:
| ||||||||||||||||||||||||||||||||||||
| Posted: 16 Dec 2010 05:05 AM PST Gold Falls Through Support Gold fell through support at 1372.05/1371.05 in early NY trading after a much better than expected headline Philly Fed index reading for Dec. The breach of support triggered stops, pushing the yellow metal to a new 2-week low. However, a closer examination of the Philly Fed components paints a slightly different picture than simply higher levels of production. The price-paid component jumped 17.2 points in Dec and is up a whopping 41.2 points since Sep. Meanwhile, the price-received component was up 12.8 points in Dec and just 24.6 points since Dec. It's an indication of input price inflation, which is not being passed along to consumers yet. We saw this reflected in Nov US PPI (+0.8%) and CPI (+0.1%) this week too. Corporate margins are getting squeezed. The stock market caught that pretty quickly, selling-off intraday, before being lifted again by today's $6.780 bln POMO. EU leaders met in Brussels today as they continue to look for a path through the minefield that is Europe's sovereign debt crisis. German Chancellor Angela Merkel gave a rousing speech about European solidarity, saying "Europe succeeds only when it acts together." Yet that sentiment apparently still doesn't extend as far as joint debt issuance. While Eurogroup President Jean-Claude Junker and some finance minsters continue to campaign for a eurobond, Merkel warned that "with so-called euro bonds, weaknesses in Europe wouldn't be eliminated but only distributed to everybody." I find myself wondering if Mr. Junker and the others seriously think Greece for example — given their recent acts of deceit — would make serious efforts to reduce their deficit if they could continue to borrow cheaply via a eurobond? Of course those cheaper borrowing rates come at the expense of higher rates in more fiscally responsible EU countries. Hence the understandable objections from Germany and France. The BoJ launched its ¥5 trillion asset purchase program today, by buying ¥14.2 bln in ETFs and ¥2.2 bln in REITs, with the expressed purpose of driving investors into riskier assets. Yes, riskier assets were in fact the cause of the financial crisis, but a central bank is never deterred by such realities. With the Fed, the BoJ and the ECB all aggressively distorting markets, the rallying cry seems be 'inflate at all-costs.'
| ||||||||||||||||||||||||||||||||||||
| Fake-Out Thursday – Oil Scam Continues Unabated Posted: 16 Dec 2010 05:02 AM PST
Phil explains how the oil markets amount to one colossal scam, once again enriching the big bankers and energy sellers at the expense of everyone else. And of course, our propaganda machine mainstream media is making matters worse rather than engaging in objective reporting. - Ilene Fake-Out Thursday – Oil Scam Continues UnabatedWhat a joke the oil market is! First of all, the NYMEX contracts for January delivery close on Tuesday and there are still 132,168 open contracts or 1,000 barrels each (132M) scheduled for delivery to Cushing, OK, a facility that can handle at most, 45Mb of crude and is, at the moment, full. The price of those barrels surged from $86.82 all the way back to our shorting target of $89 yesterday, where we once again had a nice ride down. Now, in pre markets, it is back over $89 again and we'll short it again so I'm not complaining about the action but I am upset that this blatant rip-off of the American consumer can go on right under our "leadership's" noses. Logic alone dictates that if 132M barrels are on order for delivery to a storage facility that can only handle 45M barrels that the orders are mostly bogus. You can track the open interest every day right here so don't take my word for it, watch what happens over the next few days as the people who are currently pretending to demand oil in January, roll their contracts to pretend demand for February (already at a ridiculous 268M barrels), March (172Mb) and April (60Mb). Like the great Carnac, I will put the envelope to my head and predict that, by Tuesday, the January barrel count will fall to under 30,000 contracts, while the new front three months will rise by close to 100,000 contacts. This is scam #1 in the energy market and it goes on every month since the "Commodity Futures Modernization Act" of 2000 made it possible for thieves to run the energy markets with virtually no regulations. I've been speaking out on this for years and just this weekend, the NYTimes picked up the ball I tossed up over a year ago (better late than never!), when I pointed out that the Global oil scam was costing us 50 times more than the Madoff scandal EVERY YEAR! We're not going to go into all that again as I want to highlight scam #2 in the energy markets and that is the weekly manipulation of the oil inventory reports.
It's not just American Citizens who are paying the extra $60M per day that the $3 pop in oil costs us, the rest of the World consumes another 70M barrels a day and they are stuck with a $210M per day bill as well for each $3 gain in price. And that, of course, is before the refining mark-ups. Just the $270M a day they screwed us out of this week is a very nice $98.5Bn annual rip-off of the global population or, what I pointed out last year is a Double Madoff! Now consider that the real price of oil, when measured as global output vs. global demand on a historic basis should be closer to $60 a barrel than $90 and you have a TRILLION DOLLAR annual scam going on and our joke of a government does NOTHING to prevent it. Oh wait, I'm sorry, they do something, they accept massive campaign contributions from the Energy industry to block any legislation meant to put a stop to this on-going crime. Perhaps if it were "just" a Trillion Dollars that was being stolen we could just laugh it off and accept it but the artificially inflated price of oil impacts food and many other products plus, as I mentioned, the refining mark-up alone almost doubles the net cost to consumers so, Globally, we're paying close to $5Tn in inflated prices just so the Energy Cartel can screw us out of $1Tn. It would be much cheaper to just hand them the cash in exchange for charging a fair price for the oil, wouldn't it? By the way, I apologize to my Republican friends for the above cartoon - the Democrats have had two years to do something about this and have proven themselves to be just as big a bunch of sleazeballs as the Republican's ever were. How's that for fair and balanced. This is a GLOBAL problem and it's obviously not going to be fixed by the voters or the people in power so I'm going to reach out to the business community.
Meanwhile, has anyone noticed that the Hang Seng has dropped 800 points in 2 days? I know that doesn't fit into the Global growth narrative the MSM is shoving down our throats but surely someone is paying attention to China's rapidly declining market? Things were looking so bad this morning that Goldman Sachs tried to manipulate the market by announcing a new China-based hedge fund (2:30 am) and then the S&P jumped in at 3am and hiked China's credit rating which halted the decline for about a half hour but then they dropped another 100 points into the close.
I like to play a game in the morning called "Let's see how long I can listen to CNBC and not hear a word about this" - it's lots of fun as you watch them tap-dance around mentioning any news that goes against their narrative and China falling is a big one for them to ignore but, so far today, they are batting 1,000!
Nonetheless, commodity assets have expanded to a record $345Bn as of the end of November, led by index-led investments. In other words, the relentless targeted manipulation of the markets in this low-volume rally has gotten index funds to push heavily into commodities. This allows the Goldman's of the World to turn ordinary 401K investors into commodity bag-holders right at the top of the market while retail investors are also drawn in, plopping another $6.1Bn into ETFs, a 10% increase in a single month! We have all heard that China is having inflation issues and we've all heard that the PBOC will be hiking rates next year to combat it and we all know that the average Chinese worker makes $2,000 a year yet people continue to "invest" in the China/Commodity story as if we're at the beginning and not the end. While you are BUYBUYBUYing, keep in mind that Corporate Insiders are SELLSELLSELLing, at a pace not seen since 2007! This, of course, comes as not surprise to Phil's Stock World readers, as we have a section called the "Insider Zone" that keeps us on top of what's going on inside Corporate America and you can click on that link and see lots of fun charts so I won't try to paint a picture here other than to say - Be careful out there! See also: Bankers Secretly Meeting to Destroy the World, Yawn...
| ||||||||||||||||||||||||||||||||||||
| Gold declines to two-week low on investor sales after 26% rally in 2010 Posted: 16 Dec 2010 05:02 AM PST By Pham-Duy Nguyen The metal headed for a 10th straight annual gain amid record investment in exchange-traded funds backed by bullion. The price reached an all-time high of $1,432.50 an ounce on Dec. 7, partly on demand for a store of value amid escalating debt in the U.S. and Europe. "Gold is on the defensive," said Adam Klopfenstein, a senior strategist at Lind-Waldock, a broker in Chicago. "A lot of people have caught a huge move up this year, and they're going to look to bank profit." Gold futures for February delivery fell $18.10, or 1.3 percent, to $1,368.10 at 11:50 a.m. on the Comex in New York. [source] RS View: "They're going to look to bank profit." Indeed. And within the context of the global economic uncertainties, I might ask where, exactly, they're going to be putting these fat cash profits? In cash (for 0% and depreciation)? In a bank (for less than 1% interest)? In a bond (for less than 5% w/ default risk)? In stock (for a crapshoot)? Here's a novel idea… after looking around at the wilting wall flowers, why not stick with the winning team and "dance wit' what brought ya".
| ||||||||||||||||||||||||||||||||||||
| Bullish Indicators Not Bullish Enough to Indicate Recovery Posted: 16 Dec 2010 05:00 AM PST We live in the immediate…the urgent…the here and now…with the noise of the headlines and the blustery winds of current opinion… Yesterday, the Dow lost 19 points. Gold lost $18. But nobody cares what happened yesterday. People want to know what is happening right now. When they enter an elevator, they reach for their cellphones and Blackberries and check to see if they have messages…or if something important has happened. Trouble is, when your eyes are bolted to a Blackberry, it's very hard to know where you are. When you are caught in the whirlwind of day-by-day activity, it's very hard to see where you are going. And if you only read the news, it is almost impossible to know what is going on. So, where are we? And where are we going? You wouldn't know it from reading the press or talking to neighbors, but we are still in a funk. We only bring it up because so many people seem to have forgotten. They see double-digit gains in stocks for 2010 and of a "Santa Rally" on Wall Street. They see commodities at record prices and bond yields moving up. They read that retails sales are picking up and that small businessmen are more optimistic. What are they supposed to think? The "recovery" is real, they believe. The economy is getting back in gear. Everything is going to be okay. Heck, unemployment will be down to normal levels – 5% to 6% – within a few years; Ben Bernanke said so himself. And if this assessment were correct, what should an investor do? Well, buy a stock! Or buy a house! Or buy some copper! Buy something. You don't want to sit on cash…not when there are so many good investment opportunities. Get on board before this ship leaves the dock. After all, didn't stock market investors multiply their wealth 14 times by buying in 1982 and holding all the way to 2007? Didn't bonds go up, year after year, for the last 27 years? You might think you are almost always better off fully invested in stocks and bonds. And maybe you are. But that's why it's important to step back and look at what is really going on. This could be one of the times when it is better to hold cash. If bond yields have been going down (prices going up) since 1983, what are the trends that will continue for another 27 years? Or how about stocks? If they went up from '82 to '07, how likely is it that another big bull market is underway? Investors were encouraged recently because small businesses had turned optimistic. Yet the level of optimism is still lower than it was in the last 20 years. Hiring too was said to be picking up. But not in the last two decades have small businesses had fewer openings. The same could be said of other indicators – such as capital investment plans. Small business investment is improving, but it is still way below the prevailing since 1990. Another thing that has been cited as a bullish indicator: retail sales are rising. The November report showed a healthy gain. At the same time, figures for October and September were revised upwards. But if you look beneath the hood you find that consumers were buying necessities at an increased rate. Sales of autos, furniture, building materials and other durables actually fell heavily. What this indicates is what we keep talking about – a "back to basics" mentality, consistent with a period of private sector de-leveraging. Households are saving money too – about 6% of their disposable incomes. They're paying down debt; they're not going on another spending spree. As we pointed out last week, there are reports that consumer credit is expanding. But take out federally-backed credit, and the trend is still definitely down. Wages are rising too – but the percentage of workers getting increases is still only one quarter the level it was 10 years ago. There's also a lot of talk about inflation increasing. Martin Wolf, top economist at The Financial Times maintains that inflation is warming – just as it should. It's a sign that the feds' monetary, fiscal, and unconventional policies are working, he says. But look at the long-term trend. Core inflation is running at 50-year lows. In October, it hit its lowest level ever – that is, since they began keeping track in the 1950s. Housing, too, is still soft in the US. The latest Case-Shiller numbers show prices sinking nationwide. Apart from the '07-'09 crisis years, this is only the second time in the last 22 years that this has happened. It looked like the trend in housing prices had turned positive after bottoming out in 2009. But the most recent figures show housing has gone into a "double dip" with prices falling again. More people are getting food stamps. More people are unemployed. More people are cutting back, rather than expanding, their lifestyles. In short, the long-term trends show a Great Correction – not another boom. Bill Bonner Bullish Indicators Not Bullish Enough to Indicate Recovery originally appeared in the Daily Reckoning. The Daily Reckoning, offers a uniquely refreshing, perspective on the global economy, investing, gold, stocks and today's markets. Its been called "the most entertaining read of the day."
| ||||||||||||||||||||||||||||||||||||
| Gold Breaks Short Term Support Line Posted: 16 Dec 2010 04:50 AM PST courtesy of DailyFX.com December 16, 2010 07:04 AM Daily Candles Prepared by Jamie Saettele There are signs that this gold reversal is ‘for real’. For one, each successive peak since October sports divergence with RSI. The latest top was also accompanied by several bearish candle patterns (doji and bearish engulfing). Coming under 1130.50 would break the series of higher lows. Until then, the potential remains for one more high in order to complete an ending diagonal. Coming under 1372.70 increases confidence in the bearish bias....
|


 When they deck the halls in opulent Abu Dhabi, it comes with gold ornaments and gem-studded bows on a towering Christmas tree.


 DUBLIN, Dec 16 (Reuters) – Disgusted by how the banks have wrecked the economy and worried their savings are no longer secure, some Irish people are buying gold and diamonds or storing their money in safes until the crisis blows over.


 Yesterday,
  The Global Corporations who do not sell energy products who are also suffering as $5Tn of consumer money is being diverted away from their companies in order for consumers to overpay for food, energy and other related products. That's 10% of global GDP that could be spent on assets, rather than going up in smoke every year! The non-energy companies need to get their own lobby together - one that calls for oversight and regulation of this industry and they'd better do it soon as our friends at Goldman Sachs are already pimping for the next $5Tn rise in energy-related spending as they raise their forecasts over the $100 per barrel mark - something that will, once again, collapse the global economy while Lloyd and Co line their pockets with record bonuses and Government bail-outs.
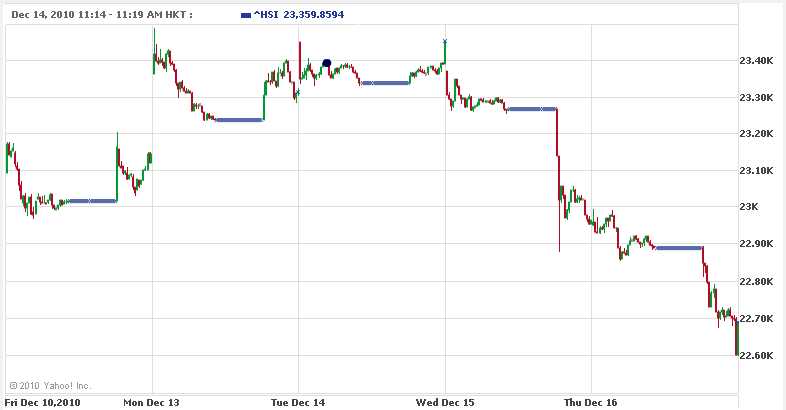
 Copper is also in it's 3rd consecutive day of decline as expanding Global inventories can no longer be swept under the rug.
| You are subscribed to email updates from Save Your ASSets First To stop receiving these emails, you may unsubscribe now. | Email delivery powered by Google |
| Google Inc., 20 West Kinzie, Chicago IL USA 60610 | |
No comments:
Post a Comment