


saveyourassetsfirst3 |
- Gold Triangle Thrust Complete?
- Trader alert: Everything you really need to know about the dollar and the euro today
- Brent Cook: 2015 is the Year of Peak Gold
- Gold Taking Cues from Forex Market Movements
- ECB may be getting desperate
- [KR681] Keiser Report: Big Problem? Regulators!
- Even More Fray
- Gold flat begins trading week
- Pakistan's jewelry exports plunged in Q3
- Metals market update for November 18
- India to declare fresh gold import curbs
- Russia central bank sees no need for curbs on gold exports
- India readies new steps to curb surge in gold imports
- ECB Buy Gold Bullion? Japans Monetary Policy Dubbed "Ponzi Scheme"
- Gold bounces back above $1 200 – will it jump higher?
- ECB Buy Gold Bullion? Japan’s Monetary Policy Dubbed “Ponzi Scheme”
- Gold has lost its glitter
- Drill safety co-operation at Barrick’s Cortez gold mine
- Koos Jansen: Who’s Feeding China’s Gold Hunger?
- Marshall Swing: Speculators Scared Out of Their Shorts!!
- Has the gold price just capitulated making it the right time to buy?
- A Signal of Coming Collapse
- Harvey Organ: Banksters Regroup After Friday’s Massive Rally
- How low can gold go?
- This is what a soaring U.S. dollar could really mean for the world economy
- Here’s what the financial system will look like in the future
- This is the most valuable investment secret in the world
| Gold Triangle Thrust Complete? Posted: 18 Nov 2014 12:24 PM PST | ||||
| Trader alert: Everything you really need to know about the dollar and the euro today Posted: 18 Nov 2014 11:50 AM PST From Chris Kimble at Kimble Charting Solutions:
CLICK ON CHART TO ENLARGE Is it time for the U.S. dollar & euro to change their current trends? My first thought would be, “What trend?” Many talk about the big moves in the U.S. dollar and euro and I just want to scratch my head and say, “Where is the trend?” The above 4-pack highlights that the U.S. dollar & euro are at the same price points as years ago (dollar resistance and euro support), with sentiment readings at extremes. Are the dollar and euro the only two assets at the same prices points? We are all aware that the Yen is in the news, due to devaluation attempts by the leaders in Japan. Did anyone notice that the Yen and Nikkei are also near the same price levels as they were 6-7 years ago, with Yen sentiment at extremes. The above 4-pack reflects that prices aren’t much different than in the past. With support/resistance in play here and sentiment at extremes, the potential is in place for short-term trend changes in these two key currencies. If the trend does change, some hard hit commodities could do well. If you like the idea of buying low/selling high and you are comfortable trading/owning commodities, you might find our Sector/Commodity Sentiment Extreme weekly report of value. | ||||
| Brent Cook: 2015 is the Year of Peak Gold Posted: 18 Nov 2014 10:44 AM PST My friends at Palisade Radio interview Brent Cook… This week, we have the popular newsletter writer, Mr. Brent Cook, from Exploration Insights, as our guest. Brent Cook is an independent exploration analyst with 30 years of experience in both property economics and geology evaluations. We brought Brent on the show to get an overview of where the gold market currently is and where it's headed. Something many investors are unaware of, peak gold, is right around the corner in Brent's opinion, and it is something that will have dramatic effects on world gold production over the long term. In this wide ranging interview with Brent, you'll discover: ● Brent's secret to minimizing losses during a bear market, and maximizing gains in the coming bull market ● Find out which major mining CEO agrees with Brent Cook on peak gold ● Why the effects of peak gold could be more dramatic than investors are aware of ● How to best pick stocks to benefit from peak gold ● Also, Brent Cook's very own exploration stock picks! The post Brent Cook: 2015 is the Year of Peak Gold appeared first on The Daily Gold. | ||||
| Gold Taking Cues from Forex Market Movements Posted: 18 Nov 2014 09:43 AM PST Take a look at the following chart comparing the price of the Euro ( in BLACK ) to the price of Gold ( in YELLOW). During December of last year, and January of this year, the linkage broke down but beginning in February the two have moved in almost perfect lockstep with one another. The connection has been especially tight since this past summer.  The take away from this is rather simple at this point - Tell me what the Euro is going to do next and I will tell you with relative confidence what gold will do. This morning there was news out of Germany that their ZEW index, a measure of economic confidence, rose in the month of November, the first time it has done so in a year. That produced a big impact in the Euro which completely erased its losses from yesterday ( do you ever get the feeling we are trading yo-yo's and not real markets?) and then added some for good measure. Back down went the Dollar and what do you think gold did? Yep - it moved higher. The point in all this is that gold is completely at the mercy of developments occurring in the Foreign exchange markets at the moment. There is still widespread weakness across the commodity sector with crude and the grains move lower today. I should also note that it looks to me like there is a line of thinking that continues to be seen out there which is regarding the sharp selloff in the crude oil and liquid energy markets as STIMULATIVE IN NATURE for the global economy. It is not the majority view but it is out there nonetheless. Thus far the sell off in crude has fed into the deflationary/slowing global growth scenario. This scenario is NOT BULLISH FOR GOLD OR SILVER. I cannot say this strongly enough. I have said it before and will say it again and again - my inbox is filled with articles from gold and silver perma bulls constantly finding fault with the US economic performance as they focus on this negative aspect of a set of economic data or that negative aspect. I have yet to find ONE article sent by any of them noting anything positive about the global economy, anywhere. It is all uniformly negative. Yet, they turn around in the very same breath and announce how bullish this is for gold and silver prices? Excuse me - but what in the world do they think has been has happening to gold and silver prices over the last three years, and in particular, the last two years? SLOW GLOBAL ECONOMIC GROWTH IS NOT BULLISH FOR PRECIOUS METALS PRICES. It is that simple. They need growth, lots of it. The kind of growth which sends the Velocity of Money rising and kicks up inflation worries. That has not been present and as a result, metals prices have been sinking lower. It has nothing to do with some supposed manipulation of the prices of the metals by bullion banks acting as agents of the Fed and everything to do with deflationary fears and a strong US Dollar. Today we got a bit of a glimpse what might happen to metals prices if the Central Bank efforts to produce an inflation rate of 2% might actually be successful. Notice the very sharp response in the Euro to that improved economic confidence reading! I would suggest to gold and silver perma bulls that they stop dissing US economic data and actually start rooting for solid growth prospects, not just here, but globally if they wish to see their metals run higher for more than a short period of time. Just a head's up - along that line, we are going to get some fundamental type news this week. Gold managed to briefly change the handle from "11" to "12" but it has not lasted very long. Mining shares are still strong at this hour however, so the bull's prospects are improving. They will however have to face the FOMC minutes and see whether or not they can weather any potential impact from those. The HUI chart looks quite strong at the moment, exactly what one wants to see if they want gold prices to move higher. Notice that the index has closed another downside gap and is actually trading above that gap at the moment. That is very bullish price action!  The index is essentially attempting to work its way back to the downside breakout point made in early October. I have noted that area as "BIG TEST". If this is something more than a bounce in the ongoing bearish trend, albeit a very strong bounce, the index will have to push past this zone and CLOSE ABOVE IT. If it were able to do this, gold should easily regain a "12" handle and one can say that a more lasting bottom is in this market. If it fails to do that, and retreats lower back down below that gap, that will signal a period of sideways movement in price or what we refer to as consolidation. Stay tuned. By the way, those of you who want to do so, might wish a Happy Birthday to GLD. It was exactly TEN YEARS ago that it opened up and began trading. There was a note on the wire services that in its first three days of trading, it took in more than $1 billion! | ||||
| Posted: 18 Nov 2014 09:31 AM PST Concerns about deflation, recession and a return to the Eurozone debt crisis may see the ECB follow Japan and print money to buy assets including shares, exchange traded funds and physical gold. | ||||
| [KR681] Keiser Report: Big Problem? Regulators! Posted: 18 Nov 2014 09:05 AM PST We discuss precious metals manipulation in Switzerland and the costs of the never-ending banking fraud – from the 'suffering and life long risks' to children in Europe and beyond to the rising cost of food hitting lower income consumers. In the second half Max interviews Alasdair Macleod of GoldMoney.com about gold, China, QE and the economy. | ||||
| Posted: 18 Nov 2014 08:28 AM PST Just yesterday, I promised you an interesting week. So far, today has not disappointed as gold continues to finally break free of the yen and surge higher. Can this continue? | ||||
| Posted: 18 Nov 2014 08:25 AM PST Gold prices did not do much of anything on Monday to begin the new trading week. This likely comes as a bit of a disappointment to the gold bulls who were probably looking for some meaningful follow through after Friday's gains. | ||||
| Pakistan's jewelry exports plunged in Q3 Posted: 18 Nov 2014 08:09 AM PST According to most recent statistics released by India's Federal Bureau of Statistics, Pakistan's gold jewelry exports plunged during the three-month period from July to September this year. | ||||
| Metals market update for November 18 Posted: 18 Nov 2014 07:33 AM PST Gold fell $14.30 or 0.36% to $1,186.40/oz yesterday. Silver slipped $0.14 or 0.86% to $16.16/oz. | ||||
| India to declare fresh gold import curbs Posted: 18 Nov 2014 07:25 AM PST Amidst fears that surging gold imports are likely to unsettle India's trade balance data, sources from Finance Ministry indicated that the government is likely to announce fresh curbs on gold imports in a day or two. | ||||
| Russia central bank sees no need for curbs on gold exports Posted: 18 Nov 2014 05:33 AM PST The country's central bank sees no need for curbs on exports of gold as proposed by some lawmakers. | ||||
| India readies new steps to curb surge in gold imports Posted: 18 Nov 2014 05:26 AM PST India is likely to announce new steps to curb imports as early as Tuesday, says a senior finance ministry source. | ||||
| ECB Buy Gold Bullion? Japans Monetary Policy Dubbed "Ponzi Scheme" Posted: 18 Nov 2014 05:09 AM PST gold.ie | ||||
| Gold bounces back above $1 200 – will it jump higher? Posted: 18 Nov 2014 05:08 AM PST Gold moved back above the psychological $1,200 level this morning. Can it retain this upwards move and perhaps extend it? | ||||
| ECB Buy Gold Bullion? Japan’s Monetary Policy Dubbed “Ponzi Scheme” Posted: 18 Nov 2014 05:02 AM PST ECB Buy Gold Bullion? Japan’s Monetary Policy Dubbed “Ponzi Scheme” Concerns about deflation, recession and a return to the Eurozone debt crisis, may see the ECB follow Japan and print money to buy assets including shares, exchange traded funds and physical gold.
Counter intuitively, gold prices fell on the quite bullish news. In marked contrast to the sharp falls gold saw on the mere rumour of small Cyprus selling their miniscule gold reserves. Such odd trading leads to continuing concerns that the precious metals markets are still being manipulated. Over the last couple of months, the ECB has launched several measures to revive the lacklustre euro zone economy. Mersch said the bank should let these steps take effect first before considering more action. If more action was needed, the ECB’s hands wouldn’t be tied as it could theoretically purchase government bonds or other assets such as gold, shares, or exchange traded funds (ETFs).
| ||||
| Posted: 18 Nov 2014 04:09 AM PST Investors should resist urge to preempt gold price bounce back. | ||||
| Drill safety co-operation at Barrick’s Cortez gold mine Posted: 18 Nov 2014 02:20 AM PST Sandvik has been working with Barrick to test out new surface drill safety features before launching its new DR461 rotary drill. | ||||
| Koos Jansen: Who’s Feeding China’s Gold Hunger? Posted: 17 Nov 2014 10:35 PM PST "Monday was a nothing sort of day from a price perspective" ¤ Yesterday In Gold & SilverAs has been the case for a while now, the gold price got sold down the moment that trading began in New York on Sunday evening. The rally that began at 9 a.m. Hong Kong time got dealt with in the usual manner as it headed towards the $1,200 spot price mark with a certain amount of vengeance. After that, the price didn't do much---or wasn't allowed to do much---you choose. The high and lows ticks weren't worth looking up, but here they are anyway. The high tick was $1,193.60 and the low tick was $1,180.80 in the December contract. Gold finished the Monday session in the New York at $1,187.20 spot down $1.30 from Friday's close. Gross volume was well over 200,000 contracts once again, but it all netted out to 159,000 contracts---and about 53,000 contracts of that amount was traded before the London open, which is an immense number, so I get the impression that JPMorgan et al had to throw a fair amount of paper at that little price spike in Hong Kong. The silver price action was identical, complete with with the sell-off at the New York open, along with the 9 a.m. Hong Kong time price spike. After that, the price got sold down about 20 cents in the two hours prior to the London open. Then it traded virtually ruler flat for the remainder of the Monday session. The high and low ticks were reported by the CME Group as $16.35 and $16.05 in the December contract Silver closed yesterday at $16.145 spot, down 18 cents from Friday. Net volume was huge once again at 47,500 contracts. Silver's net volume going into the London open was very chunky as well, a bit over 10,000 contracts. Platinum---and particularly palladium---also had price spikes at 9 a.m. Hong Kong time, but both were dealt with in the usual fashion. Platinum was closed down 10 dollars---and palladium closed in the plus column to the tune of 5 dollars, but would have done infinitely better if left to its own devices. The same can be said of the other three precious metals as well. Here are the charts. The dollar index closed at 87.55 late on Friday afternoon---and began to head lower the moment that trading began in New York on Sunday evening. The low tick/'gentle hands' rescue came at 9 a.m. Hong Kong time---which was, not surprisingly, the high tick for the price spikes in the precious metals. The rally that commenced from there was all done at, or shortly after, the London p.m. gold fix---and from there the index traded flat for the remainder of the day. The index closed at 87.995---which was up 44 basis points from Friday's close. The gold stocks opened down, but began to chop higher almost immediately---and were back in positive territory to stay by 1:15 p.m. EST, as the HUI closed up a respectable 1.92%. I was happy to see this, as the HUI got crushed last Monday after its big gains on the previous Friday [Nov 7]. Let's hope that yesterday's price action is a harbinger of things to come. Almost the same can be said of the silver equities, however they didn't do quite as well, but Nick Laird's Intraday Silver Sentiment Index still managed to close up 1.08% despite the fact that the metal itself, like gold, finished in the red. The CME Daily Delivery Report showed that zero gold and zero silver contracts were posted for delivery within the Comex-approved depositories on Wednesday. The CME Preliminary Report for the Monday session showed that, after the two surprise sessions last Thursday and Friday, gold open interest is now back down to 19 contracts still open in the November delivery month. Silver's o.i. fell one contract to 88 contracts. Not surprisingly, there was a decent amount of gold added to GLD yesterday, as an authorized participant deposited 76,882 troy ounces yesterday. And as of 5:13 p.m. EST yesterday afternoon, there were no reported changes in SLV. True to its word, the U.S. Mint had some silver eagles to sell yesterday, as they reported sales of 1,012,000 of them. How many more of the 2014 year they mint remains to be seen, but I would guess that it won't be a lot. As Ted Butler said on the phone yesterday, they could have sold many millions more of them this year if they'd had the blanks and/or the production capacity. Those that the public didn't buy would have been happily gobbled up by JPMorgan and their ilk. There wasn't much movement in gold over at the Comex-approved depositories on Friday. Only 9,645 troy ounces were reported received---and nothing was shipped out. The receipt was at Canada's Scotiabank. It was another big in/out movement day in silver, as 536,933 troy ounces were received---and 909,736 troy ounces were shipped off to parts unknown. Only JPMorgan and HSBC USA weren't involved---and the link to that action is here. Despite my best efforts, I have a boatload of stories for you today, so I'm more than happy to leave the final edit up to you. ¤ Critical ReadsThe Great Paul Volcker Speaks—-Slams Today's Central Banker PretensionsPaul Volcker, the man who broke the back of inflation in the opening years of the 1980s, is a man at odds with what Federal Reserve policy making has become. A 2% inflation target? Long-term, detailed forecasts of activity? Pledges to keep rates very low well into the future? For Mr. Volcker, who led the Fed from 1979 to 1987, these are all overly precise policy choices that promise more than any central bank can deliver. What’s worse, the policies that have come to define modern Fed policy can even be counterproductive, making central bank goals harder to achieve. Mr. Volcker, 87, weighed in on monetary policy while participating at a conference held at the Federal Reserve Bank of Philadelphia on Thursday. The former central banker occupies a hallowed place in the institution’s history, having helmed the effort that decisively killed the high inflation that boiled out of the 1970s, albeit by way of creating a sharp economic downturn. His blunt-force approach to central bank policy making stands in sharp relief to the increasingly complex web of communications and tools that have come to define the Ben Bernanke and Janet Yellen eras of central bank leadership. This commentary appeared on The Wall Street Journal website last Thursday---and I borrowed the headline from David Stockman's website. I thank reader Dan Lazicki for today's first news item. It's worth reading. Jim Rickards: Beware the Money Illusion Coming to Destroy Your WealthA money illusion sounds like something a prestidigitator performs by pulling $100 bills from a hat shown to be empty moments before. In fact, money illusion is a longstanding concept in economics that has enormous significance for you if you’re a saver, investor or entrepreneur. Money illusion is a trick, but it is not one performed on stage. It is a ruse performed by central banks that can distort the economy and destroy your wealth. The money illusion is a tendency of individuals to confuse real and nominal prices. It boils down to the fact that people ignore inflation when deciding if they are better off. Examples are everywhere. This longish, but very worthwhile essay appeared on the dailyreckoning.com Internet site last Thursday as well---and I thank Harold Jacobsen for sharing it with us. 'Obama is a lame duck': Gorbachev comments after G20Former Soviet President Mikhail Gorbachev has called the US president a 'lame duck.' Commenting on the recent G20 summit in Australia, Gorbachev said he was disappointed in Obama and that he 'thought better' of the American leader. "Obama is a lame duck. One must not finish the job in such a mediocre way. He just decided to throw accusations around. He will be of no avail any more, unfortunately. I've thought better of him," the former leader of the USSR told Rusnovosti radio. Gorbachev, who is praised around the world as a great advocate of democracy, used the American term - meaning an elected official, approaching the end of his time in office - when talking about Obama's comments at the G20 summit. This article appeared on the Russia Today website at 4:05 p.m. Moscow time on their Monday afternoon---and it's the first offering of the day from Roy Stephens. Banking culture needs fundamental overhaul not fines, Mark Carney saysMark Carney has warned bankers they should lose more of their pay in cases of wrongdoing – in addition to forfeiting bonuses – after a series of fines for bad conduct have failed to improve standards across the scandal-hit industry. The Bank of England governor signalled a radical overhaul of the way bankers are paid as he told an audience in Singapore that repeated fines for scandals, such as manipulating Libor and last week’s £2.6bn penalties for rigging foreign exchange rates, were not enough to change behaviour. New measures were needed to restore the public’s trust in the financial markets, Carney said, signalling that moves could include making bankers fund a bank’s fines out of their pay or potentially docking salaries. How about sending bankers to jail for their crimes? That would restore my confidence---but I noticed that Carney never mentioned the word in this article that appeared in The Guardian early yesterday evening GMT. It's the first contribution of the day from South African reader B.V. [I note that when I was editing this column at 4:14 a.m. EST, the 'thought police' at The Guardian have provided a new headline: It reads "Mark Carney: dock bankers' pay for misconduct" British P.M. David Cameron: Red lights are flashing on the global economySix years on from the financial crash that brought the world to its knees, red warning lights are once again flashing on the dashboard of the global economy. As I met world leaders at the G20 in Brisbane, the problems were plain to see. The eurozone is teetering on the brink of a possible third recession, with high unemployment, falling growth and the real risk of falling prices too. Emerging markets, which were the driver of growth in the early stages of the recovery, are now slowing down. Despite the progress in Bali, global trade talks have stalled while the epidemic of Ebola, conflict in the Middle East and Russia’s illegal actions in Ukraine are all adding a dangerous backdrop of instability and uncertainty. The British economy, by contrast, is growing. After the difficult decisions of recent years we are the fastest growing in the G7, with record numbers of new businesses, the largest ever annual fall in unemployment, and employment up 1.75 million in four years: more than in the rest of the EU put together. But the reality is, in our interconnected world, wider problems in the global economy pose a real risk to our recovery at home. We are already seeing that, with the impact of the eurozone slowdown on our manufacturing and our exports. We cannot insulate ourselves completely, but we must do all we can to protect ourselves from a global downturn. Working through the agenda at the G20, it was clearer than ever how vital it is that we stick to our long-term plan at home and at the same time play our part in the international response to the global challenges on which our economic security also depends. This commentary by British Prime Minister David Cameron, who has a keen grasp of the obvious, appeared on The Guardian website yesterday sometime---and I stole it from Mark O'Byrne's column over at the goldcore.com Internet site. Russian Blue Chips Might Dump London En Masse, and Re-list in Hong KongWith East-West relations at rock bottom, Russia's leading blue chip companies are toying with the idea of abandoning the London Stock Exchange as the long preferred venue for listing their shares, and moving to Hong Kong. In the last month, state-owned oil and gas giants Rosneft and Gazprom, together with privately owned oil producer Lukoil, have all said they are thinking about delisting from the LSE and floating on the Hong Kong Stock Exchange instead and denominating their stocks in Asian currencies, according to comments made by Russia's Economic Development Ministry on November 8. "The largest Russian companies - Gazprom, Rosneft and Lukoil - are considering the Hong Kong Stock Exchange as a suitable trading floor to list their securities denominated in Asian currencies (the yuan, the Hong Kong and the Singaporean dollar)," the ministry said in a statement. The banks are also talking the same game: Russia's state-owned de facto development bank Vnesheconombank says it may launch an affiliate in Hong Kong next year, while retail banking behemoth Sberbank and leading commercial bank Promsvyazbank are also considering opening branches in Hong Kong, the ministry said citing its head Alexei Ulyukayev. This very interesting article showed up on the russia-insider.com Internet site early on Monday morning Moscow time---and I thank reader B.V. for his second story in today's missive. Belgium new sick man of Europe on debt-trap fearsBelgium is creeping back onto the Eurozone's danger list as economic woes spread deeper into the EMU-core, and protracted slump poisons debt dynamics. Fitch Ratings has issued a downgrade alert, warning that the country's primary budget surplus is evaporating. It said public debt will reach 106.9pc of GDP next year. New accounting rules known as ESA2010 have revealed that Belgium is poorer than previously thought, lifting the debt ratio by 3.3pc of GDP overnight. This is in stark contrast to the upgrade for Britain, Ireland, and Finland, all deemed to be richer and therefore less troubled by debt. The agency placed Belgium on negative watch, deeming it ever further out of line among its AA-rated peers worldwide. The median debt ratio is 37pc. "Public debt dynamics have deteriorated owing to weaker real GDP growth and worse fiscal performance," it said. Belgium has been in the toilet for years, with a junk bond rating masquerading as investment grade---and now the rating agencies have finally gotten around to pointing that out. And since it's this bad on the surface then, like Italy and Spain, it must be butt-ass ugly under the hood. This Ambrose Evans-Pritchard commentary showed up on The Telegraph's website at 7:02 p.m. GMT on Sunday evening---and it's the second story of the day from Roy Stephens. Brussels Arraigns HSBC on Alleged Tax Fraud, Money Laundering: ReportsBelgian prosecutors have given notice of formal charges filed against the Swiss division of financial giant HSBC Holdings in connection with assisting high-income tax residents of Belgium evade taxation to the amount of billions euros, which is yet another criminal investigation into fraud and money-laundering against the Swiss banking giant. Belgian judicial investigator Michel Claise has accused HSBC Private Bank SA (Suisse), a subsidiary of banking corporation HSBC Holdings of aiding several hundreds of its Antwerp-based clients, among whom are diamond dealers, to illicitly move their money from Swiss bank accounts to offshore holding companies, mostly in Panama and the British Virgin Islands. This capital offshoring was undertaken as a tax evasion scheme, the prosecution alleges, according to a Wall Street Journal report. This capital flight came about in order to avoid taxes after an agreement to exchange information of bank accounts between the European Union and Switzerland was concluded. Prior to that agreement, many wealthy E.U. citizens holding money abroad enjoyed the absence of taxes on income generated by their Swiss bank deposits. This story, filed from Moscow, was posted on the sputniknews.com Internet site at 4:36 p.m. local time yesterday afternoon---and it's the first contribution of the day from reader M.A. 'Austerity kills': Thousands rally against French President Hollande in ParisThousands of people took to the streets of Paris on Saturday to protest against austerity and condemn French President Francois Hollande for betraying his voters. The demonstration gathered around 5,000 people, RT’s Ilya Petrenko reported from the French capital. A variety of left-wing political forces occupied an entire street in downtown Paris for the rally. The majority of those who came voted for socialist Francois Hollande two years ago and now say they were betrayed by the president they put in power. This article put in an appearance on the Russia Today website on Saturday eve | ||||
| Marshall Swing: Speculators Scared Out of Their Shorts!! Posted: 17 Nov 2014 08:43 PM PST SERIOUSLY, are you watching this manipulation set up? I have written numerous times over the years that they do exactly that sort of operation taking both sides of the bet because you are about to see what appears to be some market volatility but is in fact planned, calculated, pre-fabricated volatility that will shake up the […] The post Marshall Swing: Speculators Scared Out of Their Shorts!! appeared first on Silver Doctors. | ||||
| Has the gold price just capitulated making it the right time to buy? Posted: 17 Nov 2014 07:10 PM PST Could gold prices be set for an epic turnaround? The capitulation of prices in the past week or two either marks a flag down or up. Unless you think the world is on the brink of sorting out all its economic problems without another major financial crisis then this ought to be the ideal moment to be buying gold. Besides with both small and large investors now having seemingly fled gold, is there anyone left to sell? | ||||
| Posted: 17 Nov 2014 07:00 PM PST The Bank of Japan plans to buy ¥8 to ¥12 trillion per month. The government is selling ¥10 trillion per month in new bonds. This is an astonishing development. The Bank of Japan will buy 100 percent of the new government bond issuance. When the central bank is buying all of the bonds issued by […] The post A Signal of Coming Collapse appeared first on Silver Doctors. | ||||
| Harvey Organ: Banksters Regroup After Friday’s Massive Rally Posted: 17 Nov 2014 04:23 PM PST Gold and silver did not have a great day price wise. I reminded everyone on Friday that: "The bankers will regroup and will try and forcefully send gold and silver back down on Monday. Of course the problem that the bankers have is this: every time they orchestrate a huge raid, some strong entities (a […] The post Harvey Organ: Banksters Regroup After Friday’s Massive Rally appeared first on Silver Doctors. | ||||
| Posted: 17 Nov 2014 01:13 PM PST In this interview with The Gold Report, Lin identifies several producers and one near-term project uniquely positioned for the next bull market. | ||||
| This is what a soaring U.S. dollar could really mean for the world economy Posted: 17 Nov 2014 12:48 PM PST From Charles Hugh Smith for PeakProsperity.com: In early September, I made the case for a rising U.S. dollar, based on the basic supply and demand for dollars stemming from four dynamics:
Since then the dollar has continued its advance, and is now breaking out of a downtrend stretching back to 2005—and by some accounts, to 1985:
(Source) Technically, the Dollar Index has broken out of a multi-year wedge:
So what does this mean for the global economy? Since currencies are intertwined with virtually every aspect of the global economy—trade, credit, inflation/deflation, commodities and capital flows, even political and soft power—there is no one consequence, but a multitude of interactive consequences. For U.S. households, the rising dollar will have gradual, generally marginal effects: our dollars will buy more euros and yen when we visit Europe and Japan as tourists, imports from countries with weakening currencies will be slightly cheaper (if the importers don't palm the difference as extra profit) and we may be competing with more foreigners for dollar-based assets such as American homes, oil wells and Treasury bonds. In sum, a rising dollar will only affect households on the margins. Since roughly 85% of the U.S. economy is domestic, imports and exports have relatively limited influence on the entire economy. In other words, the direct consequences of a stronger dollar on U.S. households are generally positive, with the exception of those working in price-sensitive export industries, where the rising dollar will make goods sold in countries with weakening currencies more costly. But the secondary effects could end up being far more consequential for Americans and everyone else on the planet, for this reason: the centrality of the dollar in the global economy means that the effects of a stronger dollar can create potentially destabilizing dynamics. Recommended Links
Central Banks Are Responsible for the Heightened Risk One primary reason for this expansion of risk is the unprecedented actions of the world's central banks since the 2008 Global Financial Meltdown. In effect, the central banks doubled down on debt and leverage as the politically expedient "solution" to the implosion of credit and leverage (what we call de-leveraging) as the collateral underlying highly leveraged loans (think subprime mortgages on overpriced McMansions) evaporated like mist in Death Valley. Any solution that forced the write-down or write-off of the mountain of bad debt would have collapsed the over-leveraged banks which had become linchpins in the global financial system. So the only way to maintain the status quo and avoid handing massive losses of wealth to financial elites was to issue trillions of dollars in new credit-money, lower interest rates to near zero and start buying assets from private-sector owners, turning their assets into cash that could then be used to invest overseas or in domestic stocks and bonds. Each major central bank injected unprecedented sums of new money into their economies to ease the refinancing of debt at lower interest rates and enable expansion of credit for new loans. If each economy (or in the case of the European Union, currency region) was moated by strict capital-control regulations, this massive goosing of credit might have been contained within each economy. But in today's world of digital finance, capital, credit, risk and interest rates all flow wherever the risk is perceived to be controllable and the return is greatest. Let's pause for a moment to recall that risk in 2008 was perceived to be controllable right up until the day that Lehman Brothers declared bankruptcy and the global financial system erupted in a fireball of panic and liquidation. Why was risk considered controllable right up to the implosion? Derivatives and hedges were widely assumed to be solid protection against any spot of bother in global credit markets. But this confidence was misplaced, as it ultimately relied on multiple counterparties retaining their solvency. If a position was hedged by a derivative that was to be paid by a counterparty if things went south, and the counterparty blew up before the hedge could be paid off, there was no hedge. It turned out that liquidity—a market of buyers and sellers that allows any security to be sold more or less whenever the seller decides to sell—dried up, and markets for risky securities went bidless, i.e. there were no buyers at any price. If there are no buyers, the value of the security drops to zero, and everybody down the line who counted on that security fetching the anticipated price so their hedge could be paid off also implodes. Central banks countered this implosion by buying bonds and mortgages and lowering interest rates so old debt could be refinanced at much lower costs. But in doing so, they created a vast market for global carry trades—the borrowing and buying of assets in various currencies to take advantage of yield and interest-rate differences. In the old pre-digital days, it was difficult to arbitrage these variations in national currencies and interest rates. But in today's world, it's easy for financiers and financial institutions to borrow money in dollars or yen at low interest rates and re-invest the money in higher-yield securities issued in other countries. The Problem with Carry Trades and Cross-National Debt The central bank's massive issuance of new money put trillions of dollars in the carry trade, and this vast expansion of global currency/interest-rate arbitrage has put currency values front and center. The carry trade simply means cheap-to-borrow money in the US and Japan flows to emerging markets where rates are higher. If you can borrow $1 billion at a 0.25% rate in the U.S. or Japan and then buy emerging-market bonds that pay much higher yields, why not? The profit is free money. The sums of money being gambled in carry trades are enormous. It is estimated that $7 trillion of emerging market debt is denominated in another currency. According to the Telegraph newspaper (U.K.), roughly two thirds of the $11 trillion in cross-national loans are denominated in U.S. dollars. $11 trillion may not seem like much when compared to America's $16 trillion gross domestic product (GDP), but the emerging markets which have been the happy recipients of this vast river of capital have much smaller economies and credit markets. They also have fewer options to refinance debt, as they lack heavyweight central banks like the Bank of Japan, the European Central Bank and the Federal Reserve. As a result, these capital flows are extremely consequential and thus potentially disruptive. Here's the risk in carry trades: if the currency you borrowed the money in strengthens and the currency you're receiving the interest payments in weakens, the deal sours. The rise and fall in currencies can erase the profits of the carry trade. If the currencies weaken/strengthen beyond break-even, a once-profitable trade turns into a losing trade. And how do you extricate yourself from the carry trade? You sell the emerging-market assets and repatriate the money back into the currency you borrowed the money in: for example, the U.S. dollar. This has immediate supply-demand effects on currencies. The emerging-market currency that's being sold drops in value while the currency that's in demand (U.S. dollars) strengthens. We might imagine that the Federal Reserve ending its vast money-issuance program of quantitative easing would lessen the global risk posed by the carry trade, as it reduces the flood of dollars seeking higher-yield homes outside the U.S. But this tightening has actually increased the risk of carry trades blowing up and bringing down emerging-market economies, for it reduces the flow of fresh capital into emerging markets. As the supply of dollars dries up, demand for dollars rises as carry trades are unwound. Emerging-market currencies then weaken significantly, causing profitable carry trades to reverse into losing trades, which then causes those holding debt in dollars and assets in other currencies to dump the assets and pay off the dollar-denominated debts before the trade goes even more against them. There is a positive feedback in play: the more the dollar rises, the greater the losses in carry trades denominated in the dollar, and the greater the incentive for those still in the trade to sell emerging market assets and currencies. In response to these massive outflows of capital, emerging nations must raise interest rates quickly to offer incentives for capital to stay put, which then causes the cost of new loans (and doing business in general) to quickly rise to painful levels. As the currencies suffering outflows decline against the dollar, imports become more expensive and exports lose value when traded for dollars. It's a triple-whammy for emerging nations: their borrowing costs are soaring, the capital leaving to pay off dollar-denominate debt leaves them starved for investment capital, and their imports rise in cost as their exports earn less. So here is the net result of central banks pursuing quantitative easing and zero-interest rates: a massive increase in global risks resulting from the carry trades the money expansion and cheap rates fueled. The central banks' "solution" has blown another global bubble of risk that now threatens to destabilize not just the carry trades but the economies and credit systems that have become intertwined with the carry trade. In effect, the failure to address the structural problems revealed in the Global Financial Meltdown of 2008-2009 have been transferred to the larger foreign-exchange (FX) market, which is connected to virtually everything in the global economy. In Part 2: Why The Strengthening Dollar Is A Sign Of The Next Global Crisis, we examine these risks to the global economy. Not only is a rising dollar a sign of weakness elsewhere in the world, but the higher it rises, the more destabilizing global currency imbalances become. If it rises too high, it then becomes a cause of further destabilization — one that could trigger the next global crisis. Click here to access Part 2 of this report (free executive summary; enrollment required for full access) | ||||
| Here’s what the financial system will look like in the future Posted: 17 Nov 2014 12:15 PM PST In the Pharaohs' day, gold was money. Today, it might be even more important than ever. As advanced as our modern civilization may be, we've been playing with fire for more than a century. Every single experiment with unbacked paper money throughout history failed. And though today's economists like to think that 'this time […] The post Here's what the financial system will look like in the future appeared first on Silver Doctors. | ||||
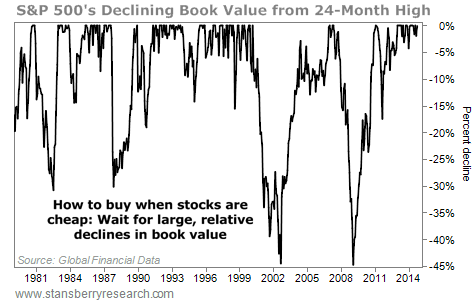
| This is the most valuable investment secret in the world Posted: 17 Nov 2014 10:10 AM PST From Porter Stansberry in The S&A Digest: Today, I’m going to show you one of the most advanced investment skills you could ever master… But I don’t want to tell you upfront what today’s lesson is about. I want to see if you can figure it out yourself. So don’t skip ahead. Think of today’s essay as a test. As I always say… there is no such thing as teaching, there is only learning. And there’s a hugely valuable investment lesson – the most valuable secret of all – below… Let’s start with the big secret about the father of value investing, Ben Graham. (It’s not that he was a notorious philanderer… Everyone knew that.) Most people know Graham literally wrote the book (or books) on how to invest: Securities Analysis and The Intelligent Investor. Likewise, most people know he was a successful investment manager. That’s all true, of course. But most people don’t know how Graham got rich. Here’s a big hint: It had nothing to do with his normal method of value investing. It had everything to do with insurance. For most of his career, Graham avoided buying insurance companies and never put more than 5% of his portfolio into any individual security. But in 1948, at the age of 54, Graham decided to allocate 25% of his portfolio into insurance firm GEICO. He bought 50% of the company for $712,000. After the purchase, the Securities and Exchange Commission (SEC) decided investment partnerships like Graham’s couldn’t own a controlling interest in an insurance company. To get around the rules, Graham distributed the GEICO shares among the various investors in his partnership. Graham never sold the shares he received from the distribution. By 1972, Graham’s stake in GEICO was worth $400 million. He made more than 400 times his money in 25 years. It wasn’t a lifetime of careful value investing that made Graham a wealthy man… It was an investment in GEICO. Graham made vastly more money in GEICO than he made in all of his other investments combined. About 10 years after buying GEICO, Graham had made so much money that he quit investing altogether and closed his fund. The success Graham had with GEICO led Warren Buffett – who was Graham’s student at Columbia University – to study the company intensely. In January 1951, Buffett famously visited the company’s headquarters on a Saturday, knocking at the front door until a janitor let him in. After speaking with GEICO executive Lorimer Davidson for four hours, Buffett put 65% of his savings in GEICO’s stock – a stake worth about $10,000. He wrote up the stock for his clients in a report titled “The Security I Like Best.” The next year, Buffett sold his position for a 50% gain or so. But the lessons Buffett learned from Davidson went on to guide Buffett’s entire investing career. Buffett has said publicly many times that those four hours with Davidson changed his life. Buffett didn’t own GEICO shares again until 1976. The company stumbled badly in the early 1970s when government regulations (no-fault rules), inflation, and aggressive plaintiffs’ attorneys radically transformed the risks of auto insurance. The company lost $126 million in 1975 and looked as though it might go bankrupt. The board brought in a new CEO, Jack Byrne, who radically restructured the company. He fired 4,000 of GEICO’s 7,000 employees, closed down 100 offices, and exited the Massachusetts and New Jersey markets. Byrne raised insurance rates by 40%. Incredibly, in less than a year, GEICO was back in the black. By 1977, GEICO was paying a dividend again. In May 1976, Buffett met with Byrne. He was impressed. Buffett believed the turnaround at GEICO would be successful. It’s a little ironic, because Buffett is famous for refusing to invest in turnaround situations. He says most turnarounds “don’t.” But in this case, he had been following the company closely for 25 years… and determined it was the best business he had ever found. He got to know the CEO. He knew he could personally provide the financing required. That’s a much different situation than you or me buying shares of a cheap stock and hoping it goes back up. Following a dinner with Byrne, Buffett began to buy huge blocks of GEICO shares. The first order was for 500,000 shares at $2.12. He later provided a huge amount of capital to the company – $75 million – through a convertible bond. His cost basis for the stock through this instrument was $1.31 per share. Buffett’s money helped save GEICO. By 1980, he owned one-third of the company. GEICO represented 31% of Berkshire Hathaway’s equity portfolio at the time. Like his mentor Ben Graham, Buffett was now poised to make tremendous profits. He had allocated a huge portion of his net worth into the best business he had ever found. By 1985, GEICO represented 50% of Berkshire’s portfolio. By 1994, Berkshire had received $180 million in dividends from GEICO – seven times more money than Buffett spent on buying the stock. Finally, in 1995, Disney bought out ABC/Capital Cities, whose shares Berkshire held. The deal gave Buffett a huge $2 billion profit. Buffett used the cash to buy the remainder of GEICO that Berkshire didn’t own for $2.3 billion. By that point, Buffett had earned 48 times his initial investment in the company. Today, GEICO’s float (the amount of insurance premiums it carries) is in excess of $16 billion – up from $3 billion in 1995. If GEICO was publicly traded, it would be worth something around $20 billion. Buffett’s initial $25 million investment would now be worth at least $10 billion… 400 times his initial investment. Now… with that in mind… let me switch gears for a minute. The chart you see below is unusual. I would wager you haven’t seen a chart like this before. It’s designed to show you periods of time when you should have been buying stocks. It does so in a simple way: it measures changes to the S&P 500′s book value as a percentage below its 24-month high. We have good data on the S&P 500′s book-value ratio since 1978. This chart makes it clear when good opportunities to buy stocks existed. Longtime investors will surely be familiar with these years: 1981, 1987, 2002, and 2009…
During my career – from 1996 to today – I’ve seen several excellent buying opportunities in stocks… The first was in August 1998 when Russia defaulted. Many high-quality emerging-market stocks were trading for less than four times earnings. The second was the end of the tech-stock bubble in 2002. My Investment Advisory subscribers can read the October 2002 issue to see how I described conditions at the time. (On the first page, I asked, “Is it the end of the world?”) During this period, many high-quality technology-related businesses were trading for less than the cash on their balance sheets. The biggest, best-known market correction of my career was in late 2008/2009, when even the world’s highest-quality businesses were trading at decade-low valuations. I recall analyzing shares of jewelry company Tiffany in February 2009 and realizing that the stock was worth $24 per share, assuming you just sold the inventory and used the proceeds to buy back all of the stock and pay off all of the debts. The stock was trading at $22. Tiffany was trading below liquidation value, implying that you could get the brand name, the operating profits, the future growth, and all of the real estate for free. I doubt you’ll ever see an investment as good as Tiffany’s trading cheaper than that. (As a side note, Tiffany shares trade for around $96 today. The company has paid $6.44 per share in dividends. By simply buying shares in February 2009, you would be up more than 360%.) Based on these experiences, I’ve come to expect a good opportunity to buy stocks about once every five to seven years… and a great opportunity to come around about once every decade. Lo and behold, when I asked Steve Sjuggerud’s research analyst Brett Eversole to check the historical numbers for me, he found eight different 19%-plus corrections (declines) in the S&P 500 since 1976. Again, these dates will be familiar to longtime investors: 1977, 1981, 1987, 1990, 1998, 2002, 2008, and 2011. Investors become euphoric after a period of gains. They become depressed after losses. It’s human nature that’s being expressed in these charts. What’s the difference between a good opportunity to buy and a great one? Studying the corrections we’ve seen since the 1970s, a good opportunity is a 20% or so decline in the S&P 500′s price-to-book-value ratio. The 2011 correction saw the S&P 500 fall 19.4%, but the ratio only declined 17.5%. This was the least impressive opportunity in our study, but that’s largely because stocks were coming from a super-depressed bottom two years earlier. In contrast, a great opportunity to buy is after the S&P 500′s book-value ratio declines 30% or more, like it did in 1981, 1987, 2002, and 2008. The 1990s – a roaring bull market inspired by falling interest rates – was the only decade in my lifetime that didn’t offer a great opportunity to buy stocks. Keep in mind that if the book-value ratio of America’s 500 largest companies has declined by 30% or more, you will be able to find dozens (if not hundreds) of high-quality businesses where book-value ratio has declined 50% or more. So… What do you think the underlying message of today’s essay is? Remember, I was trying to teach you the most advanced skill you can possess as an investor. What’s that skill? What do these stories reinforce? The most advanced skill you can develop as an investor isn’t knowledge of arcane accounting rules. It’s not developing real expertise in charting. It’s not even becoming an expert in position-sizing and risk management. The most advanced skill you can develop as an investor is simply the emotional discipline to be incredibly patient. If you want to succeed in investing, you have to be other-worldly in your ability to wait until you get the rarest of opportunities – a chance to buy the businesses you’ve always wanted at the right price. Buffett knew all about GEICO. He saw exactly how it enriched his mentor beyond belief. He knew it would certainly enrich him (assuming he bought it at the right price). As a young man, Buffett had foolishly advertised the opportunity and, even more foolishly, he sold the stock rather than simply continuing to buy more. He then spent the next 34 years waiting for the right opportunity to buy the company. He waited and waited and waited and waited. Then he made 400 times his money. Think about that the next time you’re going to buy a stock. Is it a great time to be buying stocks? Is it the best time you’ve seen in five or 10 years to make investments in the stock market? Is the stock you’re about to buy really trading at the cheapest price you’ve ever seen? Is it really a chance to make 400 times your money over several decades? The more patient you become, the better your investments will be. I guarantee it. Patience is Buffett’s greatest virtue. He figured out what businesses he wanted to own when he was in his 20s. Then he waited until he got the opportunity to buy them at prices he knew would make him extremely rich. There’s no reason you can’t do the same – even if you’re older than 50. Don’t forget: Graham bought GEICO when he was 54. And Buffett’s best investment ever was in Coca-Cola. He started buying the blue-chip soda brand after the 1987 collapse. He was 57 years old when he made that investment. My advice: Keep a list near your computer or on your desk. When you come across a truly great business – a business that has enriched investors for decades – write down the name. Read its annual reports. Follow its progress. Get to know the business like you know your siblings or your spouse. See how the company responds in good times and bad times. Then… wait for the market to give you a great opportunity to buy the stock. |


| You are subscribed to email updates from Gold World News Flash 2 To stop receiving these emails, you may unsubscribe now. | Email delivery powered by Google |
| Google Inc., 1600 Amphitheatre Parkway, Mountain View, CA 94043, United States | |
No comments:
Post a Comment